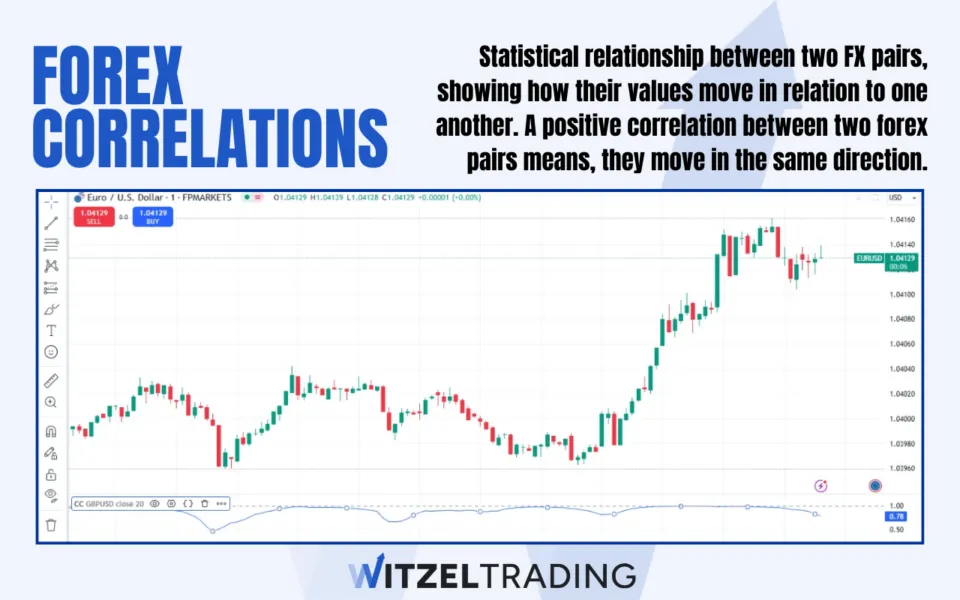
Forex correlations describe the statistical relationship between two currency pairs, showing how their values move in relation to one another. When two currency pairs show a positive correlation, they move in the same direction. Meanwhile, a negative correlation means they move in opposite directions.
Understanding these correlations can help traders spot connections between markets, manage risk, and find new trading ideas. By using correlation data, you can anticipate how changes in one pair might influence another and adjust your trading decisions.
Key Facts About Forex Correlations:
- Forex correlations measure how two currency pairs move in relation to each other.
- A negative correlation shows that the two pairs usually move in opposite directions.
- Correlations are not fixed; they can change over time due to shifting market conditions.
- Traders often use correlation tools or tables to understand relationships between different pairs.
- Some currency pairs maintain stronger correlations due to economic or geographic ties.
(Never Trade In Uncertainty Again – Join The WR Trading Mentorship)
How to Calculate Forex Correlations
Calculating forex correlations is complicated, but the good news is that you don’t need to be a math expert, as many free tools and platforms can do the maths for you and provide instant results. Still, understanding the maths is important if you ever need to calculate forex correlations yourself.
The correlation calculation is based on how two currency pairs’ prices move relative to one another over a certain period. Once calculated, you get a number between -1.00 and +1.00. This “correlation coefficient” tells you if the pairs move together (+1.00), move in opposite directions (-1.00), or hardly affect each other (near 0).
The Forex Correlation Formula (with Example)
Correlation = Covariance (X, Y)x y
- X and Y represent two sets of price changes (for example, daily returns) for two currency pairs.
- Covariance measures how the pairs move together. Do they both go up or down at the same time?
- σx and σy are the standard deviations (a measure of how spread out the numbers are) for each currency pair’s price changes.
Example: You’re curious about how the EUR/USD and GBP/USD move in relation to each other over 3 days.
Our Data (Daily Returns):
- EUR/USD (we’ll call this X): Day 1: +0.0010, Day 2: +0.0005, Day 3: -0.0005
- GBP/USD (we’ll call this Y): Day 1: +0.0007, Day 2: +0.0003, Day 3: -0.0004
Step 1: Find the Averages (Means)
For EUR/USD (X):
Add up the three changes: 0.0010 + 0.0005 + (-0.0005) = 0.0010 + 0.0005 – 0.0005 = 0.0010
Divide by 3 (the number of days): 0.0010 / 3 ≈ 0.0003333
Average (mean) of X ≈ 0.0003333
For GBP/USD (Y):
Add up the three changes: 0.0007 + 0.0003 + (-0.0004) = 0.0010 – 0.0004 = 0.0006
Divide by 3: 0.0006 / 3 = 0.0002
Average (mean) of Y = 0.0002
Step 2: Find How Far Each Day’s Value Is From the Average
For each day, subtract the average from the actual daily return.
For X:
- Day 1: 0.0010 – 0.0003333 = 0.0006667
- Day 2: 0.0005 – 0.0003333 = 0.0001667
- Day 3: -0.0005 – 0.0003333 = -0.0008333
These are the “differences” from the mean for X.
For Y:
- Day 1: 0.0007 – 0.0002 = 0.0005
- Day 2: 0.0003 – 0.0002 = 0.0001
- Day 3: -0.0004 – 0.0002 = -0.0006
These are the “differences” from the mean for Y.
Step 3: Multiply the Differences for Each Day and Add Them Up
We line up each day’s difference for X with the same day’s difference for Y, multiply, and then sum them.
- Day 1 product: X diff * Y diff = 0.0006667 * 0.0005 = 0.00000033335
- Day 2 product: 0.0001667 * 0.0001 = 0.00000001667
- Day 3 product: (-0.0008333) * (-0.0006) = 0.00000049998 (negative times negative is positive)
Now add these three products together:
0.00000033335 + 0.00000001667 + 0.00000049998 ≈ 0.00000085 (rounded)
This number helps us find something called “covariance,” which is basically a measure of how these two sets of numbers move together.
Step 4: Get the Covariance
To find covariance, we divide the sum from Step 3 by (number of observations – 1).
We have 3 days, so (3 – 1) = 2.
Covariance ≈ 0.00000085 / 2 = 0.000000425
Step 5: Calculate Each Set’s Standard Deviation
For X:
We use the differences from the mean (Step 2 for X):
X differences: [0.0006667, 0.0001667, -0.0008333]
- Square each difference (to make all positive):
- (0.0006667²) ≈ 0.0000004444
- (0.0001667²) ≈ 0.0000000278
- (-0.0008333²) ≈ 0.0000006944
- Add them up: 0.0000004444 + 0.0000000278 + 0.0000006944 ≈ 0.0000011666
- Divide by (3 – 1) = 2: 0.0000011666 / 2 = 0.0000005833
- Take the square root: √0.0000005833 ≈ 0.0007638
This is σx (the standard deviation of X).
For Y:
Y differences: [0.0005, 0.0001, -0.0006]
- Square each:
- (0.0005²) = 0.00000025
- (0.0001²) = 0.00000001
- (-0.0006²) = 0.00000036
- Add them up: 0.00000025 + 0.00000001 + 0.00000036 = 0.00000062
- Divide by 2: 0.00000062 / 2 = 0.00000031
- Square root: √0.00000031 ≈ 0.000557
This is σy (the standard deviation of Y).
Step 6: Calculate the Correlation
Finally, we use the formula:
Correlation = Covariance / (σx * σy)
We have:
- Covariance ≈ 0.000000425 (from Step 4)
- σx ≈ 0.0007638
- σy ≈ 0.000557
Multiply σx by σy:
0.0007638 * 0.000557 ≈ 0.000000425
Now divide Covariance by this product:
0.000000425 / 0.000000425 ≈ 1.0
A number close to +1 means EUR/USD and GBP/USD generally moved in the same direction during these three days. If we had slightly different numbers, we might have gotten something like 0.85 or 0.7, which still indicates a positive relationship but not perfectly so.
Keeping It Simple:
- We took daily changes for two currency pairs.
- Calculated their averages.
- Measured how far each day’s result was from those averages.
- Used those differences to find a number (the correlation) that tells us how closely these two sets of changes move together.
In reality, you don’t need to do this by hand. Online calculators and trading tools can do all these steps instantly. But now you have a beginner-friendly understanding of what the calculation involves and what the final number means.
Remember:
- A correlation close to +1 means they move together.
- A correlation close to -1 means they move opposite.
- A correlation around 0 means there’s not much connection.
(Never Trade In Uncertainty Again – Join The WR Trading Mentorship)
Tools for Analyzing Forex Correlations
Understanding forex correlations is one thing, but having the right tools to analyze them makes the process much smoother. Traders rely on various resources to quickly assess correlation strengths, monitor their changes, and integrate these insights into their decision-making process. Although you can calculate the correlations like we just did, using these tools is faster and results in fewer mistakes as you won’t have to calculate anything manually.
Online Correlation Tables
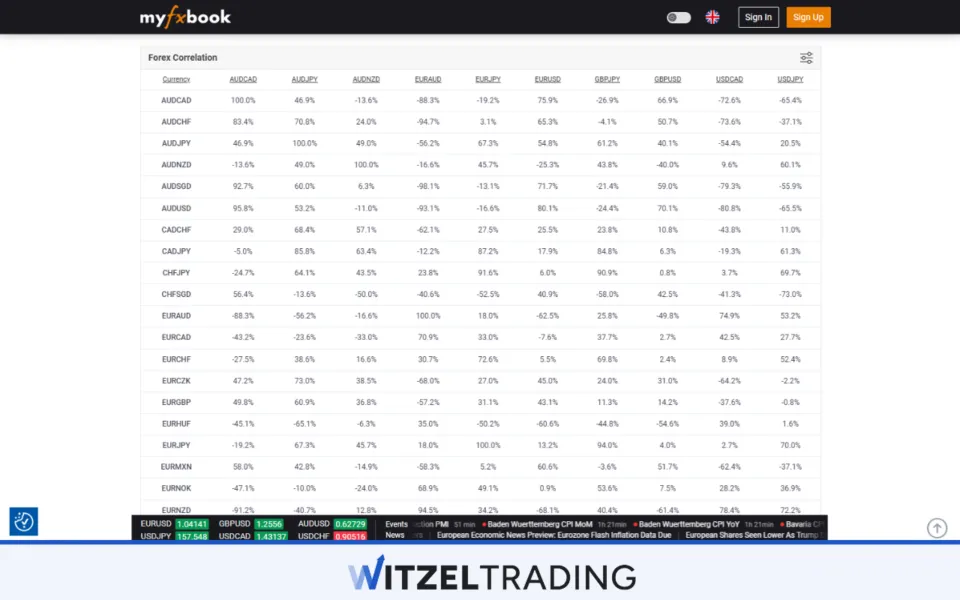
Online correlation tables are convenient, user-friendly resources that show how currency pairs relate over a chosen timeframe. The table allows users to adjust the time period to see if correlations are stable or shifting, helping them stay flexible and proactive in an ever-changing market environment.
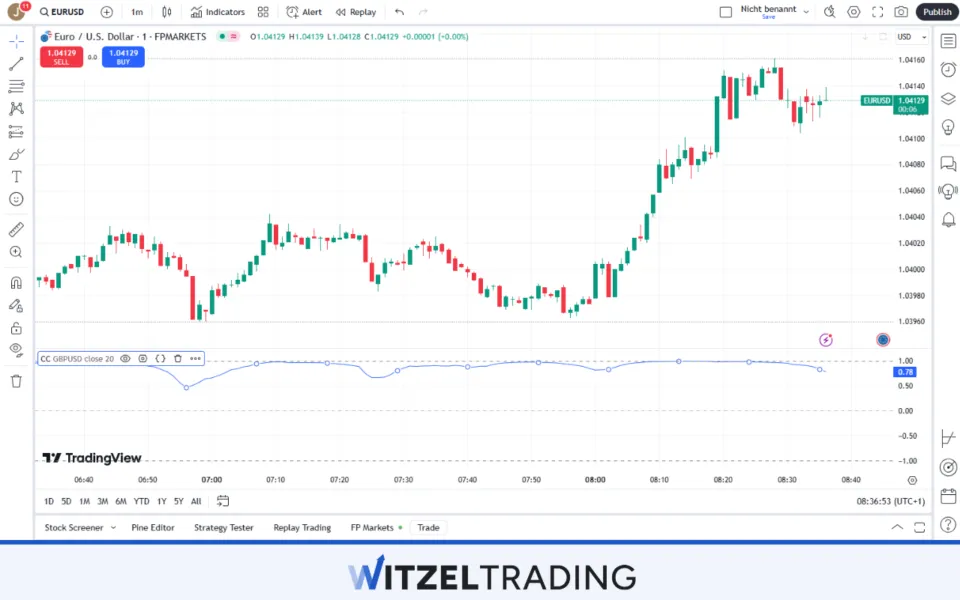
Built-In Platform Indicators
Many trading platforms offer built-in correlation indicators or plugins. These tools visualize relationships directly on your charts or in separate windows, allowing you to spot correlations without constantly switching between different pages. The convenience of having everything in one place supports more efficient analysis and decision-making.
Spreadsheet Calculations
Some traders prefer a hands-on approach using spreadsheet software to calculate correlations. Importing price data and applying correlation formulas gives you complete control and transparency over the process.
This manual method can reinforce your understanding while providing highly customizable results.
Specialized Third-Party Tools
There are multiple specialized tools and services that focus on correlation analysis, often including additional features like alerts or historical comparison functions. These platforms might show correlations between not only currencies, but also commodities or indices, giving traders an even broader perspective. Accessing such all-in-one solutions can streamline your workflow and enhance your trading experience.
(Never Trade In Uncertainty Again – Join The WR Trading Mentorship)
How Can You Benefit From Forex Correlations as Traders?
Traders can benefit in several ways from forex correlations as they highlight how different pairs move in harmony or opposition, letting you manage risk more intelligently, and spot market turns earlier. Here are the main benefits:
- Identify Opportunities Early: By knowing how currency pairs move in relation to one another, you can spot potential shifts in market direction before they become obvious to everyone. This early awareness allows you to position your trades more strategically and improve your timing. Over time, gaining experience with correlations helps you consistently find better entry and exit points.
- Improve Risk Management: Recognizing correlated pairs helps you see when your trades may be overlapping in terms of exposure. Instead of accidentally taking multiple positions that rise and fall together, you can spread out your risk and avoid heavy losses if one part of your strategy doesn’t work out. This approach leads to more stable returns and helps protect your trading account from sudden setbacks.
- Refine Your Trading Strategies: Correlations are helpful for your analysis of any single currency pair. If you expect EUR/USD to rise, which usually moves in sync with GBP/USD, seeing GBP/USD head the same way may confirm your idea. This confirmation boosts your confidence and reduces guesswork, leading to more well-founded trading decisions.
- Spot Hidden Relationships Over Time: Market dynamics change, and correlations often evolve as economies grow, adjust policies, or face unexpected events. By monitoring these relationships regularly, you can recognize when something new is happening behind the scenes. Such insights can give you an edge, allowing you to adapt and potentially profit from emerging patterns before others notice.
- Improve Decision-Making and Confidence: Correlation data adds another layer of analysis that supports your overall trading judgment. When your trade idea aligns with how related currency pairs are behaving, you feel more assured about placing that trade. Greater clarity and confidence often translate into better results and a more consistent approach to trading.
Can Currency Correlations Used for Hedging?
Yes, using pairs that often move in opposite directions can offset potential losses if your main trade goes against you. For example, if you’re long on EUR/USD and worry about a sudden drop, taking a position in a negatively correlated pair like USD/CHF can help balance your overall exposure. This approach won’t remove all risk, but it can smooth out returns and make unexpected market swings easier to manage.
What Are the Most Popular Forex Correlations?
Many currency pairs share well-known relationships with each other or with other markets. Recognizing these patterns can help you understand how one pair’s movement might influence another. Below are ten popular examples, each offering insights that can give your trading decisions more depth.
- EUR/USD and GBP/USD: These two often move in the same direction because both are tied to Europe’s economic performance and share the U.S. dollar as a common factor. Strength in the Eurozone or weakness in the U.S. economy can push both pairs upward. Traders watch their relationship to confirm bullish or bearish moves involving the dollar.
- EUR/USD and USD/CHF: These tend to move opposite to each other. When EUR/USD climbs, USD/CHF often falls, reflecting investors shifting their money between the Eurozone and Switzerland. This inverse link helps traders hedge positions or confirm if dollar strength or weakness is broad-based.
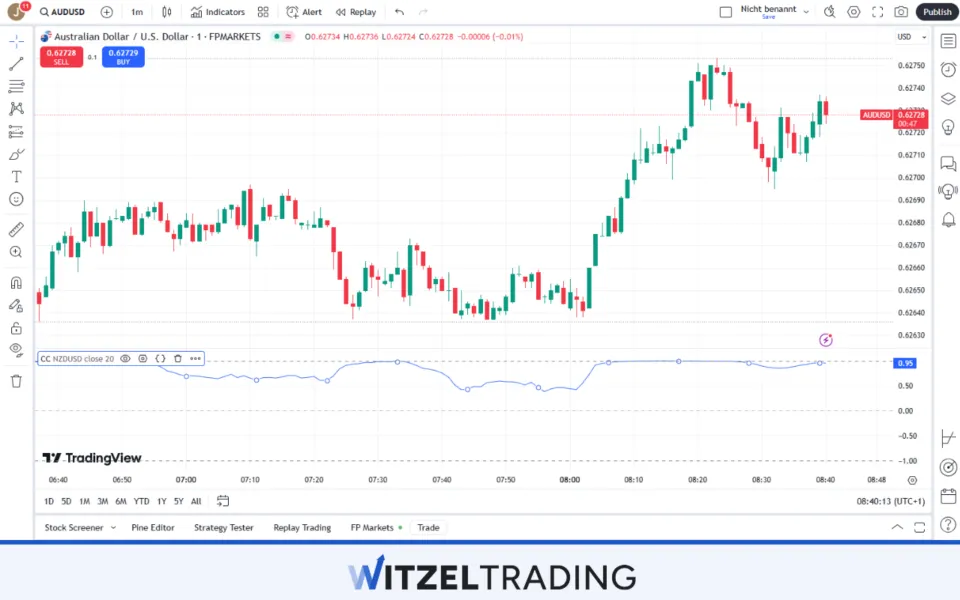
- AUD/USD and NZD/USD: Australia and New Zealand’s economies share close ties, often causing their currencies to move together. If commodity demand lifts AUD/USD, chances are NZD/USD will also benefit. Tracking them together can highlight regional economic trends.
- USD/CAD and Oil Prices: Canada is a major oil exporter, so when oil prices rise, USD/CAD often declines because the Canadian dollar gains strength. This link gives traders a way to anticipate moves in the pair by following the energy market. Monitoring oil helps you see if the CAD might gain ground against the dollar.
- AUD/USD and Gold: Australia’s economy is strongly linked to gold exports, making the Australian dollar sensitive to changes in gold prices. As gold rises, AUD/USD tends to climb, reflecting increased demand for Aussie-based assets.
- GBP/USD and EUR/GBP: When GBP/USD rises, EUR/GBP often falls, as money shifts between the British pound and the euro. Watching how these two pairs interact can confirm pound-specific trends. This helps you gauge the relative strength of the UK economy versus the Eurozone.
(Never Trade In Uncertainty Again – Join The WR Trading Mentorship)
Examples of Currency Pair Correlations
Seeing correlations in action helps you understand how pairs interact in the real world. Below are a few practical examples illustrating how currency pairs often move together or against one another and how traders might use this knowledge.
- GBP/JPY and Risk Sentiment: Often called the “carry pair,” GBP/JPY can reflect global investors’ attitudes toward risk. When markets feel confident, and stocks rise, traders tend to move from safe-haven currencies like the Japanese yen into the British pound. Recognizing this correlation means if you see global stock markets rally, you might expect GBP/JPY to trend higher.
- EUR/AUD and Commodity Flows: If commodities, especially metals and minerals, see increased demand, Australia’s export-driven economy often benefits, strengthening the AUD against the euro. When you notice Europe struggling economically while commodity markets heat up, EUR/AUD may move lower. Keeping tabs on global commodity demand can help you anticipate shifts in this pair.
- USD/NOK and Oil Prices: Norway’s economy heavily depends on oil exports, making the Norwegian krone sensitive to changes in oil prices. Once oil prices rise, USD/NOK often moves downward since investors need fewer U.S. dollars to buy Norwegian currency. If you’re tracking oil closely, you can use its movements as an early indicator of potential shifts in USD/NOK.
- CHF/JPY and “Safe Haven” Movements: Both the Swiss franc and the Japanese yen are considered safe-haven currencies. During periods of global uncertainty, CHF/JPY can become less volatile because both currencies strengthen against riskier pairs. Recognizing that this pair’s movements may be relatively muted during market turbulence can guide traders seeking stability.
- EUR/SEK and European Economic Conditions: Sweden’s close economic ties with the Eurozone mean the Swedish krona often moves in response to European data. When the Eurozone faces economic hardships, the EUR/SEK pair can rise as the euro struggles less than the krona, or vice versa if Sweden’s economy outperforms.
Do Forex Correlations Exist Together With Commodities?
Yes, certain currencies are influenced by commodity markets because their home countries rely heavily on natural resources. As commodity prices change, these currencies can move in predictable ways, creating measurable correlations. Recognizing these links can give another layer of understanding, which can help guide trading decisions.
Expanding your analysis to include commodity-related insights allows you to see beyond simple currency pair movements. Understanding how a nation’s resource exports impact its currency provides a clearer sense of market drivers.
This broader perspective can improve your confidence, timing, and overall approach when trading the forex market.
Conclusion: Forex Correlations Can Be Used as Advantages
Learning forex correlations creates a clearer, more complete view of the market, helping you make smarter, more timely decisions in Forex Trading. Understanding how these different currency pairs relate enhances risk management and reveals new trading opportunities. We’ve covered several popular correlations for you to analyze, including those between EUR/USD and GBP/USD.
Moreover, if you’re ready to learn more and take your forex knowledge to the next level, consider checking out the mentorship and resources at WR Trading. A well-structured learning program can guide you through the complexities and help you develop a better trading approach.
(Never Trade In Uncertainty Again – Join The WR Trading Mentorship)
Frequently Asked Questions on Forex Correlations
What Exactly Are Forex Correlations?
Forex correlations measure how two currency pairs move in relation to each other. They provide a way to see if pairs tend to move together or in opposite directions. Understanding these relationships can guide you toward more informed trading decisions.
How Can I Quickly Identify Forex Correlations?
Most traders use online correlation tables, free tools, or built-in platform features to see how pairs relate. These resources give you a correlation coefficient for easy interpretation. Having these tools at hand simplifies the process and saves time.
Why Do Forex Correlations Change Over Time?
Market conditions, economic events, and shifts in investor sentiment all influence correlations. As these factors change, the relationships between currency pairs can strengthen, weaken, or even reverse.
Can Beginners Benefit From Studying Forex Correlations?
Absolutely, beginners can gain valuable insights by exploring how pairs connect. Even a basic understanding of correlations can improve risk management and highlight new trading opportunities.
Do I Need Advanced Math Skills to Understand Correlations?
No, you don’t need advanced math skills because many tools handle the calculations for you. What matters is interpreting the correlation coefficient and understanding its implications. Relying on user-friendly tools keeps the process accessible for all traders.