Candlestick patterns are specific chart formations used in technical analysis to interpret price action and identify trading opportunities in the candlestick chart. Originating from Japanese rice traders, these patterns consist of individual or multiple candles, each showing the open, high, low, and close prices within a given trading period. Traders rely on these visual signals to forecast market sentiment, anticipate price movements, and effectively position themselves in trades.
Patterns are classified as bullish or bearish, depending on the type of signal they provide. Bullish patterns indicate that buying pressure may strengthen, whereas bearish patterns suggest increasing selling pressure and price declines. Understanding candlestick patterns allows traders to accurately forecast future price movements, enhance their decision-making processes, and improve trading performance.

This Candlestick Pattern Top List will show you the most powerful 50 Candlestick Formations in detail with examples and how to trade them, explained for beginners:
(Learn To Trade And Read Candlestick Patterns Like A Pro)
1. Hammer
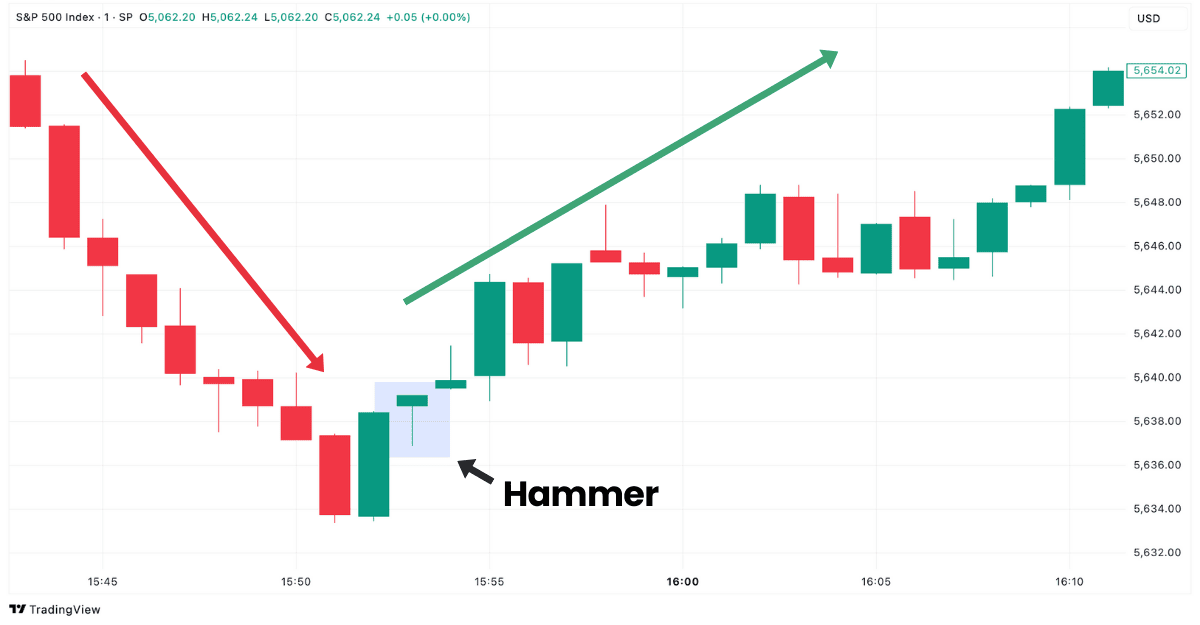
The hammer is a bullish reversal pattern that appears at the bottom of a downtrend. It indicates that sellers initially drove the price lower, but strong buying pressure later pushed it back up, closing near the opening price.

A hammer has a small real body near the top of the candle and a long lower wick that is at least twice the size of the body. The upper wick is either very small or nonexistent.
This pattern signals a potential trend reversal, but confirmation is required. Traders look for the next candle to close above the hammer’s high to validate the reversal. The hammer pattern is more reliable when it forms after a prolonged downtrend at key support levels and when accompanied by higher trading volume.
Key Tips For The Hammer Candlestick Pattern
- Indicates a rejection of lower prices, showing buyers stepping in.
- Often signals a potential trend reversal but requires confirmation.
- A hammer with a higher close is stronger than one with a lower close.
- Works best when trading volume is high.
- Can appear in any timeframe but is most significant on daily and higher time frames
| Section | Details |
|---|---|
| Construction | First Candle: A bearish candle preceding the hammer, often large-bodied. Second Candle: A bullish confirmation candle that closes above the hammer’s high. |
| Forecast | A bullish reversal is likely if confirmed by a strong green candle closing above the hammer’s high. |
| Type of Pattern | Single-candle bullish reversal pattern. |
| Trend Prior to the Pattern | Forms after a downtrend, signaling a possible upward reversal. |
| Opposite Pattern | Inverted Hammer |
| Stop-Loss Placement | Below the low of the hammer’s wick to allow for price fluctuations while maintaining a favorable risk-to-reward ratio. |
| Candlestick Success Rate In Accuracity: | 55 – 72% |
How Set Up a Trade with The Hammer Candlestick Pattern:
- Identify a hammer pattern at the bottom of a downtrend.
- Wait for confirmation with the next candle closing above the hammer’s high.
- Enter a buy trade at the close of the confirmation candle.
- Place a stop-loss below the hammer’s wick for protection.
- Set a take-profit target based on the next resistance level.
2. Shooting Star
The shooting star is a bearish reversal pattern that appears at the top of an uptrend. It signals that buyers attempted to push the price higher, but strong selling pressure drove it back down, resulting in a close near the opening price.

The candle has a small real body at the lower end of the range and a long upper wick at least twice the size of the body, with little to no lower wick. This pattern suggests that bullish momentum is weakening, and a potential reversal to the downside may occur.
However, confirmation is needed with the next candle closing below the low of the shooting star. Its reliability increases when it forms at key resistance levels and with high trading volume.

Key Tips For The Shooting Star Candlestick Pattern
- Indicates a rejection of higher prices and loss of bullish momentum.
- More powerful when the upper wick is significantly longer than the body.
- A gap up before the formation strengthens the bearish signal.
- Works best when found near resistance levels or after a strong uptrend.
- Can be used with RSI or other momentum indicators to confirm overbought conditions.
| Section | Details |
|---|---|
| Construction | First Candle: A bullish candle preceding the shooting star, often large-bodied. Second Candle: A bearish confirmation candle that closes below the shooting star’s low. |
| Forecast | A bearish reversal is likely if confirmed by a strong red candle closing below the shooting star’s low. |
| Type of Pattern | Single-candle bearish reversal pattern. |
| Trend Prior to the Pattern | Forms after an uptrend, signaling a possible downward reversal. |
| Opposite Pattern | Inverted Hammer |
| Stop-Loss Placement | Above the high of the shooting star’s wick to allow for price fluctuations while maintaining a favorable risk-to-reward ratio. |
| Candlestick Success Rate In Accuracity: | 54 – 71% |
How Set Up a Trade with The Shooting Star Candlestick Pattern:
- Identify a shooting star pattern at the top of an uptrend.
- Wait for confirmation with the next candle closing below the shooting star’s low.
- Enter a sell trade at the close of the confirmation candle.
- Place a stop-loss above the shooting star’s wick for protection.
- Set a take-profit target based on the next support level.
(Learn To Trade And Read Candlestick Patterns Like A Pro)
3. Bullish Engulfing
The engulfing pattern is a two-candle bullish reversal formation that appears at the bottom of a downtrend. It consists of a small bearish candle followed by a larger bullish candle that completely engulfs the previous candle’s body. This signals a shift in momentum, as buyers have overwhelmed sellers, pushing the price higher.

To find strong confirmation, look for the next candle to close above the bullish engulfing candle’s high. This pattern is most effective when it forms at key support levels after a prolonged downtrend and when there is high trading volume.

Key Tips For The Bullish Engulfing Candlestick Pattern
- Signals a shift in control from sellers to buyers.
- The larger the second candle relative to the first, the stronger the pattern.
- Volume should increase on the engulfing candle for higher reliability.
- Works best at key support levels or after an extended downtrend.
- An engulfing pattern that engulfs multiple candles is even stronger.
| Section | Details |
|---|---|
| Construction | First Candle: A small bearish candle forming in a downtrend. Second Candle: A larger bullish candle that engulfs the first candle’s real body. |
| Forecast | A bullish reversal is likely if confirmed by a strong green candle closing above the bullish engulfing pattern. |
| Type of Pattern | Two-candle bullish reversal pattern. |
| Trend Prior to the Pattern | Forms after a downtrend, signaling a possible upward reversal. |
| Opposite Pattern | Bearish Engulfing |
| Stop-Loss Placement | Below the low of the bullish engulfing candle to minimize risk. |
| Candlestick Success Rate In Accuracity: | 63% – 67% |
How Set Up a Trade with The Engulfing Candlestick Pattern:
- Identify a bullish engulfing pattern at the bottom of a downtrend.
- Wait for confirmation with the next candle closing above the bullish engulfing candle’s high.
- Enter a buy trade at the close of the confirmation candle.
- Place a stop-loss below the low of the bullish engulfing candle.
- Set a take-profit target based on the next resistance level.
4. Morning Star
The morning star is a three-candle bullish reversal pattern that appears at the bottom of a downtrend. It consists of a large bearish candle, followed by a small-bodied candle (which can be bullish, bearish, or a doji), and finally, a strong bullish candle that closes well above the midpoint of the first candle. This formation signals that selling pressure has weakened, and buyers are beginning to regain control.

Traders consider the morning star a strong reversal pattern when it forms at key support levels or after an extended downtrend. Higher volume on the third candle strengthens its reliability. Confirmation comes when the next candle continues upward, closing above the third candle’s high.

Key Tips For The Morning Star Candlestick Pattern
- Works best when the third candle has high volume and a strong close.
- A longer third candle increases the reliability of the pattern.
- More effective when found at major support zones or Fibonacci levels.
- May fail if the third candle does not close above the midpoint of the first candle.
- Can be combined with RSI or MACD to confirm oversold conditions.
| Section | Details |
|---|---|
| Construction | First Candle: A large bearish candle continuing the existing downtrend. Second Candle: A small-bodied candle that represents indecision (can be bullish, bearish, or a doji). Third Candle: A strong bullish candle closing above the midpoint of the first candle. |
| Forecast | A bullish reversal is likely if confirmed by a strong green candle continuing higher. |
| Type of Pattern | Three-candle bullish reversal pattern. |
| Trend Prior to the Pattern | Appears at the bottom of a downtrend, indicating a potential upward reversal. |
| Opposite Pattern | Evening Star |
| Stop-Loss Placement | Below the low of the second candle (indecision candle) to allow for price fluctuations while protecting risk. |
| Candlestick Success Rate In Accuracity: | 52-75% |
How Set Up a Trade with The Morning Star Candlestick Pattern:
- Identify a morning star pattern at the bottom of a downtrend.
- Wait for confirmation with the next candle closing above the morning star’s high.
- Enter a buy trade at the close of the confirmation candle.
- Place a stop-loss below the lowest point of the pattern (second or first candle).
- Set a take-profit target at the next resistance level.
5. Evening Star
The evening star is a three-candle bearish reversal pattern that forms at the top of an uptrend. It consists of a large bullish candle, followed by a small-bodied candle (which can be bullish, bearish, or a doji), and finally a strong bearish candle that closes well below the midpoint of the first candle. This pattern signals that buying momentum has weakened, and sellers are taking control.

The evening star pattern is considered highly reliable, especially when it forms near strong resistance levels. Its effectiveness is enhanced when the third candle has a high trading volume. Confirmation occurs when the next candle continues downward, closing below the third candle’s low.

Key Tips For The Evening Star Candlestick Pattern
- Appears at the top of an uptrend, signaling a potential bearish reversal.
- A sharp drop on the third candle increases confidence in the reversal.
- Works best near key resistance areas or after a strong bullish run.
- A version with a doji as the second candle (Evening Doji Star) is even stronger.
- Can be combined with RSI to confirm overbought conditions before a reversal.
| Section | Details |
|---|---|
| Construction | First Candle: A large bullish candle continuing the existing uptrend. Second Candle: A small-bodied candle (often indecision or a doji) showing a pause. Third Candle: A strong bearish candle closing below the midpoint of the first candle. |
| Forecast | A bearish reversal is likely if confirmed by a strong red candle following through downward. |
| Type of Pattern | Three-candle bearish reversal pattern. |
| Trend Prior to the Pattern | Forms at the top of an uptrend, signaling a potential downward reversal. |
| Opposite Pattern | Morning Star |
| Stop-Loss Placement | Above the high of the indecision (second) candle or the evening star’s high. |
| Candlestick Success Rate In Accuracity: | 55-68% |
How Set Up a Trade with The Evening Star Candlestick Pattern:
- Identify an evening star pattern at the top of an uptrend.
- Wait for confirmation with the next candle closing below the evening star’s low.
- Enter a sell trade at the close of the confirmation candle.
- Place a stop-loss above the highest point of the pattern (second or first candle).
- Set a take-profit target at the next support level.
(Learn To Trade And Read Candlestick Patterns Like A Pro)
6. Harami
The harami is a two-candle reversal pattern that can be either bullish or bearish, depending on the trend in which it forms. The pattern consists of a large first candle, followed by a second, smaller candle that is completely contained within the body of the first candle. This structure suggests a weakening of momentum and potential reversal.
A bullish harami appears at the bottom of a downtrend, where the first candle is bearish, and the second is a small bullish candle inside its range. This indicates that selling pressure is fading, and a possible reversal to the upside may follow.

A bearish harami forms at the top of an uptrend, where the first candle is bullish, and the second is a small bearish candle, showing weakening buying pressure and a potential reversal downward.

Key Tips For The Harami Candlestick Pattern
- Harami means “pregnant” in Japanese, as the smaller second candle is “inside” the first.
- Indicates hesitation in the prevailing trend, often leading to a reversal.
- The second candle must be entirely contained within the first candle’s real body.
- Works best when found at key support (bullish) or resistance (bearish) levels.
- High trading volume on the confirmation candle increases its reliability.


| Section | Details |
|---|---|
| Construction | First Candle: A strong bullish or bearish candle (depending on the trend). Second Candle: A small-bodied candle completely inside the first candle’s range. |
| Forecast | A reversal is likely if confirmed by the next candle closing beyond the second candle’s range. |
| Type of Pattern | Two-candle reversal pattern. |
| Trend Prior to the Pattern | A bullish harami appears in a downtrend, while a bearish harami appears in an uptrend. |
| Opposite Pattern | The opposite of a bullish harami is a bearish harami, and vice versa. |
| Stop-Loss Placement | Below the low of the second candle for a bullish harami, and above the high of the second candle for a bearish harami. |
| Candlestick Success Rate In Accuracity: | 53-76% |
How Set Up a Trade with The Harami Candlestick Pattern:
- Identify a bullish harami at the bottom of a downtrend or a bearish harami at the top of an uptrend.
- Wait for confirmation with the next candle closing above (for bullish) or below (for bearish) the harami pattern.
- Enter a buy trade (for bullish harami) or sell trade (for bearish harami) at the close of the confirmation candle.
- Place a stop-loss below the second candle’s low (bullish) or above its high (bearish).
- Set a take-profit target at the next resistance (bullish) or support (bearish).
7. Hanging Man
The hanging man is a bearish reversal pattern that appears at the top of an uptrend. It looks identical to the hammer but occurs in an entirely different context. The candle has a small real body near the top and a long lower wick that is at least twice the size of the body, with little to no upper wick.

It indicates that buyers pushed prices higher, but strong selling pressure later drove them lower before the price managed to close near its opening level. While the hanging man suggests a potential trend reversal, confirmation is required.
Traders look for the next candle to close below the hanging man’s low, signaling that sellers have gained control. This pattern is more reliable when it appears at a strong resistance level and is accompanied by high trading volume.

Key Tips For The Hanging Man Candlestick Pattern
- A warning sign of a potential bearish reversal in an uptrend.
- A long lower wick signals that sellers stepped in aggressively.
- Works best when it appears near key resistance levels.
- The longer the lower wick, the stronger the pattern.
- Often found at the end of extended uptrends, especially after a parabolic move.
| Section | Details |
|---|---|
| Construction | Single Candle: A strong bullish candle before the hanging man. |
| Forecast | A bearish reversal is implied, but confirmation is required with the next candle closing below the hanging man’s low. |
| Type of Pattern | Single-candle bearish reversal pattern. |
| Trend Prior to the Pattern | Appears at the top of an uptrend, warning of a potential bearish reversal. |
| Opposite Pattern | Bullish Hammer |
| Stop-Loss Placement | Above the high of the hanging man’s wick (to allow price fluctuations while managing risk). |
| Candlestick Success Rate In Accuracity: | 37,2 – 86% |
How Set Up a Trade with The Hanging Man Candlestick Pattern:
- Identify a hanging man at the top of an uptrend.
- Wait for confirmation with the next candle closing below the hanging man’s low.
- Enter a sell trade at the close of the confirmation candle.
- Place a stop-loss above the high of the hanging man.
- Set a take-profit target based on the next support level.
8. Doji
A doji is a single-candle pattern representing market indecision. It forms when the opening and closing prices are nearly identical, resulting in a very small or nonexistent real body. The upper and lower wicks vary in length, which creates different types of doji patterns.

Doji candles can appear in uptrends and downtrends and may signal either a continuation or reversal depending on the context. Traders wait for the next candle to determine the direction. The different types of doji include:
- Standard Doji: Has a small or nonexistent body with upper and lower wicks of similar length.
- Long-Legged Doji: Features extended upper and lower wicks, showing strong indecision.
- Dragonfly Doji: Has a long lower wick with little to no upper wick, signaling potential bullish reversal.
- Gravestone Doji: Has a long upper wick with little to no lower wick, indicating potential bearish reversal.
- Four-Price Doji: A rare pattern where open, high, low, and close are nearly the same, reflecting extreme indecision.

Key Tips For The Doji Candlestick Pattern
- A sign of market indecision, appearing in both uptrends and downtrends.
- The type of doji determines whether the market is slightly bullish or bearish.
- Works best when appearing at key support or resistance levels.
- More reliable when confirmed by the following candle’s direction.
- When a doji forms within a range, it usually indicates continued consolidation.
| Section | Details |
|---|---|
| Construction | Single Candle: The open and close prices are nearly identical, with varying wick lengths. |
| Forecast | Indecision/neutral – no strong directional signal on its own. Price direction will depend on subsequent candles. |
| Type of Pattern | Single-candle indecision/neutral pattern. |
| Trend Prior to the Pattern | Can appear in any trend, often signaling a possible pause or reversal if confirmed by other patterns. |
| Opposite Pattern | N/A |
| Stop-Loss Placement | N/A (by itself, the doji doesn’t provide a specific entry; risk management depends on context and confirmation). |
| Candlestick Success Rate In Accuracity: | Approx. 50% – 60% |
How Set Up a Trade with The Doji Candlestick Pattern:
- Identify a doji pattern and consider the surrounding trend and support/resistance levels.
- Wait for confirmation – bullish confirmation for a dragonfly doji, bearish confirmation for a gravestone doji.
- Enter a trade in the direction of the confirming candle.
- Place a stop-loss beyond the doji’s wick for protection.
- Set a take-profit target based on the next support or resistance level.
9. Pin Bar
The pin bar is a single-candle pattern that signals a potential price reversal. It has a small real body and a long wick (shadow) extending from one side, resembling a “pin.” The long wick indicates a strong rejection of price in that direction, with the market closing near the opposite end.

A bullish pin bar has a long lower wick and appears at the bottom of a downtrend, suggesting a reversal to the upside. A bearish pin bar has a long upper wick and forms at the top of an uptrend, indicating a reversal to the downside. Pin bars are most effective when they form at key support or resistance levels and when supported by other indicators such as moving averages or Fibonacci retracement levels.

Key Tips For The Pin Bar Candlestick Pattern
- The long wick represents strong rejection of price in that direction.
- A bullish pin bar has a long lower wick, while a bearish pin bar has a long upper wick.
- Confirmation comes when the next candle moves in the pin bar’s expected direction.
- A pin bar that aligns with a larger trend is more effective than one against it.
- Can be combined with moving averages or trendlines for additional confirmation.
| Section | Details |
|---|---|
| Construction | Single Candle: Small real body with a long wick extending from one side. |
| Forecast | Signals a price rejection and potential trend reversal if confirmed by the next candle. |
| Type of Pattern | Single-candle reversal pattern. |
| Trend Prior to the Pattern | A bullish pin bar appears in a downtrend, while a bearish pin bar appears in an uptrend. |
| Opposite Pattern | Inverted pin bar (bullish vs. bearish). |
| Stop-Loss Placement | Below the low of a bullish pin bar or above the high of a bearish pin bar. |
| Candlestick Success Rate In Accuracity: | 60% |
How Set Up a Trade with The Pin Bar Candlestick Pattern:
- Identify a pin bar at a key support (bullish) or resistance (bearish) level.
- Wait for confirmation with the next candle moving in the expected direction.
- Enter a buy trade (bullish pin bar) or sell trade (bearish pin bar) at the close of the confirmation candle.
- Place a stop-loss below the wick of a bullish pin bar or above the wick of a bearish pin bar.
- Set a take-profit target at the next resistance (bullish) or support (bearish) level.
(Learn To Trade And Read Candlestick Patterns Like A Pro)
10. Bullish Mat Hold
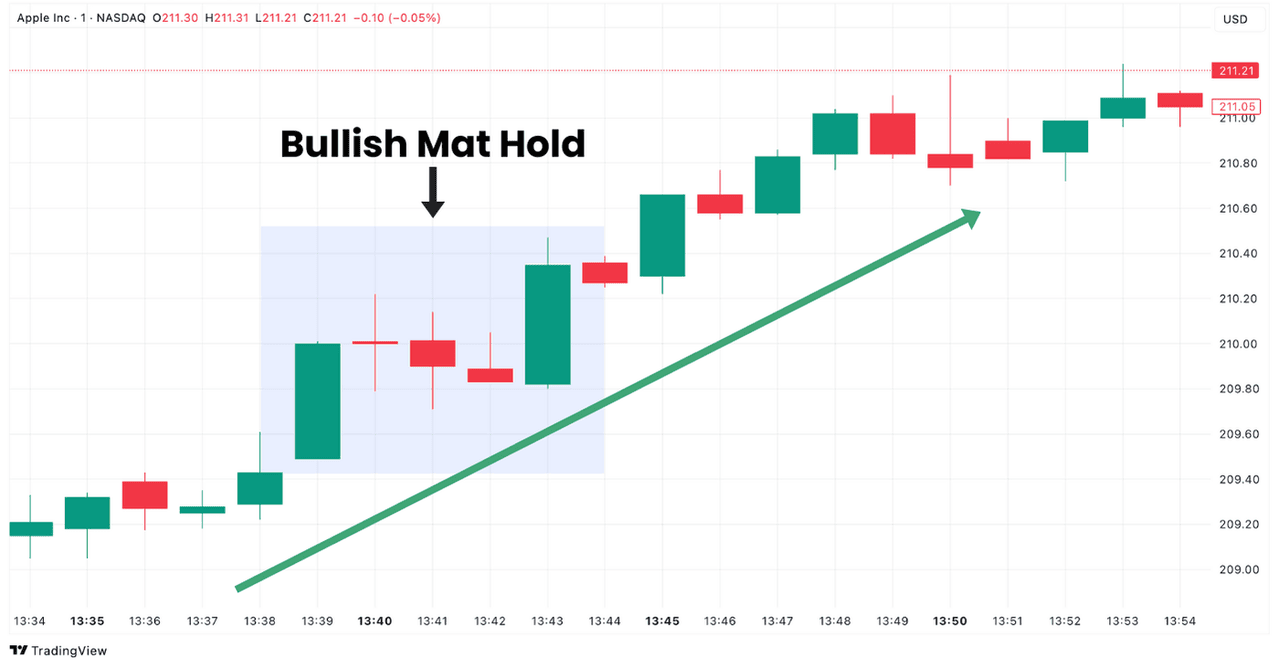
The mat hold is a bullish continuation pattern that appears during an uptrend. It consists of a strong bullish candle, followed by a series of smaller bearish or neutral candles that remain within the range of the first candle. The final candle in the pattern is another strong bullish candle that breaks above the consolidation, confirming the continuation of the uptrend.

This pattern indicates that the market took a brief pause, but buyers remained in control. It is considered a stronger continuation signal than similar patterns because the bearish candles do not retrace too deeply into the first bullish candle’s range.
Key Tips For The Bullish Mat Hold Candlestick Pattern
- A bullish continuation pattern seen in an uptrend.
- Works best when forming after a strong trend move.
- A high-volume breakout candle increases the reliability of the pattern.
- More effective when combined with moving averages or trendlines.
- If the final candle fails to break out, the pattern may lose significance.
| Section | Details |
|---|---|
| Construction | Candle 1: A long bullish candle. Candles 2–4: Smaller bearish or neutral candles within the first candle’s range. Candle 5: A strong bullish candle that breaks above the consolidation. |
| Forecast | The uptrend is expected to continue after the breakout. |
| Type of Pattern | Multi-candle bullish continuation pattern. |
| Trend Prior to the Pattern | Seen in an uptrend, indicating a brief pause before further bullish momentum. |
| Opposite Pattern | Falling Three Methods |
| Stop-Loss Placement | Below the lowest point of the consolidation phase. |
| Candlestick Success Rate In Accuracity: | 67% – 78% |
How Set Up a Trade with The Mat Hold Candlestick Pattern:
- Identify the mat hold pattern in an uptrend.
- Wait for confirmation with the final breakout candle closing above the consolidation.
- Enter a buy trade at the close of the breakout candle.
- Place a stop-loss below the lowest point of the consolidation.
- Set a take-profit target at the next resistance level.
11. Gap Up / Gap Down
The gap up and gap down patterns occur when a security opens significantly higher or lower than the previous day’s close without any trading in between. A gap up suggests strong buying interest, while a gap down indicates heavy selling pressure. These gaps can act as continuation signals if the trend follows through or reversal signals if the price fails to sustain the gap direction.

A breakaway gap happens at the beginning of a new trend, a runaway gap occurs during an existing trend, and an exhaustion gap appears near the end of a trend. The type of gap provides insight into the potential future price movement.

Key Tips For The Gap Up / Gap Down Candlestick Pattern
- A gap up occurs when the opening price is significantly higher than the previous close.
- A gap down occurs when the opening price is significantly lower than the previous close.
- Gaps can signal strong momentum in the market.
- Works best when supported by volume and follow-through price action.
- A filled gap weakens the pattern’s strength.
| Section | Details |
|---|---|
| Construction | First Candle: The last trading session’s close price. Gap Formation: A noticeable price gap on the open of the next session. Second Candle: The price action that follows the gap, confirming or rejecting the move. |
| Forecast | A sustained gap suggests a continuation, while a filled gap may signal a reversal. |
| Type of Pattern | Single-day momentum pattern. |
| Trend Prior to the Pattern | Can occur in any trend but is more significant after a strong move. |
| Opposite Pattern | Opposite gaps (gap up vs. gap down). |
| Stop-Loss Placement | Below the gap (for a gap up) or above the gap (for a gap down). |
| Candlestick Success Rate In Accuracity: | N/A |
How Set Up a Trade with The Gap Up / Gap Down Candlestick Pattern:
- Identify a significant gap at market open.
- Determine if the gap is a breakaway, runaway, or exhaustion gap.
- Enter a trade in the gap’s direction if momentum continues.
- Place a stop-loss below the gap (for gap up) or above the gap (for gap down).
- Set a take-profit target based on the next support/resistance level.
12. Tri Star
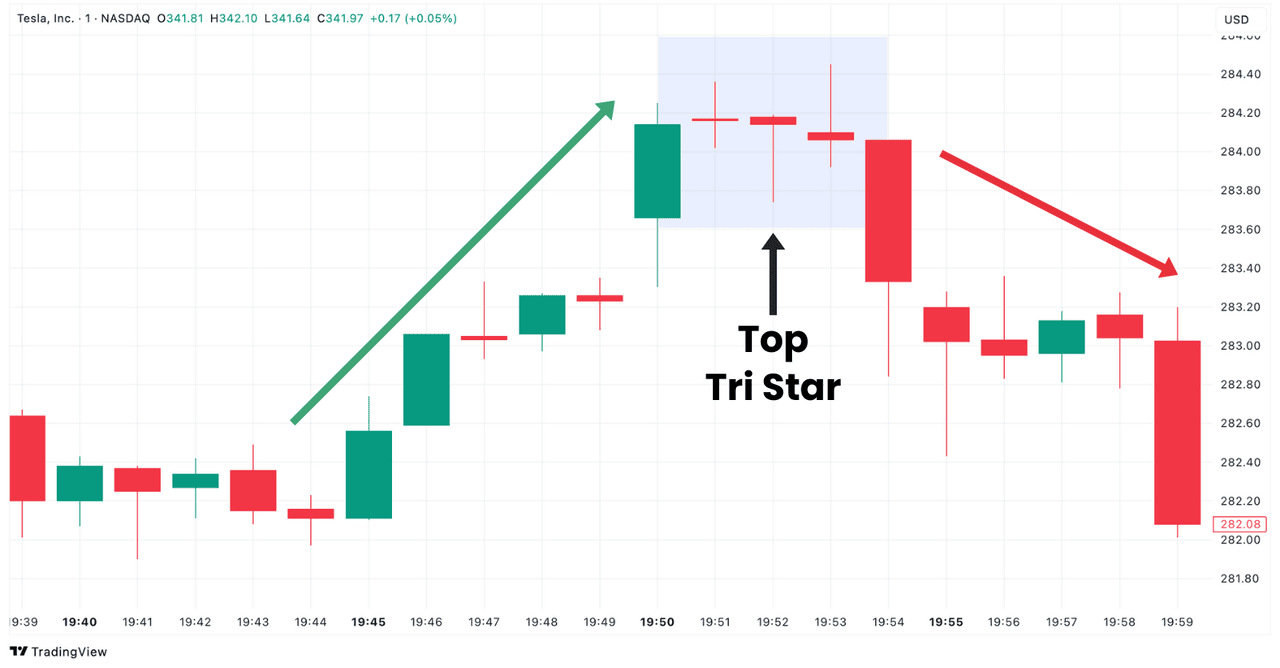
The tri star is a rare three-candle reversal pattern that consists of three consecutive doji candles. This pattern indicates extreme market indecision and is usually found at the top or bottom of a trend, signaling a potential reversal.

A bullish tri star occurs after a downtrend, while a bearish tri star appears after an uptrend. Since doji candles represent equilibrium between buyers and sellers, three in a row suggest the market is struggling to continue in the current trend. Confirmation is needed with a strong move in the opposite direction following the pattern.
Key Tips For The Tri Star Candlestick Pattern
- A three-doji pattern shows a potential trend reversal.
- Indicates extreme market indecision.
- Works best when forming after a prolonged trend.
- Requires confirmation with a strong move in the opposite direction.
- A failed tri star can result in trend continuation instead of reversal.
| Section | Details |
|---|---|
| Construction | Candle 1: A doji appearing in a trending market. Candle 2: Another doji, confirming hesitation in the trend. Candle 3: A third doji, signaling a potential reversal setup. |
| Forecast | A reversal is expected if followed by a strong move in the opposite direction. |
| Type of Pattern | Three-candle reversal pattern. |
| Trend Prior to the Pattern | A bullish tri star appears in a downtrend, while a bearish tri star appears in an uptrend. |
| Opposite Pattern | A continuation pattern like three white soldiers (bullish) or three black crows (bearish). |
| Stop-Loss Placement | Below the low of the third doji (for bullish) or above the high of the third doji (for bearish). |
| Candlestick Success Rate In Accuracity: | 62% |
How Set Up a Trade with The Tri Star Candlestick Pattern:
- Identify a tri star pattern at the top or bottom of a trend.
- Wait for confirmation with a strong move in the opposite direction.
- Enter a buy trade (for bullish tri star) or sell trade (for bearish tri star) at the close of the confirmation candle.
- Place a stop-loss below the lowest doji (for bullish) or above the highest doji (for bearish).
- Set a take-profit target based on the next support/resistance level.
(Learn To Trade And Read Candlestick Patterns Like A Pro)
13. Tweezer Top / Bottom
The tweezer top and tweezer bottom are two-candle reversal patterns that indicate a potential change in trend direction. A tweezer top forms at the peak of an uptrend and consists of two consecutive candles with similar highs, signaling that buyers are struggling to push the price higher. A tweezer bottom appears at the bottom of a downtrend and consists of two consecutive candles with nearly identical lows, suggesting that selling pressure is weakening.

These patterns work best when appearing at key support or resistance levels. The reliability increases when the second candle in the pattern is significantly larger than the first, showing strong rejection of higher (tweezer top) or lower (tweezer bottom) prices.

Key Tips For The Tweezer Top / Bottom Candlestick Pattern
- The pattern is stronger when the second candle is significantly larger.
- High volume on the second candle increases its reliability.
- A tweezer top with a bearish engulfing candle is a stronger sell signal.
- A tweezer bottom with a bullish engulfing candle strengthens the reversal signal.
- Often used alongside RSI or MACD to confirm overbought/oversold conditions.
| Section | Details |
|---|---|
| Construction | Candle 1: A bullish candle (for tweezer top) or bearish candle (for tweezer bottom). Candle 2: A bearish candle with the same high as Candle 1 (for tweezer top) or a bullish candle with the same low as Candle 1 (for tweezer bottom). |
| Forecast | A reversal is expected if confirmed by a strong move in the opposite direction. |
| Type of Pattern | Two-candle reversal pattern. |
| Trend Prior to the Pattern | A tweezer top appears in an uptrend, while a tweezer bottom appears in a downtrend. |
| Opposite Pattern | Tweezer top is opposite to tweezer bottom. |
| Stop-Loss Placement | Above the high (tweezer top) or below the low (tweezer bottom) of the pattern. |
| Candlestick Success Rate In Accuracity: | 53 – 65% |
How Set Up a Trade with The Tweezer Top / Bottom Candlestick Pattern:
- Identify a tweezer top or tweezer bottom at key resistance or support levels.
- Wait for confirmation with a strong move in the expected direction.
- Enter a sell trade for a tweezer top or a buy trade for a tweezer bottom at the close of the confirmation candle.
- Place a stop-loss above the tweezer top high or below the tweezer bottom low.
- Set a take-profit target at the next support (for short trades) or resistance (for long trades).
14. Belt Hold
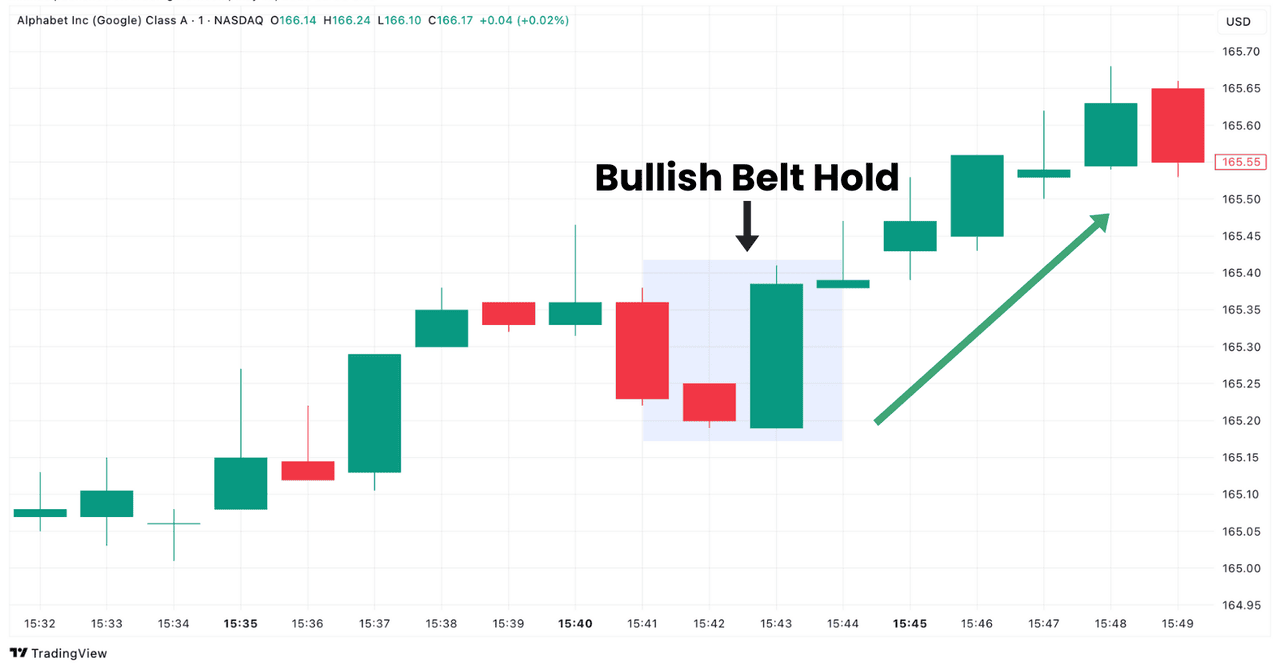
The belt hold is a single-candle reversal pattern that can be bullish or bearish, depending on its location in the trend. A bullish belt hold occurs after a downtrend and is represented by a long bullish candle with little to no lower wick, showing strong buying pressure from the open. A bearish belt hold appears after an uptrend and has a long bearish candle with little to no upper wick, signaling aggressive selling pressure from the open.

This pattern is most reliable when appearing at strong support (bullish) or resistance (bearish) levels. The absence of a wick on the opening side suggests a decisive shift in momentum.
Key Tips For The Belt Hold Candlestick Pattern
- Works best when appearing at key support (bullish) or resistance (bearish) zones.
- More reliable when accompanied by high trading volume.
- The absence of a wick on the opening side suggests strong momentum.
- Confirmation is needed with a follow-through candle in the expected direction.
- Can be used with moving averages to confirm trend reversals.
| Section | Details |
|---|---|
| Construction | Single Candle: A long real body with little to no wick on the opening side. |
| Forecast | A reversal is expected if confirmed by the next candle moving in the pattern’s direction. |
| Type of Pattern | Single-candle reversal pattern. |
| Trend Prior to the Pattern | A bullish belt hold appears in a downtrend, while a bearish belt hold appears in an uptrend. |
| Opposite Pattern | A bullish belt hold is opposite to a bearish belt hold. |
| Stop-Loss Placement | Below the low of a bullish belt hold or above the high of a bearish belt hold. |
| Candlestick Success Rate In Accuracity: | 50% – 71% |
How Set Up a Trade with The Belt Hold Candlestick Pattern:
- Identify a bullish or bearish belt hold at a key support or resistance level.
- Wait for confirmation with a follow-through candle closing in the expected direction.
- Enter a buy trade (bullish belt hold) or sell trade (bearish belt hold) at the close of the confirmation candle.
- Place a stop-loss below the belt hold’s low (bullish) or above its high (bearish).
- Set a take-profit target at the next resistance (bullish) or support (bearish) level.
15. Abandoned Baby
The abandoned baby is a three-candle reversal pattern that signals a strong shift in market sentiment. It consists of a large candle in the direction of the trend, followed by a doji that gaps away from the previous candle, and then a strong candle moving in the opposite direction. This pattern is rare but highly reliable when it appears at key turning points.

A bullish abandoned baby appears at the end of a downtrend, while a bearish abandoned baby forms at the end of an uptrend. The gap between the doji and the surrounding candles is what makes this pattern unique.

Key Tips For The Abandoned Baby Candlestick Pattern
- A rare and highly reliable reversal pattern.
- The doji must gap away from the first and third candles.
- Works best when found at strong support (bullish) or resistance (bearish) zones.
- The larger the third candle, the stronger the reversal signal.
- High volume on the third candle increases the pattern’s reliability.
| Section | Details |
|---|---|
| Construction | Candle 1: A strong bullish or bearish candle continuing the trend. Candle 2: A doji that gaps away from the first candle. Candle 3: A strong candle in the opposite direction, confirming the reversal. |
| Forecast | A strong reversal is expected if the third candle confirms the move. |
| Type of Pattern | Three-candle reversal pattern. |
| Trend Prior to the Pattern | A bullish abandoned baby appears in a downtrend, while a bearish abandoned baby appears in an uptrend. |
| Opposite Pattern | Bullish abandoned baby is the opposite of a bearish abandoned baby. |
| Stop-Loss Placement | Below the low of a bullish abandoned baby or above the high of a bearish abandoned baby. |
| Candlestick Success Rate In Accuracity: | 60% – 70% for bullish abandoned baby |
How Set Up a Trade with The Abandoned Baby Candlestick Pattern:
- Identify an abandoned baby pattern at a key reversal zone.
- Wait for confirmation with a strong third candle moving in the opposite direction.
- Enter a buy trade (bullish abandoned baby) or sell trade (bearish abandoned baby) at the close of the third candle.
- Place a stop-loss below the abandoned baby’s low (bullish) or above its high (bearish).
- Set a take-profit target at the next resistance (bullish) or support (bearish) level.
(Learn To Trade And Read Candlestick Patterns Like A Pro)
16. Kicker
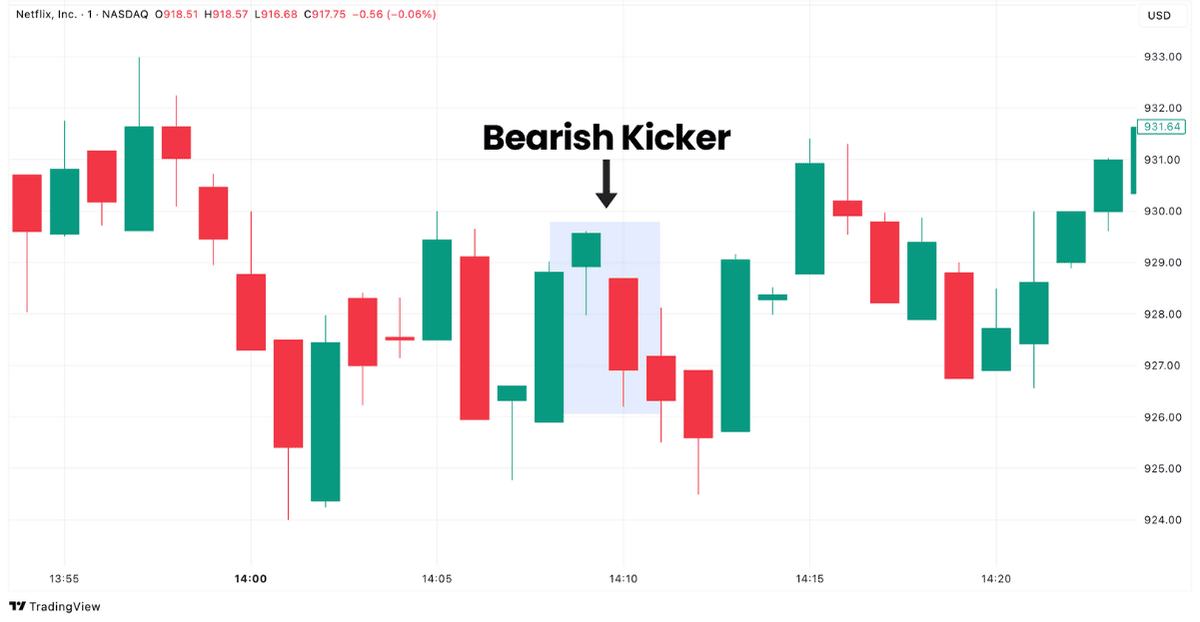
The kicker pattern is a strong reversal formation that signals an abrupt shift in market sentiment. It consists of two large candles moving in opposite directions, with the second candle opening at or above/below the first candle’s open, forming a significant price gap. The pattern shows that a major shift in buying or selling pressure has occurred, often due to news or major market events.

A bullish kicker occurs when a strong bearish candle is followed by a bullish candle that gaps up and moves higher, showing that buyers have completely overpowered sellers. A bearish kicker is the opposite – after a strong bullish candle, the next session gaps down and moves lower, indicating heavy selling pressure.
Key Tips For The Kicker Candlestick Pattern
- One of the strongest reversal patterns due to its significant price gap.
- Indicates an immediate shift in sentiment, often due to external catalysts.
- More reliable with a high trading volume on the second candle.
- The gap between the two candles should remain unfilled for the strongest signal.
- The size of the second candle determines the strength of the reversal.
| Section | Details |
|---|---|
| Construction | Candle 1: A strong bearish or bullish candle. Candle 2: A large opposite-direction candle that gaps above or below the first candle’s open. |
| Forecast | A sharp trend reversal is expected if the gap remains unfilled. |
| Type of Pattern | Two-candle strong reversal pattern. |
| Trend Prior to the Pattern | Forms in both uptrends and downtrends, signaling a major momentum shift. |
| Opposite Pattern | A bullish kicker is the opposite of a bearish kicker. |
| Stop-Loss Placement | Below the second candle’s low (for bullish) or above its high (for bearish). |
| Candlestick Success Rate In Accuracity: | 60-70% |
How Set Up a Trade with The Kicker Candlestick Pattern:
- Identify a kicker pattern with a significant price gap.
- Wait for confirmation that the gap remains unfilled.
- Enter a buy trade (bullish kicker) or sell trade (bearish kicker) at the close of the second candle.
- Place a stop-loss below the second candle’s low (bullish) or above its high (bearish).
- Set a take-profit target at the next support/resistance level.
17. Three Outside Up / Down
The three outside up and three outside down patterns are three-candle reversal formations that build upon the engulfing pattern concept. A three outside up is a bullish reversal that begins with a bearish candle, followed by a bullish engulfing candle, and is confirmed by another bullish candle closing above the second.

A three outside down is the bearish counterpart, starting with a bullish candle, followed by a bearish engulfing candle, and a third bearish candle confirming the downward trend.

This pattern confirms a momentum shift by not only engulfing the previous candle but also following through with an additional confirmation candle, making it stronger than a standard engulfing pattern.
Key Tips For The Three Outside Up / Down Candlestick Pattern
- An extended confirmation of the engulfing pattern with a third candle continuing the move.
- The second candle must engulf the first candle’s body completely.
- The third candle must close in the same direction as the second for confirmation.
- High volume on the second and third candles strengthens the signal.
- The stronger the second and third candles, the more reliable the pattern.
| Section | Details |
|---|---|
| Construction | Candle 1: A small bearish candle (for three outside up) or a small bullish candle (for three outside down). Candle 2: A large engulfing candle in the opposite direction, fully covering Candle 1’s body. Candle 3: Another candle in the direction of Candle 2, confirming the new trend. |
| Forecast | A confirmed reversal is expected if the third candle continues the momentum. |
| Type of Pattern | Three-candle reversal pattern. |
| Trend Prior to the Pattern | Three outside up appears after a downtrend, while three outside down appears after an uptrend. |
| Opposite Pattern | Three outside up is opposite to three outside down. |
| Stop-Loss Placement | Below the second candle’s low (bullish) or above its high (bearish). |
| Candlestick Success Rate In Accuracity: | 67% – 70% |
How Set Up a Trade with The Three Outside Up / Down Candlestick Pattern:
- Identify a three outside up or three outside down pattern at a key level.
- Wait for confirmation with a third candle closing in the expected direction.
- Enter a buy trade (three outside up) or sell trade (three outside down) at the close of the third candle.
- Place a stop-loss below the second candle’s low (bullish) or above its high (bearish).
- Set a take-profit target at the next support/resistance level.
18. Three Inside Up / Down
The three inside up and three inside down patterns are multi-candle reversal formations that build upon the harami pattern. A three inside up is a bullish reversal where the first candle is bearish, the second is a smaller bullish candle within the first candle’s range, and the third is another bullish candle that closes above the first candle’s high.


A three inside down is the bearish counterpart, with a bullish first candle, a smaller bearish candle within its range, and a third bearish candle closing below the first candle’s low. This pattern is an improvement on the harami because it includes a third confirming candle, making it more reliable.


Key Tips For The Three Inside Up / Down Candlestick Pattern
- Extends the harami pattern by adding a third candle for confirmation.
- The second candle must be completely contained within the first candle’s body.
- The third candle must close beyond the first candle’s range for confirmation.
- High volume on the third candle increases the reliability of the pattern.
- More effective when used alongside trendlines or moving averages.
| Section | Details |
|---|---|
| Construction | Candle 1: A strong bearish candle (for three inside up) or a strong bullish candle (for three inside down). Candle 2: A smaller opposite-direction candle inside the first candle’s body. Candle 3: A candle that closes beyond the first candle’s range, confirming the reversal. |
| Forecast | A confirmed reversal is expected if the third candle continues the trend shift. |
| Type of Pattern | Three-candle reversal pattern. |
| Trend Prior to the Pattern | Three inside up appears after a downtrend, while three inside down appears after an uptrend. |
| Opposite Pattern | Three inside up is opposite to three inside down. |
| Stop-Loss Placement | Below the second candle’s low (bullish) or above its high (bearish). |
| Candlestick Success Rate In Accuracity: | 60% – 70% |
How Set Up a Trade with The Three Inside Up / Down Candlestick Pattern:
- Identify a three inside up or three inside down pattern at a key level.
- Wait for confirmation with a third candle closing in the expected direction.
- Enter a buy trade (three inside up) or sell trade (three inside down) at the close of the third candle.
- Place a stop-loss below the second candle’s low (bullish) or above its high (bearish).
- Set a take-profit target at the next support/resistance level.
(Learn To Trade And Read Candlestick Patterns Like A Pro)
19. Piercing Line
The piercing line is a bullish reversal pattern that appears at the bottom of a downtrend. It consists of a strong bearish candle followed by a bullish candle that opens below the previous low but then closes above the midpoint of the first candle’s body. This pattern suggests that selling pressure is fading and buyers are stepping in to drive prices higher.

Traders look for high volume on the second candle and follow-up bullish movement in the next few sessions for better confirmation. The piercing line works best at key support levels or after extended downward movements.

Key Tips For The Piercing Line Candlestick Pattern
- A bullish reversal signal that suggests buyers are stepping in after an extended decline.
- The second candle’s close above the midpoint of the first candle confirms bullish intent.
- Stronger when the second candle opens with a downward gap before rallying.
- A deeper close into the first candle’s body increases the pattern’s reliability.
- More effective when it forms at major support zones or Fibonacci retracement levels.
| Section | Details |
|---|---|
| Construction | Candle 1: A strong bearish candle continuing the downtrend. Candle 2: A bullish candle that opens below the previous low but closes above the midpoint of Candle 1. |
| Forecast | A potential bullish reversal, confirmed by follow-through buying in subsequent candles. |
| Type of Pattern | Two-candle bullish reversal pattern. |
| Trend Prior to the Pattern | Forms after a downtrend, signaling a possible shift to bullish momentum. |
| Opposite Pattern | Dark Cloud Cover. |
| Stop-Loss Placement | Below the low of the second candle for risk protection. |
| Candlestick Success Rate In Accuracity: | 64% |
How Set Up a Trade with The Piercing Line Candlestick Pattern:
- Identify a piercing line pattern forming after a downtrend.
- Wait for confirmation with the next candle closing higher.
- Enter a buy trade at the close of the confirmation candle.
- Place a stop-loss below the low of the second candle.
- Set a take-profit target at the next resistance level.
20. Dark Cloud Cover
The dark cloud cover is a bearish reversal pattern that appears at the top of an uptrend. It consists of a strong bullish candle followed by a bearish candle that opens above the previous high but then closes below the midpoint of the first candle’s body. This pattern signals a shift in momentum, as buyers initially push the price higher, but strong selling pressure forces it to close significantly lower.

The dark cloud cover is more effective when it forms at a key resistance level and is confirmed by further bearish movement in the following candles. Higher trading volume on the second candle strengthens the signal.

Key Tips For The Dark Cloud Cover Candlestick Pattern
- A bearish reversal signal indicates fading bullish momentum at the peak of an uptrend.
- Works best when appearing near resistance zones, trendlines, or psychological price levels.
- More effective when combined with RSI, MACD, or other overbought indicators.
- High volume on the second candle increases the probability of a strong selloff.
- If the second candle does not close below the midpoint of the first, the pattern weakens.
| Section | Details |
|---|---|
| Construction | Candle 1: A strong bullish candle forming in an uptrend. Candle 2: A bearish candle that opens above the first candle’s high but closes below its midpoint. |
| Forecast | A bearish reversal is likely if confirmed by continued selling pressure. |
| Type of Pattern | Two-candle bearish reversal pattern. |
| Trend Prior to the Pattern | Forms after an uptrend, signaling a potential shift downward. |
| Opposite Pattern | Piercing Line. |
| Stop-Loss Placement | Above the high of the second candle to protect against false signals. |
| Candlestick Success Rate | 60% |
How Set Up a Trade with The Dark Cloud Cover Candlestick Pattern:
- Identify a dark cloud cover pattern forming at a resistance level.
- Wait for confirmation with another bearish candle closing lower.
- Enter a sell trade at the close of the confirmation candle.
- Place a stop-loss above the high of the second candle.
- Set a take-profit target at the next support level.
21. Three Black Crows
The three black crows is a bearish reversal pattern that appears at the top of an uptrend. It consists of three consecutive long-bodied bearish candles, each opening within the previous candle’s body and closing near its low.

This pattern indicates a shift in momentum from bullish to bearish, with sellers taking control. For better confirmation, the candles should have small or no wicks, as this signifies strong selling pressure. The pattern is more effective when it appears near a resistance level or after a period of overbought conditions. If the pattern forms on high volume, it further confirms the bearish sentiment.

Key Tips For The Three Black Crows Candlestick Pattern
- Requires three consecutive bearish candles with minimal wicks.
- The second and third candles must open within the previous candle’s body.
- Stronger when forming near resistance zones or after overbought conditions.
- More effective when there is high trading volume on all three candles.
- A failed three black crows pattern can result in a continuation of the uptrend.
| Section | Details |
|---|---|
| Construction | Candle 1: A strong bearish candle marking the beginning of selling pressure. Candle 2: Another bearish candle opening within the first candle’s body and closing lower. Candle 3: A third bearish candle continuing the same pattern, confirming the downward trend. |
| Forecast | A strong continuation of the downtrend is expected if the pattern forms with high volume. |
| Type of Pattern | Three-candle bearish reversal pattern. |
| Trend Prior to the Pattern | Forms after an uptrend, signaling a shift to bearish momentum. |
| Opposite Pattern | Three White Soldiers. |
| Stop-Loss Placement | Above the high of the first candle to protect against a false signal. |
| Candlestick Success Rate In Accuracity: | 72 – 78% |
How Set Up a Trade with The Three Black Crows Candlestick Pattern:
- Identify the three black crows pattern forming after an uptrend.
- Wait for confirmation with continued bearish movement on the next candle.
- Enter a sell trade at the close of the third bearish candle.
- Place a stop-loss above the high of the first candle in the pattern.
- Set a take-profit target at the next support level.
22. Rising Three Methods
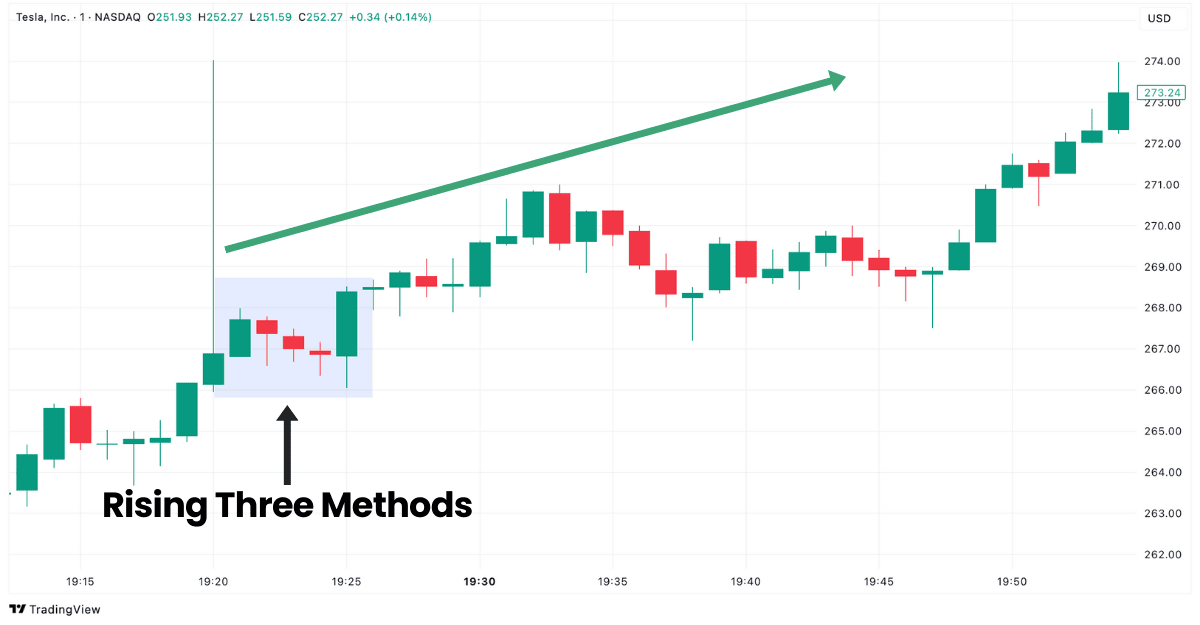
The rising three methods is a bullish continuation pattern that occurs during an uptrend. It consists of a strong bullish candle, followed by three or more small bearish candles that remain within the first candle’s range, and a final strong bullish candle that closes above the first candle’s high.

This pattern signals a brief consolidation before the prevailing uptrend resumes. The key aspect of spotting is that the small bearish candles should not break below the first candle’s low, confirming that selling pressure is weak.
Key Tips For The Rising Three Methods Candlestick Pattern
- The first and last candles must be strong bullish candles.
- The middle candles should be small bearish or neutral candles staying within the first candle’s range.
- The breakout candle should have high volume for stronger confirmation.
- Works best when forming near trendlines or moving averages.
- A longer breakout candle increases the pattern’s reliability.
| Section | Details |
|---|---|
| Construction | Candle 1: A strong bullish candle initiating the pattern. Candles 2-4: Three or more small bearish candles within the first candle’s range. Candle 5: A strong bullish candle closing above the highest point of the first candle. |
| Forecast | The uptrend is expected to continue after the breakout. |
| Type of Pattern | Multi-candle bullish continuation pattern. |
| Trend Prior to the Pattern | Forms during an uptrend, signaling further bullish momentum. |
| Opposite Pattern | Falling Three Methods. |
| Stop-Loss Placement | Below the lowest point of the consolidation phase. |
| Candlestick Success Rate In Accuracity: | 74% |
How Set Up a Trade with The Rising Three Candlestick Pattern:
- Identify a rising three methods pattern forming in an uptrend.
- Wait for confirmation with the final breakout candle closing above the consolidation.
- Enter a buy trade at the close of the breakout candle.
- Place a stop-loss below the lowest point of the consolidation.
- Set a take-profit target at the next resistance level.
23. Falling Three Methods
The falling three methods is a bearish continuation pattern that appears during a downtrend. It consists of a strong bearish candle, followed by three or more small bullish candles that remain within the first candle’s range, and a final strong bearish candle that closes below the first candle’s low.

This pattern shows that the market is temporarily pausing, but the overall downtrend remains intact. The small bullish candles must stay within the range of the first candle, confirming weak buying pressure.

Key Tips For The Falling Three Methods Candlestick Pattern
- The first and last candles must be strong bearish candles.
- The middle candles should be small bullish or neutral candles staying within the first candle’s range.
- The breakout candle should have high volume for stronger confirmation.
- More reliable when forming near resistance levels or trendlines.
- A longer breakdown candle increases the pattern’s reliability.
| Section | Details |
|---|---|
| Construction | Candle 1: A strong bearish candle initiating the pattern. Candles 2-4: Three or more small bullish candles within the first candle’s range. Candle 5: A strong bearish candle closing below the lowest point of the first candle. |
| Forecast | The downtrend is expected to continue after the breakdown. |
| Type of Pattern | Multi-candle bearish continuation pattern. |
| Trend Prior to the Pattern | Forms during a downtrend, signaling further bearish momentum. |
| Opposite Pattern | Rising Three Methods. |
| Stop-Loss Placement | Above the highest point of the consolidation phase. |
| Candlestick Success Rate In Accuracity: | 71 -75% |
How Set Up a Trade with The Falling Three Candlestick Pattern:
- Identify a falling three methods pattern forming in a downtrend.
- Wait for confirmation with the final breakdown candle closing below the consolidation.
- Enter a sell trade at the close of the breakdown candle.
- Place a stop-loss above the highest point of the consolidation.
- Set a take-profit target at the next support level.
(Learn To Trade And Read Candlestick Patterns Like A Pro)
24. Tasuki Gap
The Tasuki gap is a continuation pattern that appears during strong trends, either bullish or bearish. It consists of three candles: a trend-following candle, a gap in the direction of the trend, and a pullback candle that partially fills the gap but does not close it completely.

A bullish Tasuki gap forms in an uptrend when a second bullish candle gaps up from the first, followed by a small bearish candle that retraces but does not close the gap. A bearish Tasuki gap occurs in a downtrend, where the second bearish candle gaps down, followed by a small bullish candle that partially retraces but fails to close the gap.

Key Tips For The Tasuki Gap Candlestick Pattern
- A continuation pattern that signals brief consolidation before the trend resumes.
- The gap must remain unfilled for the pattern to stay valid.
- The third candle should be small and not close beyond the gap.
- Stronger when confirmed by increasing volume during the trend phase.
- If the third candle completely fills the gap, the pattern weakens.
| Section | Details |
|---|---|
| Construction | Candle 1: A trend-following bullish or bearish candle. Candle 2: Another candle in the same direction that gaps away from Candle 1. Candle 3: A pullback candle that partially retraces but does not close the gap. |
| Forecast | The prevailing trend is expected to continue if the gap remains unfilled. |
| Type of Pattern | Three-candle continuation pattern. |
| Trend Prior to the Pattern | A bullish Tasuki gap appears in an uptrend, while a bearish Tasuki gap appears in a downtrend. |
| Opposite Pattern | Bullish Tasuki Gap is opposite to Bearish Tasuki Gap. |
| Stop-Loss Placement | Below the gap (for bullish) or above the gap (for bearish). |
| Candlestick Success Rate In Accuracity: | 57 – 67% |
How Set Up a Trade with The Tasuki Gap Candlestick Pattern:
- Identify a Tasuki gap forming in an existing trend.
- Wait for confirmation that the gap remains unfilled.
- Enter a buy trade (bullish Tasuki gap) or sell trade (bearish Tasuki gap) at the close of the third candle.
- Place a stop-loss below the gap (bullish) or above the gap (bearish).
- Set a take-profit target at the next key support/resistance level.
25. Inside Bar
The inside bar is a two-candle pattern where the second candle is completely contained within the range of the first candle. It represents market consolidation and is often a sign of trend continuation or reversal, depending on the breakout direction.

A bullish inside bar happens in an uptrend and shows continued bullish momentum if the price breaks above the pattern. A bearish inside bar forms in a downtrend and signals continued selling pressure if the price breaks below the pattern.

Key Tips For The Inside Bar Candlestick Pattern
- A two-candle pattern showing market consolidation.
- The second candle must be fully within the first candle’s high and low.
- A breakout beyond the inside bar’s range confirms the pattern’s direction.
- Works best in trending markets rather than choppy conditions.
- A smaller second candle increases the likelihood of a strong breakout.
| Section | Details |
|---|---|
| Construction | Candle 1: A large bullish or bearish candle. Candle 2: A smaller candle completely inside the range of Candle 1. |
| Forecast | A breakout is expected; direction depends on whether the price moves above or below the inside bar’s range. |
| Type of Pattern | Two-candle consolidation pattern. |
| Trend Prior to the Pattern | Can form in both uptrends and downtrends, signaling continuation or reversal. |
| Opposite Pattern | Outside Bar. |
| Stop-Loss Placement | Below the low (for bullish breakout) or above the high (for bearish breakout) of the inside bar. |
| Candlestick Success Rate In Accuracity: | 50 – 65% |
How Set Up a Trade with The Inside Bar Candlestick Pattern:
- Identify an inside bar pattern forming in a trending market.
- Wait for confirmation with a breakout above or below the inside bar’s range.
- Enter a buy trade if price breaks above or a sell trade if price breaks below.
- Place a stop-loss below the low (bullish) or above the high (bearish) of the inside bar.
- Set a take-profit target at the next resistance (bullish) or support (bearish) level.
26. Outside Bar
The outside bar is a two-candle pattern where the second candle completely engulfs the range of the first candle. This pattern shows increased volatility and is often a sign of a trend reversal or continuation, depending on the breakout direction.
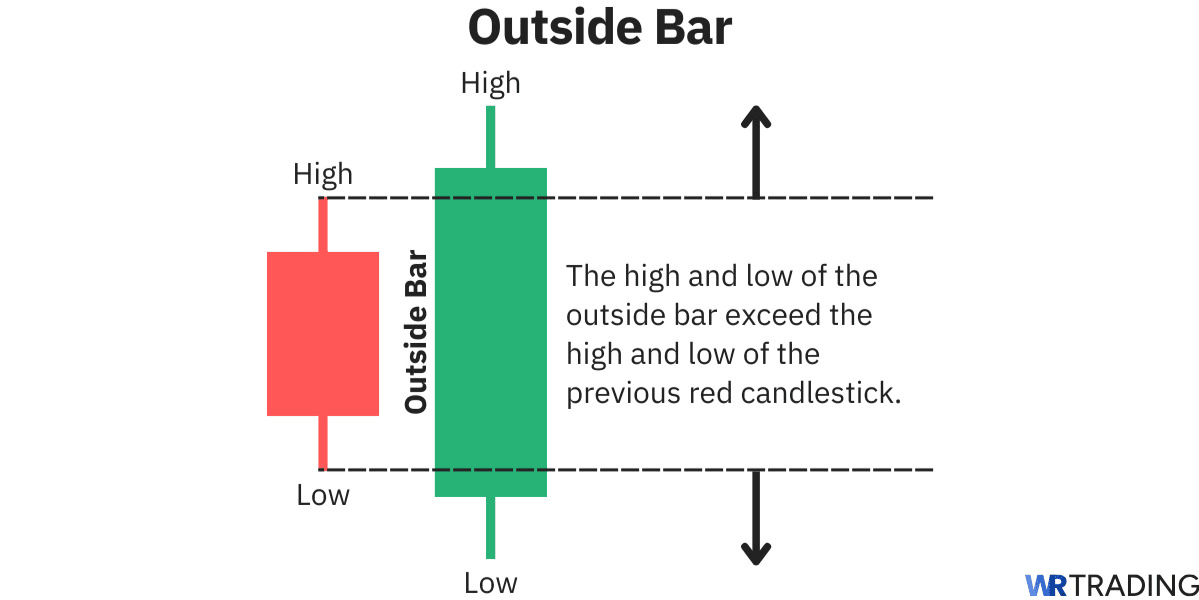
A bullish outside bar forms when the second candle surpasses both the high and low of the previous candle, closing with strong upward momentum. This suggests that buyers have taken control after initial market uncertainty.
However, a bearish outside bar develops when the second candle extends beyond the first but finishes lower, signaling that sellers have overpowered buyers and momentum has shifted downward.

Key Tips For The Outside Bar Candlestick Pattern
- A strong volatility-based pattern indicating increased market activity.
- The second candle must fully engulf the first candle’s high and low.
- A breakout candle following the pattern increases reliability.
- The larger the second candle, the stronger the signal.
- High volume on the engulfing candle confirms the market sentiment shift.
| Section | Details |
|---|---|
| Construction | Candle 1: A small or moderate-sized bullish or bearish candle. Candle 2: A large candle that engulfs the entire range of Candle 1. |
| Forecast | A breakout move is expected; the direction depends on the closing price of the second candle. |
| Type of Pattern | Two-candle volatility pattern. |
| Trend Prior to the Pattern | Can form in both uptrends and downtrends, signaling continuation or reversal. |
| Opposite Pattern | Inside Bar |
| Stop-Loss Placement | Below the low (for bullish breakout) or above the high (for bearish breakout) of the outside bar. |
| Candlestick Success Rate In Accuracity: | 50 – 65% |
How Set Up a Trade with The Outside Bar Candlestick Pattern:
- Identify an outside bar pattern forming in a trending market.
- Wait for confirmation with a breakout above or below the outside bar’s range.
- Enter a buy trade if the price breaks above or a sell trade if the price breaks below.
- Place a stop-loss below the low (bullish) or above the high (bearish) of the outside bar.
- Set a take-profit target at the next resistance (bullish) or support (bearish) level.
27. Spinning Top
The spinning top is a single-candle pattern that signals market indecision. It has a small real body positioned in the middle of the candle’s range, with long upper and lower wicks. This structure indicates that buyers and sellers actively pushed prices in both directions during the session, but neither side could maintain control, leading to a close near the opening price.

When a spinning top appears after a strong price move, it suggests the trend could be losing momentum. However, it does not confirm a reversal on its own – traders look for follow-up price action to determine whether the trend will continue or reverse. If the next candle confirms direction with a strong close, it provides a clearer trading signal.

Key Tips For The Spinning Top Candlestick Pattern
- A neutral pattern that signals market hesitation and potential reversal.
- The real body is small, while the upper and lower wicks are long.
- More significant when appearing after a strong uptrend or downtrend.
- Confirmation from the next candle is required to confirm direction.
- Works best when combined with support, resistance, or volume analysis.
| Section | Details |
|---|---|
| Construction | Single Candle: Small real body in the middle, with long upper and lower wicks. |
| Forecast | A potential reversal if followed by a strong move in the opposite direction. |
| Type of Pattern | Single-candle neutral pattern. |
| Trend Prior to the Pattern | Can appear in any trend, with significance increasing after strong moves. |
| Opposite Pattern | Marubozu. |
| Stop-Loss Placement | Below the low (for bullish confirmation) or above the high (for bearish confirmation). |
| Candlestick Success Rate In Accuracity: | 53 – 55% |
How Set Up a Trade with The Spinning Top Candlestick Pattern:
- Identify a spinning top pattern forming after a trend.
- Wait for confirmation with a strong bullish or bearish candle.
- Enter a buy trade if a bullish candle follows or a sell trade if a bearish candle follows.
- Place a stop-loss below the low (bullish) or above the high (bearish) of the spinning top.
- Set a take-profit target at the next key support/resistance level.
(Learn To Trade And Read Candlestick Patterns Like A Pro)
28. Popgun
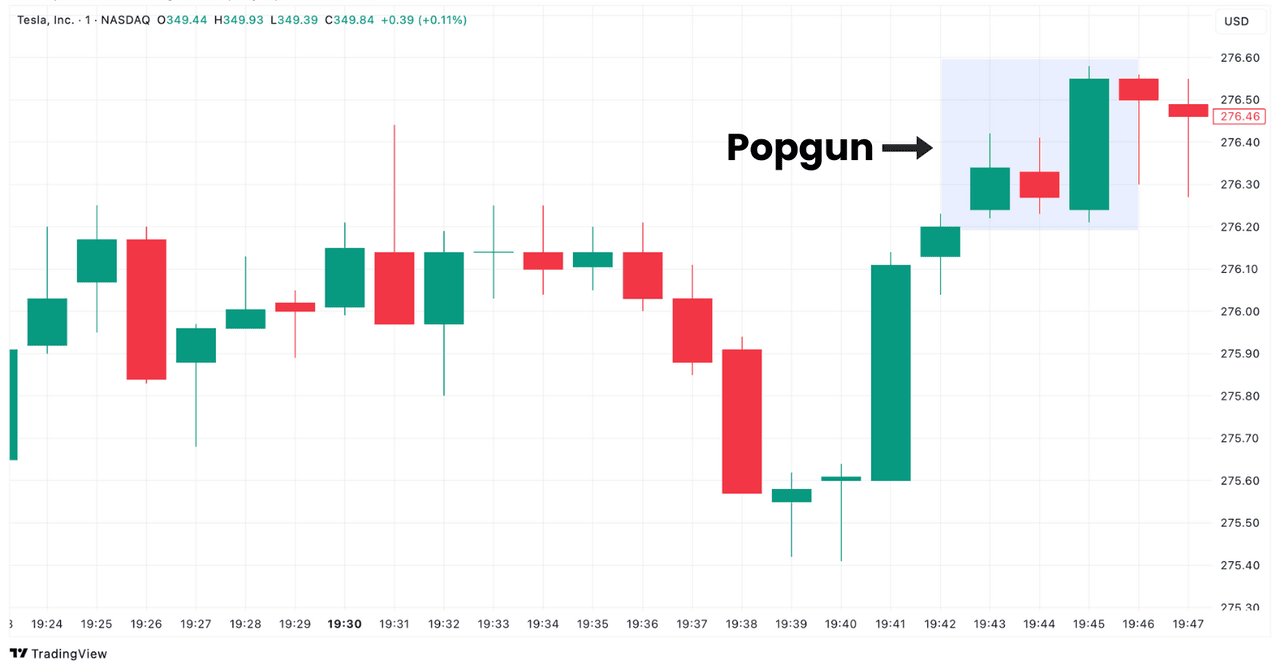
The popgun pattern is a two-candle breakout setup that signals an imminent surge in price movement. It starts with an inside bar, a candle that is fully contained within the range of the previous candle.

This shows consolidation, where traders are indecisive, and price is contracting. The second candle, known as the outside bar, fully engulfs the range of both previous candles, signaling an explosion in momentum.
Unlike other breakout patterns, the popgun combines compression and expansion, making it a strong signal for an impending directional move. Wait for the breakout direction, as the outside bar can lead to a continuation of the trend or a sharp reversal.
Key Tips For The Popgun Candlestick Pattern
- A volatility-based breakout pattern showing a sudden price surge.
- Starts with an inside bar, followed by an outside bar engulfing the range.
- More reliable when forming at key support or resistance levels.
- Breakout direction determines whether the trade is bullish or bearish.
- High volume on the outside bar confirms the breakout.
| Section | Details |
|---|---|
| Construction | Candle 1: A large bullish or bearish candle. Candle 2: An inside bar, fully contained within the first candle’s range. Candle 3: A large outside bar engulfing both previous candles. |
| Forecast | A strong breakout in the direction of the third candle. |
| Type of Pattern | Three-candle breakout pattern. |
| Trend Prior to the Pattern | Can form in uptrends, downtrends, or ranging markets before a breakout. |
| Opposite Pattern | No direct opposite. |
| Stop-Loss Placement | Below the low (for bullish breakout) or above the high (for bearish breakout). |
| Candlestick Success Rate In Accuracity: | 53% – 63% |
How Set Up a Trade with The Popgun Candlestick Pattern:
- Identify a popgun pattern forming at a key market structure level.
- Wait for confirmation with a breakout candle following the popgun.
- Enter a buy trade if the third candle is bullish or a sell trade if bearish.
- Place a stop-loss below the low (bullish) or above the high (bearish) of the popgun.
- Set a take-profit target based on the next support or resistance level.
29. Shaven Head
The shaven head is a momentum candle that reflects one-sided control in the market. Its defining characteristic is the lack of an upper wick, meaning the price opened at a lower level and moved consistently higher throughout the session before closing at its peak. This shows that buyers dominated price action from start to finish without encountering significant resistance.

Because of its structure, the shaven head is seen as a sign of strong trend continuation. It is strong when it appears after a breakout or near a key support/resistance level. The absence of an upper wick suggests buyers were confident enough to sustain momentum until the close, increasing the probability of further price appreciation.

Key Tips For The Shaven Head Candlestick Pattern
- A strong momentum candle showing one-sided market control.
- The absence of an upper wick means buyers dominated the session.
- Often appears during strong trends, confirming continuation.
- More reliable when supported by high trading volume.
- If followed by a weak candle, the trend may stall or reverse.
| Section | Details |
|---|---|
| Construction | Single Candle: No upper wick, real body extending to the high. |
| Forecast | A continuation of the trend if confirmed by the next few candles. |
| Type of Pattern | Single-candle trend continuation pattern. |
| Trend Prior to the Pattern | A bullish shaven head appears in an uptrend, while a bearish shaven head appears in a downtrend. |
| Opposite Pattern | Shaven Bottom. |
| Stop-Loss Placement | Below the low (for bullish) or above the high (for bearish). |
| Candlestick Success Rate In Accuracity: | 53 – 63% |
How Set Up a Trade with The Shaven Head Candlestick Pattern:
- Identify a shaven head pattern in an existing trend.
- Wait for confirmation with continued movement in the same direction.
- Enter a buy trade for a bullish shaven head or a sell trade for a bearish shaven head.
- Place a stop-loss below the low (bullish) or above the high (bearish) of the shaven head candle.
- Set a take-profit target at the next resistance (bullish) or support (bearish) level.
30. Shaven Bottom
The shaven bottom is a single-candle momentum pattern that signals strong selling or buying pressure. It has no lower wick, meaning the price opened and remained in control of one side throughout the session before closing at the extreme end. This structure indicates that sellers (in a bearish trend) or buyers (in a bullish trend) showed no hesitation, pushing the price decisively in one direction.


Key Tips For The Shaven Bottom Candlestick Pattern
- A strong momentum candle showing one-sided control over price action.
- No lower wick, indicating sustained pressure from either buyers or sellers.
- More effective when appearing in an established trend.
- Works well when aligned with moving averages or breakout setups.
- More reliable when supported by high volume.
- If followed by indecision candles, the trend may slow or reverse.
| Section | Details |
|---|---|
| Construction | Single Candle: A full-bodied candle with no lower wick. |
| Forecast | The trend is expected to continue if the next candle confirms the move. |
| Type of Pattern | Single-candle trend continuation pattern. |
| Trend Prior to the Pattern | A bullish shaven bottom appears in an uptrend, while a bearish shaven bottom appears in a downtrend. |
| Opposite Pattern | Shaven Head. |
| Stop-Loss Placement | Below the low (for bullish) or above the high (for bearish). |
| Candlestick Success Rate In Accuracity: | 53 – 63% |
How Set Up a Trade with The Shaven Bottom Candlestick Pattern:
- Identify a shaven bottom pattern in a trending market.
- Wait for confirmation with continued movement in the same direction.
- Enter a buy trade for a bullish shaven bottom or a sell trade for a bearish shaven bottom.
- Place a stop-loss below the low (bullish) or above the high (bearish) of the candle.
- Set a take-profit target at the next key support or resistance level.
31. High Wave Candlestick Pattern
The high wave candlestick is a single-candle pattern that signals market uncertainty and potential reversal. It has a small real body with long upper and lower wicks, showing that the price fluctuated significantly but closed near its opening level. This pattern suggests that both buyers and sellers were active, but neither was able to establish clear control.

High wave candles often appear at key turning points after strong price movements. While they do not confirm a reversal alone, they act as early warnings of momentum exhaustion. Traders wait for a confirmation candle to determine whether a trend reversal or continuation is likely.

Key Tips For The High Wave Candlestick Pattern
- A neutral candlestick pattern that reflects market indecision.
- Indicates strong price swings in both directions.
- Often found near support or resistance zones.
- Works best when confirmed by follow-up price action.
- Frequently used with RSI or MACD to confirm overbought/oversold conditions.
| Section | Details |
|---|---|
| Construction | Single Candle: Small real body with long upper and lower wicks. |
| Forecast | A reversal is possible if the next candle confirms a change in trend. |
| Type of Pattern | Single-candle neutral pattern. |
| Trend Prior to the Pattern | Can appear in both uptrends and downtrends but is more significant after strong trends. |
| Opposite Pattern | No direct opposite. |
| Stop-Loss Placement | Below the low (for bullish confirmation) or above the high (for bearish confirmation). |
| Candlestick Success Rate In Accuracity: | 73% – 84% |
How Set Up a Trade with The High Wave Candlestick Pattern:
- Identify a high wave candle near a key price level.
- Wait for confirmation with a strong bullish or bearish candle.
- Enter a buy trade if a bullish candle follows or a sell trade if a bearish candle follows.
- Place a stop-loss below the low (bullish) or above the high (bearish) of the high wave candle.
- Set a take-profit target at the next resistance (bullish) or support (bearish) level.
(Learn To Trade And Read Candlestick Patterns Like A Pro)
32. Separating Lines
The separating lines is a two-candle continuation pattern that reinforces the prevailing trend. It consists of a strong trend candle followed by another candle of the opposite color that opens at the same level as the previous candle’s open but moves in the trend direction. This pattern suggests a brief pullback was met with immediate rejection, leading to continued movement in the dominant trend.

Key Tips For The Separating Lines Candlestick Pattern
- The second candle opens at the same level as the first but moves in the trend’s direction.
- A bullish separating lines confirms renewed buying interest.
- A bearish separating lines signals sustained selling momentum.
- More reliable when occurring near moving averages or trendlines.
- High volume on the second candle increases its strength.
| Section | Details |
|---|---|
| Construction | Candle 1: A trend-following bullish or bearish candle. Candle 2: A candle of the opposite color that opens at the same level as Candle 1’s open but moves in the trend direction. |
| Forecast | A continuation of the trend is expected if the second candle closes decisively. |
| Type of Pattern | Two-candle trend continuation pattern. |
| Trend Prior to the Pattern | A bullish separating lines appears in an uptrend, while a bearish separating lines appears in a downtrend. |
| Opposite Pattern | Bullish Separating Lines is opposite to Bearish Separating Lines. |
| Stop-Loss Placement | Below the low (for bullish continuation) or above the high (for bearish continuation). |
| Candlestick Success Rate In Accuracity: | Around 78.1% |
How Set Up a Trade with The Separating Lines Candlestick Pattern:
- Identify a separating lines pattern forming in an existing trend.
- Wait for confirmation that the second candle closes strongly in the trend direction.
- Enter a buy trade (bullish separating lines) or sell trade (bearish separating lines).
- Place a stop-loss below the low (bullish) or above the high (bearish) of the second candle.
- Set a take-profit target at the next key support/resistance level.
33. On Neck
The on neck pattern is a two-candle bearish continuation pattern that forms during a downtrend. It starts with a long bearish candle, followed by a smaller bullish candle that opens lower but closes right at or just slightly above the previous candle’s close without closing above its body midpoint. This subtle move shows a failed attempt by buyers to reverse the trend.

Since the bullish candle fails to recover any meaningful ground, the pattern suggests that sellers are still firmly in control. It’s considered more of a stalling pattern than a sharp reversal, but when confirmed by further downside movement, it reinforces the continuation of the bearish trend.

Key Tips For The On Neck Candlestick Pattern
- Most effective during strong downtrends.
- Often signals a temporary pause in selling before momentum resumes.
- High volume on the first candle strengthens the pattern.
- If the second candle closes much higher, the setup becomes invalid.
- Can be used with support zones and volume indicators for confirmation.
| Section | Details |
|---|---|
| Construction | Candle 1: A long bearish candle in a downtrend. Candle 2: A small bullish candle opening below Candle 1’s close and closing at or slightly above it. |
| Forecast | Bearish continuation is expected if followed by further downside price action. |
| Type of Pattern | Two-candle bearish continuation pattern. |
| Trend Prior to the Pattern | Forms during a downtrend. |
| Opposite Pattern | No direct opposite. |
| Stop-Loss Placement | Above the high of the second candle to limit risk. |
| Candlestick Success Rate In Accuracity: | Around 56% |
How Set Up a Trade with The On Neck Candlestick Pattern:
- Identify the on neck pattern forming in a downtrend.
- Wait for confirmation with the next candle closing below the on neck setup.
- Enter a sell trade at the close of the confirmation candle.
- Place a stop-loss above the high of the second candle.
- Set a take-profit target at the next support level.
34. In Neck
The in neck pattern is another bearish continuation signal that also forms during a downtrend. It closely resembles the on neck pattern but with a key difference: the second candle. It’s bullish and smaller, closes slightly higher than the previous candle’s close but still below its midpoint. This subtle bullish response shows weak buying interest that isn’t strong enough to shift momentum.

Traders use the in neck pattern to identify a momentary slowdown in selling before the downtrend resumes. It’s not an aggressive setup, but it’s often part of a broader sequence of bearish signals, especially when supported by volume or confirmation candles.
Key Tips For The In Neck Candlestick Pattern
- Bearish continuation pattern that shows weak buyer response.
- Stronger when forming after a steep downtrend.
- Often leads to further selling if confirmed by the next candle.
- Most effective when appearing near broken support levels.
- If the second candle closes above the midpoint, the pattern is invalidated.
| Section | Details |
|---|---|
| Construction | Candle 1: A long bearish candle. Candle 2: A small bullish candle closing slightly higher than Candle 1’s close but not above its midpoint. |
| Forecast | Bearish continuation is likely, especially with confirmation from the next session. |
| Type of Pattern | Two-candle bearish continuation pattern. |
| Trend Prior to the Pattern | Forms in a downtrend. |
| Opposite Pattern | No direct opposite. |
| Stop-Loss Placement | Above the high of the second candle. |
| Candlestick Success Rate In Accuracity: | 53% – 61% |
How Set Up a Trade with The In Neck Candlestick Pattern:
- Spot an in neck pattern during a strong downtrend.
- Wait for a confirming candle to close below the setup.
- Enter a short position at the close of the confirmation candle.
- Place a stop-loss just above the second candle’s high.
- Set a take-profit level near the next support zone or use a fixed risk-reward ratio.
35. Breakaway
The breakaway is a five-candle reversal pattern that can appear at the start of a new trend, either bullish or bearish. It begins with a strong candle in the direction of the existing trend, followed by three progressively smaller candles that move against it and ends with a large candle that closes beyond the range of the prior candles, marking a potential breakout in the opposite direction.

A bullish breakaway starts with a long bearish candle, followed by three small upward-moving candles, and finishes with a strong bullish candle that closes above the first candle’s open. A bearish breakaway pattern has the opposite structure. This pattern shows a slow loss of momentum and then a sudden shift in control, often signaling a true reversal.
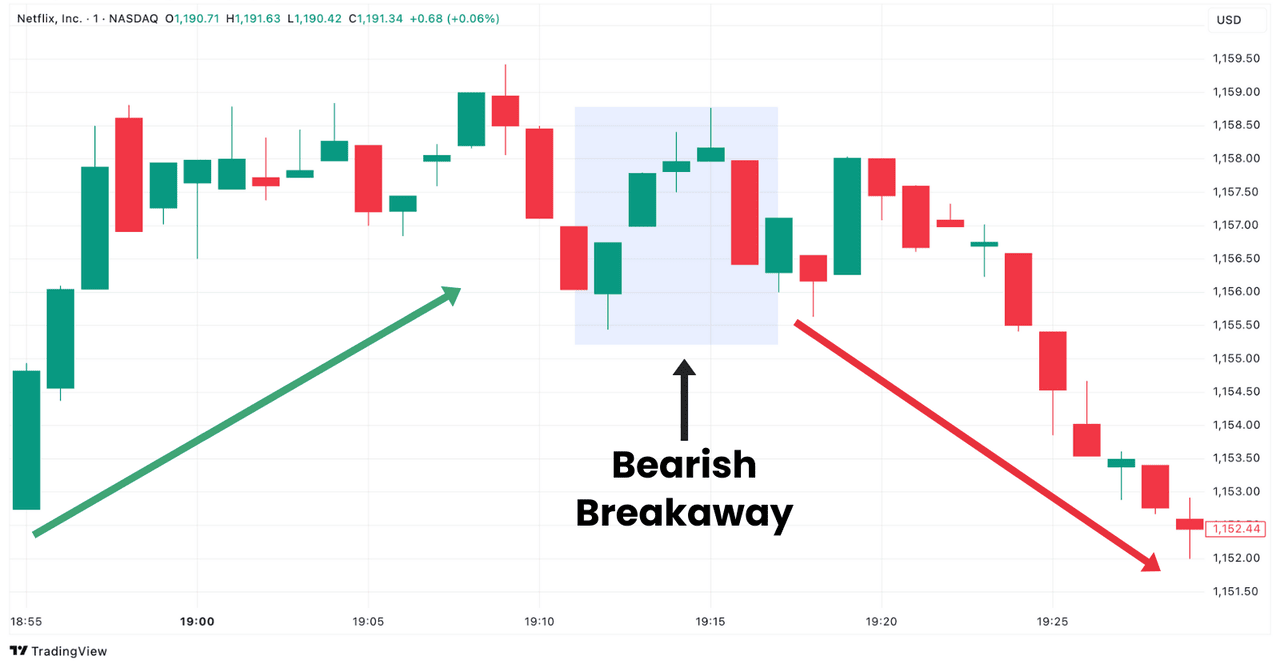
Key Tips For The Breakaway Candlestick Pattern
- Middle three candles move against the original trend, showing reduced momentum.
- The final candle breaks out, confirming the new direction.
- Works well after long, overextended trends.
- A strong closing candle is essential for confirmation.
- More reliable when volume increases during the fifth candle.
| Section | Details |
|---|---|
| Construction | Candle 1: A strong trend candle. Candles 2–4: Small-bodied candles moving against the initial trend. Candle 5: A large candle that closes beyond the range of the previous four. |
| Forecast | A confirmed reversal is likely if the fifth candle closes strongly. |
| Type of Pattern | Five-candle reversal pattern. |
| Trend Prior to the Pattern | Can appear after strong uptrends or downtrends. |
| Opposite Pattern | A bullish breakaway is opposite to a bearish breakaway. |
| Stop-Loss Placement | Below the low (bullish) or above the high (bearish) of the fifth candle. |
| Candlestick Success Rate In Accuracity: | 65% – 72% |
How Set Up a Trade with The Breakaway Candlestick Pattern:
- Identify a breakaway pattern forming after an extended trend.
- Wait for the fifth candle to close beyond the previous candle range.
- Enter a trade in the direction of the breakout candle.
- Place a stop-loss below the low (bullish) or above the high (bearish).
- Set a take-profit level at the next major support/resistance or use a trailing stop.
36. Concealing Baby Swallow
The concealing baby swallow is a rare four-candle bearish reversal pattern that forms during a downtrend and signals the potential for sharp continuation. It’s composed entirely of black (bearish) candles, where the third candle is a small body that gets completely engulfed by the fourth candle.

The second and third candles both have long lower shadows, suggesting that buyers tried to push the price up but were completely overwhelmed by the sellers. It’s found near resistance zones or after a brief consolidation and is seen as a strong continuation signal rather than a reversal.
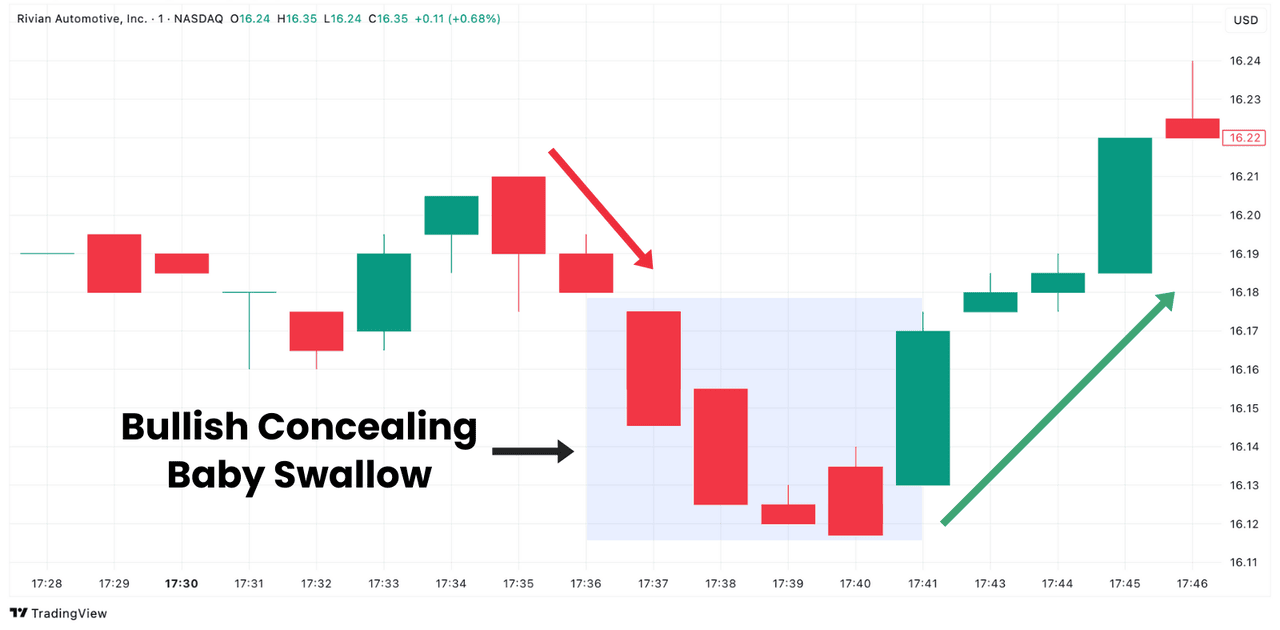
Key Tips For The Concealing Baby Swallow Candlestick Pattern
- A multi-candle pattern indicating bearish trend continuation.
- The third candle is small and gets engulfed by the fourth.
- Reflects failed bullish attempts and renewed selling.
- Works best when found after a pause in a downtrend.
- High volume on the fourth candle confirms continuation.
| Section | Details |
|---|---|
| Construction | Candle 1: A full-bodied bearish candle. Candle 2: Another bearish candle with a long lower shadow. Candle 3: A small bearish candle with a long lower shadow. Candle 4: A large bearish candle that completely engulfs Candle 3. |
| Forecast | Strong downside continuation is expected. |
| Type of Pattern | Four-candle bearish continuation pattern. |
| Trend Prior to the Pattern | Forms during a downtrend or after minor consolidation. |
| Opposite Pattern | None directly opposite. |
| Stop-Loss Placement | Above the high of the fourth candle. |
| Candlestick Success Rate In Accuracity: | Up to 75% |
How Set Up a Trade with The Concealing Baby Swallow Candlestick Pattern:
- Identify the concealing baby swallow during a downtrend.
- Wait for the fourth candle to close strongly and engulf the third.
- Enter a short trade at the close of the engulfing candle.
- Place a stop-loss above the high of the fourth candle.
- Set a take-profit near the next support level or use a trailing stop for extended moves.
(Learn To Trade And Read Candlestick Patterns Like A Pro)
37. Homing Pigeon
The homing pigeon is a two-candle bullish reversal pattern that appears during a downtrend. It consists of two consecutive bearish candles, where the second candle is entirely contained within the body of the first. The homing pigeon pattern is similar to the bullish harami, but both candles are bearish, which makes it less obvious at first glance.

This pattern signals that the selling pressure is starting to weaken, even though the candles are still bearish. The smaller body on the second candle shows hesitation by sellers. If followed by a bullish confirmation candle, it can indicate a shift in momentum and a possible reversal to the upside.

Key Tips For The Homing Pigeon Candlestick Pattern
- Suggests decreasing selling pressure and potential trend reversal.
- Works best near support zones or after sharp declines.
- Often requires confirmation with a bullish candle on the next session.
- Stronger when supported by oversold signals on RSI or other indicators.
- Can lead to sharp reversals if followed by a strong green candle.
| Section | Details |
|---|---|
| Construction | Candle 1: A large bearish candle continuing the downtrend. Candle 2: A smaller bearish candle entirely within Candle 1’s body. |
| Forecast | A reversal is possible if confirmed by a strong bullish candle following the pattern. |
| Type of Pattern | Two-candle bullish reversal pattern. |
| Trend Prior to the Pattern | Forms during a downtrend. |
| Opposite Pattern | Matching Low or Bearish Harami (depending on structure and trend). |
| Stop-Loss Placement | Below the low of the second candle. |
| Candlestick Success Rate In Accuracity: | N/A |
How Set Up a Trade with The Homing Pigeon Candlestick Pattern:
- Spot the homing pigeon pattern forming after a decline.
- Wait for confirmation with a bullish candle breaking above both bearish candles.
- Enter a buy trade at the close of the confirmation candle.
- Place a stop-loss below the low of the second candle.
- Set a take-profit target near the next resistance level.
38. Ladder Bottom
The ladder bottom is a five-candle bullish reversal pattern that develops after a strong downtrend. It starts with three consecutive bearish candles, each making lower lows, followed by a small-bodied doji or spinning top that reflects indecision. The final candle is a strong bullish candle that closes above the prior candle’s high, confirming a potential reversal.

The pattern represents a shift in sentiment, where sellers initially stay in control, but their strength diminishes by the fourth candle. The fifth candle serves as confirmation that buyers have stepped in, turning the momentum in their favor.
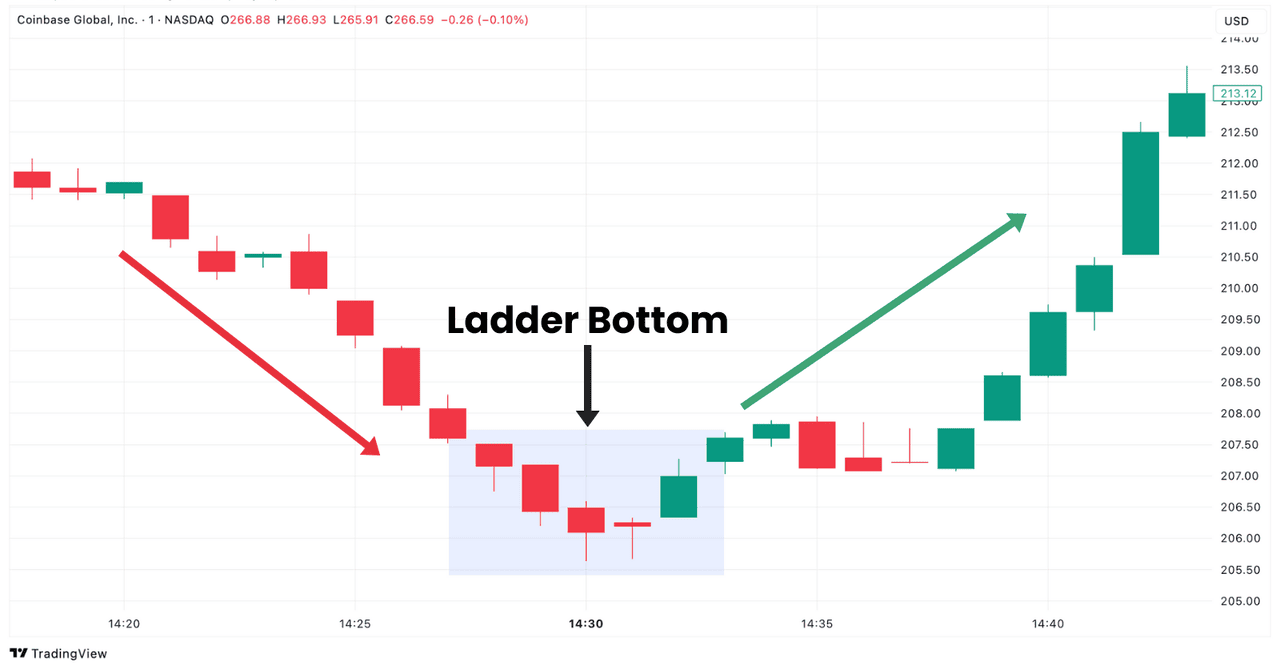
Key Tips For The Ladder Bottom Candlestick Pattern
- The first three candles show clear selling pressure.
- A fourth candle of indecision suggests weakening momentum.
- A strong bullish candle confirms the pattern.
- More effective when occurring at long-term support or oversold levels.
- Works well when paired with reversal indicators like RSI or MACD.
| Section | Details |
|---|---|
| Construction | Candles 1–3: Bearish candles making lower lows. Candle 4: A doji or small real-bodied candle signaling indecision. Candle 5: A bullish candle that closes above the high of the fourth candle. |
| Forecast | A bullish reversal is likely if the fifth candle closes strong. |
| Type of Pattern | Five-candle bullish reversal pattern. |
| Trend Prior to the Pattern | Appears during a strong downtrend. |
| Opposite Pattern | Ladder Top. |
| Stop-Loss Placement | Below the low of the fourth candle. |
| Candlestick Success Rate In Accuracity: | 56% up to 72.4% |
How Set Up a Trade with The Ladder Bottom Candlestick Pattern:
- Identify the ladder bottom forming during a downtrend.
- Wait for the fifth candle to close above the fourth candle’s high.
- Enter a buy trade at the close of the confirmation candle.
- Place a stop-loss below the low of the fourth candle.
- Set a take-profit target at the next resistance or structure zone.
39. Ladder Top
The ladder top is the bearish counterpart of the ladder bottom and appears after a strong uptrend. It consists of three consecutive bullish candles making higher highs, followed by a small-bodied candle that signals hesitation. The fifth candle is a strong, bearish candle that closes below the low of the fourth candle, confirming the potential reversal.

The pattern reflects a market where buyers are gradually losing control. The early bullish candles indicate strength, but as the fourth candle flattens out, momentum is stalling. When sellers take over with a strong push down, the trend is likely to reverse.
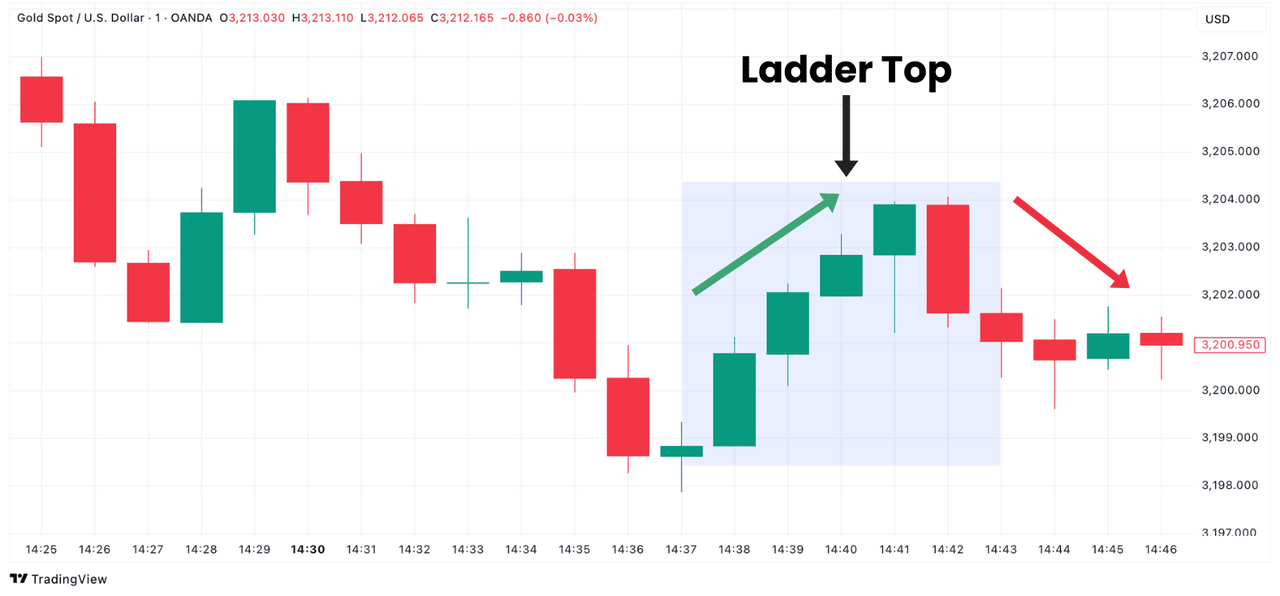
Key Tips For The Ladder Top Candlestick Pattern
- The fifth candle confirms a shift to bearish control.
- More reliable at major resistance or overbought zones.
- Volume tends to rise on the fifth candle, showing renewed seller interest.
- The stronger the bearish close, the more convincing the pattern.
- Can be used with trendlines and oscillators for confirmation.
| Section | Details |
|---|---|
| Construction | Candles 1–3: Bullish candles making higher highs. Candle 4: A small-bodied candle, showing hesitation. Candle 5: A strong bearish candle closing below Candle 4’s low. |
| Forecast | A reversal to the downside is likely if the fifth candle confirms the move. |
| Type of Pattern | Five-candle bearish reversal pattern. |
| Trend Prior to the Pattern | Forms during an uptrend. |
| Opposite Pattern | Ladder Bottom. |
| Stop-Loss Placement | Above the high of the fifth candle. |
| Candlestick Success Rate In Accuracity: | Approx. 52% – 68% |
How Set Up a Trade with The Ladder Top Candlestick Pattern:
- Identify the ladder top forming in a rising market.
- Wait for the fifth candle to close below the previous candle’s low.
- Enter a sell trade at the close of the bearish confirmation candle.
- Place a stop-loss above the high of the fifth candle.
- Set a take-profit target at the next support level or use a fixed risk-to-reward ratio.
40. Matching High
The matching high is a two-candle bearish reversal pattern that forms during an uptrend. It features two consecutive bullish candles that close at or very near the same price, even though they might have different opening levels or wicks. This repeated failure to close higher shows that buying momentum may be stalling, creating a potential reversal setup.
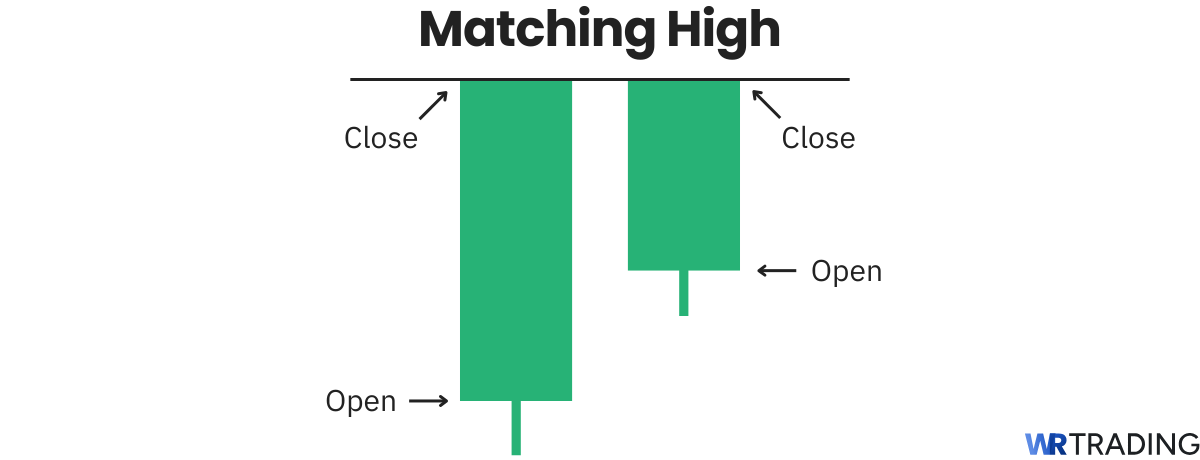
What makes this pattern significant is the repeated rejection at a consistent closing level. It suggests that resistance is holding firm, and buyers are losing their edge. When confirmed by a bearish candle that follows, the matching high often precedes a shift in trend direction.
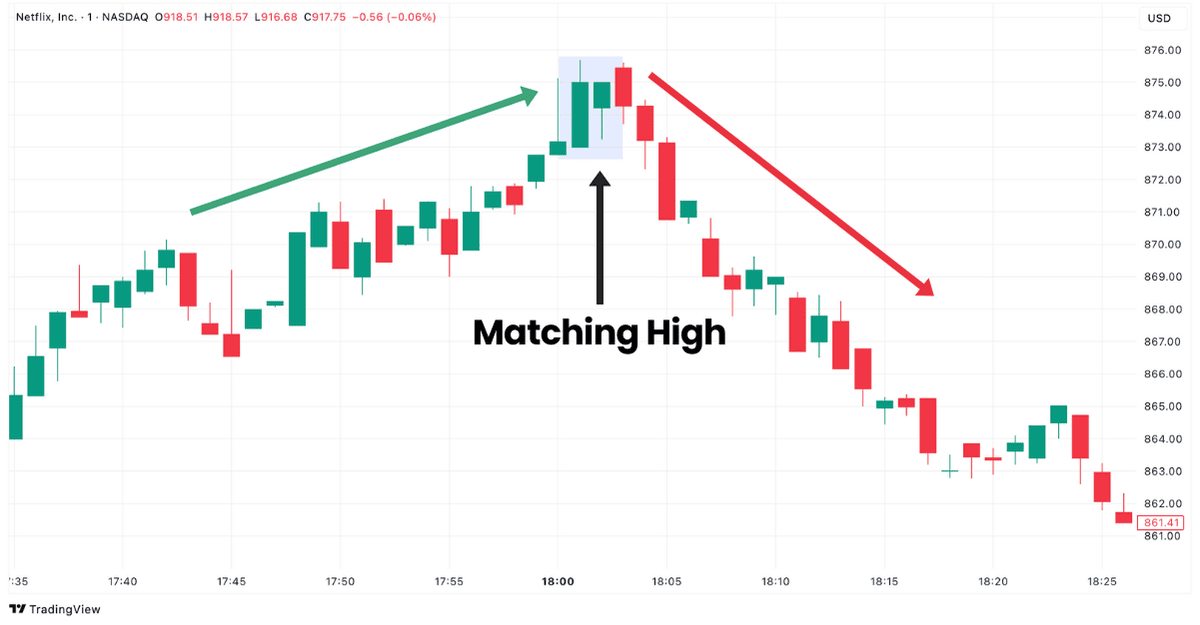
Key Tips For The Matching High Candlestick Pattern
- Indicates a possible top, especially if followed by a bearish candle.
- The smaller the range between the two closes, the stronger the pattern.
- Works best when occurring near known resistance zones or round numbers.
- Often paired with overbought RSI or divergence on momentum indicators.
- Volume may drop on the second candle, hinting at weakening demand.
| Section | Details |
|---|---|
| Construction | Candle 1: A bullish candle forming in an uptrend. Candle 2: Another bullish candle that closes at the same level as Candle 1. |
| Forecast | A potential bearish reversal is expected if followed by a bearish confirmation candle. |
| Type of Pattern | Two-candle bearish reversal pattern. |
| Trend Prior to the Pattern | Forms in an uptrend. |
| Opposite Pattern | Matching Low (a bullish reversal version). |
| Stop-Loss Placement | Above the high of the second candle. |
| Candlestick Success Rate In Accuracity: | Around 61% |
How Set Up a Trade with The Matching High Candlestick Pattern:
- Identify a matching high pattern at a resistance level.
- Wait for confirmation with a strong bearish candle.
- Enter a sell trade at the close of the confirmation candle.
- Place a stop-loss above the high of the second matching candle.
- Set a take-profit target near the next support level.
41. Matching Low
The matching low is a bullish reversal pattern that develops during a downtrend. It involves two consecutive bearish candles that close at the same or nearly identical level. This repeated failure to close lower signals potential support, suggesting that sellers are struggling to push the price further down.

The pattern is more reliable when it forms at or near a major support zone or psychological price level. Although both candles are bearish, the repeated closing price shows that selling momentum may be weakening. Traders wait for a bullish candle afterward to confirm the reversal.
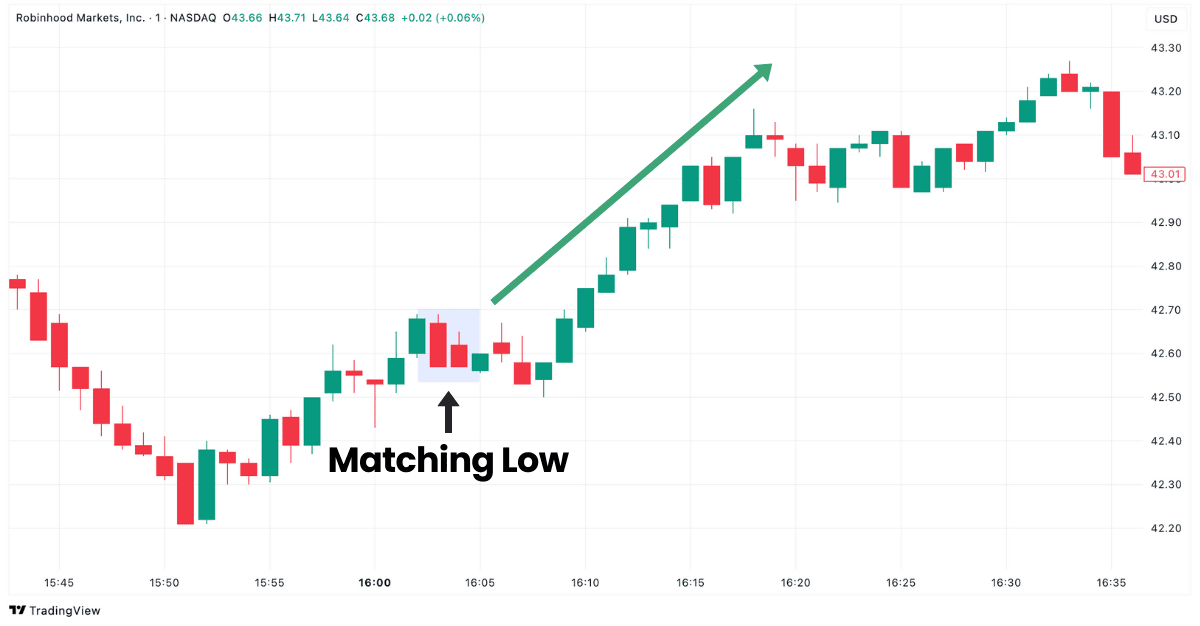
Key Tips For The Matching Low Candlestick Pattern
- Indicates potential exhaustion of selling pressure.
- Works best when forming at long-term support or round-number levels.
- Confirmation is needed via a bullish follow-up candle.
- Can be used with RSI or MACD to identify oversold conditions.
- Volume may decrease on the second candle, hinting at seller fatigue.
| Section | Details |
|---|---|
| Construction | Candle 1: A bearish candle forming during a downtrend. Candle 2: Another bearish candle closing at the same level as the first. |
| Forecast | A bullish reversal is likely if confirmed by a bullish candle afterward. |
| Type of Pattern | Two-candle bullish reversal pattern. |
| Trend Prior to the Pattern | Appears in a downtrend. |
| Opposite Pattern | Matching High. |
| Stop-Loss Placement | Below the low of the second candle. |
| Candlestick Success Rate In Accuracity: | 61% |
How Set Up a Trade with The Matching Low Candlestick Pattern:
- Identify a matching low forming during a decline.
- Wait for confirmation from a bullish candle closing higher.
- Enter a buy trade at the close of the confirmation candle.
- Place a stop-loss just below the second candle’s low.
- Set a take-profit target near the next resistance or based on a fixed ratio.
42. Meeting Lines
The meeting lines is a two-candle reversal pattern that appears in uptrends and downtrends. It features two candles of opposite color that close at nearly the same price, creating a visual alignment or “meeting” at the close. This pattern signals a potential stall in the current trend and the possibility of a reversal.

A bullish meeting lines pattern forms after a decline, where a strong bearish candle is followed by a bullish candle that opens lower but closes at the same level as the first candle’s close. A bearish version forms after an uptrend, where the bullish candle is followed by a bearish candle that closes at the same price.
Key Tips For The Meeting Lines Candlestick Pattern
- Indicates a possible shift in momentum after a strong trend.
- Volume increase on the second candle adds credibility.
- Can be used with divergence signals on indicators like MACD.
- Less reliable in sideways markets.
- Should be confirmed by follow-up candles to validate the reversal.
| Section | Details |
|---|---|
| Construction | Candle 1: A strong candle in the direction of the trend. Candle 2: An opposite-color candle that closes at the same price as Candle 1. |
| Forecast | A potential reversal is expected if the next candle supports the shift. |
| Type of Pattern | Two-candle reversal pattern. |
| Trend Prior to the Pattern | Appears during strong trends, either up or down. |
| Opposite Pattern | Bullish meeting lines contrast and bearish meeting lines. |
| Stop-Loss Placement | Below the low (bullish) or above the high (bearish) of the second candle. |
| Candlestick Success Rate In Accuracity: | N/A |
How Set Up a Trade with The Meeting Lines Candlestick Pattern:
- Identify a meeting lines pattern at a key support or resistance level.
- Wait for confirmation with a third candle moving in the new direction.
- Enter a trade at the close of the confirmation candle.
- Place a stop-loss on the opposite side of the second candle.
- Target the next resistance (bullish) or support (bearish) area for exits.
(Learn To Trade And Read Candlestick Patterns Like A Pro)
43. Bullish Side by Side White Lines
Side by side white lines is a bullish continuation pattern that forms during an uptrend. It begins with a strong bullish candle, followed by a gap up that leads into another bullish candle of similar size and structure. The two candles sit “side by side,” showing consistent buying pressure and confirming the strength of the trend.

The Side by Side White Lines pattern reflects market confidence. The gap between the first and second candles suggests urgency from buyers, and the similar structure of the candles shows steady participation without hesitation. It’s most effective in fast-moving markets where momentum tends to persist.
Key Tips For The Bullish Side by Side White Lines Candlestick Pattern
- The candles should be similar in size and appearance.
- More reliable when supported by high volume.
- Suggests strong buyer interest and uninterrupted trend momentum.
- Works best when occurring after a short consolidation or pullback.
- A third bullish candle following the pattern reinforces the signal.
| Section | Details |
|---|---|
| Construction | Candle 1: A strong bullish candle in an uptrend. Candle 2: Another bullish candle that opens with a gap and closes near the first candle’s close. |
| Forecast | Bullish continuation expected if the pattern is followed by another upward candle. |
| Type of Pattern | Two-candle bullish continuation pattern. |
| Trend Prior to the Pattern | Forms during an established uptrend. |
| Opposite Pattern | Side by side black lines |
| Stop-Loss Placement | Below the low of the first candle. |
| Candlestick Success Rate In Accuracity: | Around 60% |
How Set Up a Trade with The Side by Side White Lines Candlestick Pattern:
- Identify the side by side white lines forming an uptrend.
- Wait for a third bullish candle for confirmation.
- Enter a buy trade at the close of the third candle.
- Place a stop-loss below the low of the first candle.
- Target the next resistance level or use a trailing stop to ride the trend.
44. Bullish Stick Sandwich
The stick sandwich is a bullish reversal pattern consisting of three candles, where a bearish candle is followed by a bullish candle, and then another bearish candle that closes at the same price as the first. Despite the presence of bearish candles on both ends, the failure to push price lower signals potential support and a possible reversal to the upside.

This pattern reflects the market’s inability to break through a support level. Even though sellers attempted to regain control on the third candle, the repeated close at the same price shows buyers are defending that level. A bullish candle that follows confirms the setup.
Key Tips For The Bullish Stick Sandwich Candlestick Pattern
- Indicates strong support around the shared closing price.
- Works best after a steady decline.
- Volume usually drops on the third candle, showing fading selling pressure.
- Requires confirmation with a bullish follow-through candle.
- Can be combined with RSI to identify oversold market conditions.
| Section | Details |
|---|---|
| Construction | Candle 1: A bearish candle closing at a support level. Candle 2: A bullish candle closing above Candle 1’s open. Candle 3: A bearish candle closing at or near Candle 1’s close. |
| Forecast | A bullish reversal is likely if the next candle confirms upward movement. |
| Type of Pattern | Three-candle bullish reversal pattern. |
| Trend Prior to the Pattern | Appears in a downtrend. |
| Opposite Pattern | None direct, but can contrast with Three Black Crows in effect. |
| Stop-Loss Placement | Below the low of the third candle. |
| Candlestick Success Rate In Accuracity: | 62% – 67% |
How Set Up a Trade with The Stick Sandwich Candlestick Pattern:
- Spot a stick sandwich forming after a downtrend.
- Wait for a bullish candle to close above the third candle’s high.
- Enter a buy trade at the close of the confirmation candle.
- Place a stop-loss just below the third candle’s low.
- Set a take-profit target near the next resistance.
45. Three Line Strike
The three line strike is a four-candle reversal pattern that appears at the end of a trend. It begins with three candles moving in the same direction, each closing progressively higher (bullish) or lower (bearish), followed by a strong opposite-direction candle that engulfs the range of the previous three. Despite appearing counter-trend, this pattern often confirms the original direction instead of reversing it.

A bullish three line strike has three green candles followed by one large red candle. If the price resumes upward after the fourth candle, it’s a strong bullish continuation. Likewise, a bearish three line strike begins with three red candles and ends with a large bullish candle before trend continuation.
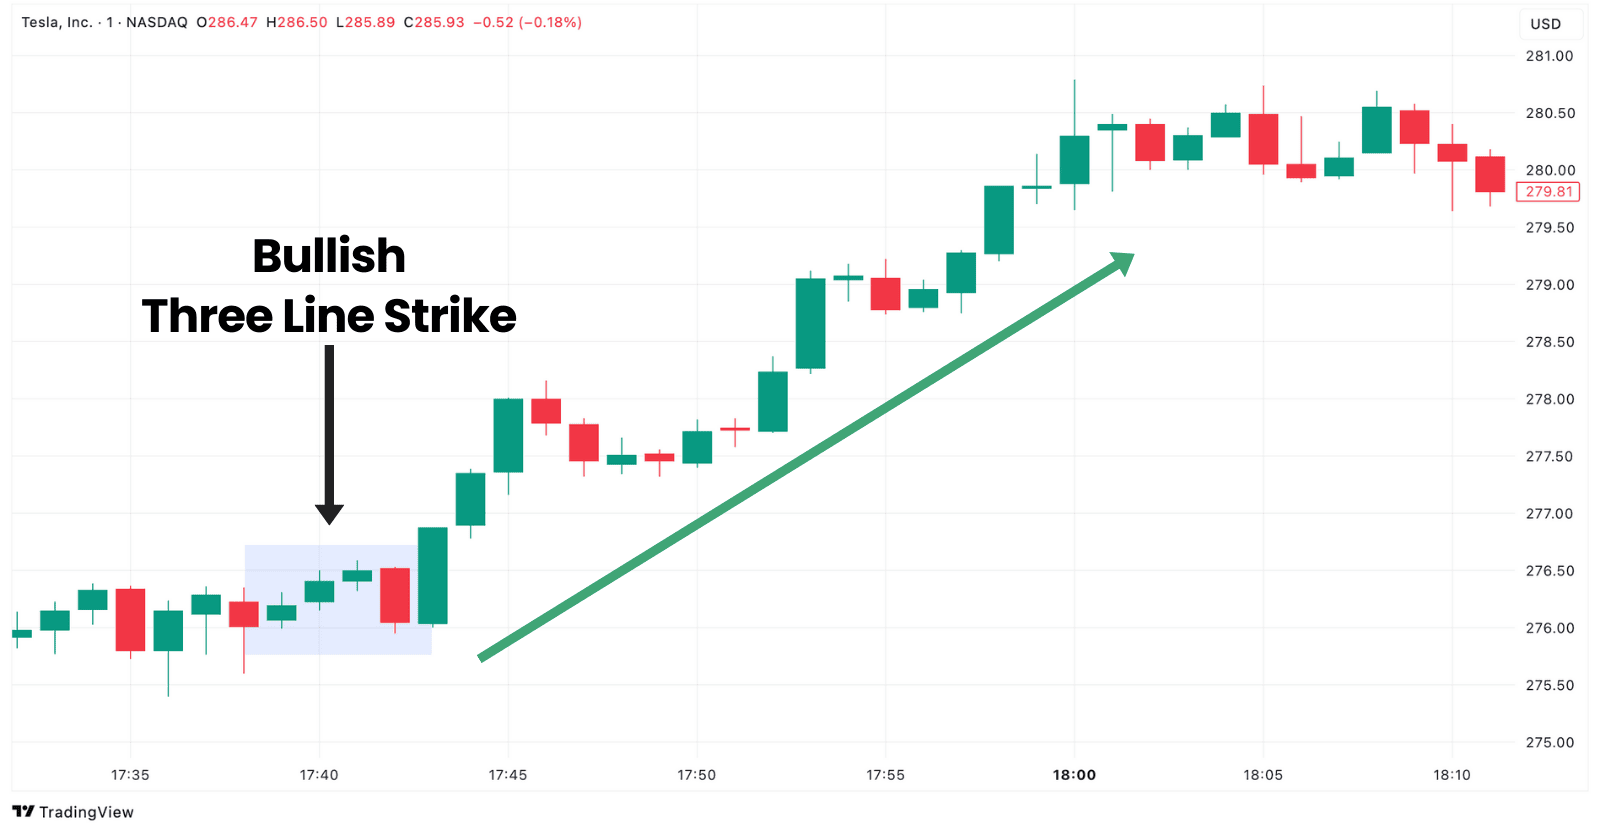
Key Tips For The Three Line Strike Candlestick Pattern
- The fourth candle should engulf the full range of the previous three.
- Works best in strong, trending markets.
- If followed by a fifth candle in the original trend direction, continuation is confirmed.
- More effective on higher time frames like daily or weekly charts.
- Volume tends to spike on the fourth candle due to the strong move.
| Section | Details |
|---|---|
| Construction | Candles 1–3: Three candles moving steadily in the trend’s direction. Candle 4: A large opposite-direction candle engulfing all three prior candles. |
| Forecast | Trend continuation is likely if the next candle resumes in the direction of the first three. |
| Type of Pattern | Four-candle continuation pattern. |
| Trend Prior to the Pattern | Appears in trending markets (either bullish or bearish). |
| Opposite Pattern | None directly. |
| Stop-Loss Placement | Below the low (bullish) or above the high (bearish) of the fourth candle. |
| Candlestick Success Rate In Accuracity: | 50% – 80% |
How Set Up a Trade with The Three Line Strike Candlestick Pattern:
- Identify a three line strike pattern in a trending market.
- Wait for the fifth candle to resume the original trend.
- Enter a trade in the direction of the first three candles.
- Place a stop-loss beyond the extreme of the fourth candle.
- Use a take-profit based on the trend’s next projected leg or recent highs/lows.
46. Unique Three River Bottom
The unique three river bottom is a bullish reversal pattern that forms during a downtrend. It consists of three candles: the first is a large bearish candle, the second is a small-bodied candle (often a spinning top or doji), and the third is a bullish candle that closes above the second. This combination shows a gradual shift in sentiment from bearish to bullish.

Unlike more aggressive reversal patterns, this setup emphasizes subtle weakening of selling pressure followed by a bullish confirmation. Watch for the third candle to close higher to validate the reversal and use it in conjunction with other tools like volume, RSI, or support levels to increase reliability.
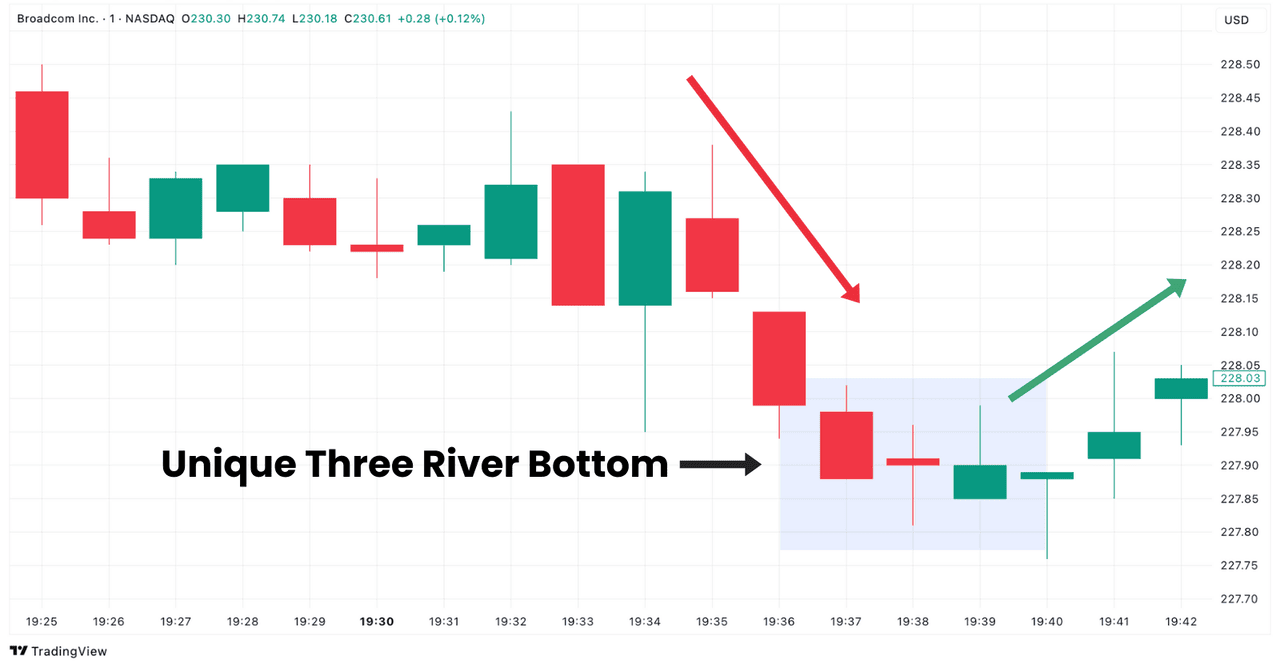
Key Tips For The Unique Three River Bottom Candlestick Pattern
- Works best at the end of extended downtrends.
- More reliable when supported by a bounce from a known support level.
- Volume often drops on the second candle and rises on the third.
- If the third candle closes weak or fails to break above candle 2, the setup weakens.
- Often used with momentum indicators to confirm reversal strength.
| Section | Details |
|---|---|
| Construction | Candle 1: A large bearish candle continuing the downtrend. Candle 2: A small real-bodied candle showing hesitation. Candle 3: A bullish candle closing above the second candle’s close. |
| Forecast | A bullish reversal is likely if the third candle is strong and confirms buying interest. |
| Type of Pattern | Three-candle bullish reversal pattern. |
| Trend Prior to the Pattern | Forms during a prolonged downtrend. |
| Opposite Pattern | None directly. |
| Stop-Loss Placement | Below the low of the third candle. |
| Candlestick Success Rate In Accuracity: | 60% |
How Set Up a Trade with The Unique Three River Bottom Candlestick Pattern:
- Identify a unique three river bottom during a downtrend.
- Wait for the third candle to close above the second for confirmation.
- Enter a buy trade at the close of the third candle.
- Place a stop-loss below the low of the third candle.
- Set a take-profit target at the next resistance or use a fixed reward ratio.
47. Three Stars in the South
Three stars in the south is a rare bullish reversal pattern that appears after a steep downtrend. It consists of three consecutive small-bodied bearish candles, each making lower lows but with diminishing range and weakening momentum. The pattern shows gradual exhaustion among sellers, setting up for a potential reversal.

Key Tips For The Three Starts in the South Candlestick Pattern
- Often seen after extended, fast-moving downtrends.
- Lower shadows become shorter, reflecting weaker selling attempts.
- Works well when price nears a major support or demand zone.
- Volume usually tapers off through the pattern and picks up on confirmation.
- Confirmation is needed with a strong bullish candle following the setup.
| Section | Details |
|---|---|
| Construction | Candles 1–3: Consecutive small bearish candles with declining range and lower shadows. |
| Forecast | Reversal is possible if a strong bullish candle follows. |
| Type of Pattern | Three-candle bullish reversal pattern. |
| Trend Prior to the Pattern | Forms after a rapid downtrend. |
| Opposite Pattern | Three Black Crows. |
| Stop-Loss Placement | Below the low of the third candle. |
| Candlestick Success Rate In Accuracity: | N/A |
How Set Up a Trade with The Three Stars in the South Candlestick Pattern:
- Identify the three stars in the south during a steep decline.
- Wait for a bullish candle to close above the third candle.
- Enter a buy trade at the close of the confirmation candle.
- Place a stop-loss below the lowest candle in the pattern.
- Set a take-profit at the next resistance or use trailing stops for trend trades.
(Learn To Trade And Read Candlestick Patterns Like A Pro)
48. Advanced Block
The advanced block is a bearish reversal pattern that appears near the end of an uptrend. It consists of three consecutive bullish candles, each making higher highs but showing weakening momentum. The second and third candles often have long upper shadows and smaller bodies, which suggests buyer fatigue and the potential for a trend reversal.

The pattern closely resembles the three white soldiers, but the key difference is the loss of strength in each candle. Traders use this setup as a caution signal that an uptrend may be ending, especially if it forms near resistance or when accompanied by bearish divergence on RSI or MACD.

Key Tips For The Advanced Block Candlestick Pattern
- Consists of three rising bullish candles with shrinking body size.
- The upper wicks often grow longer on the second and third candles.
- Volume may decrease with each candle, showing weakening demand.
- Most effective when forming at resistance or after extended uptrends.
- Can act as an early warning for trend shifts even without immediate reversal.
| Section | Details |
|---|---|
| Construction | Candle 1: A full-bodied bullish candle. Candle 2: A bullish candle with a smaller body and upper shadow. Candle 3: A third bullish candle, smaller still, with another upper shadow. |
| Forecast | A potential bearish reversal if confirmed by a fourth bearish candle. |
| Type of Pattern | Three-candle bearish reversal pattern. |
| Trend Prior to the Pattern | Appears after a steady or extended uptrend. |
| Opposite Pattern | Three White Soldiers. |
| Stop-Loss Placement | Above the high of the third candle. |
| Candlestick Success Rate In Accuracity: | Only 36% (can be increased by analysis + indicators) |
How Set Up a Trade with The Advanced Block Candlestick Pattern:
- Spot an advanced block pattern near a resistance level.
- Wait for a bearish candle to close below the third candle’s low.
- Enter a sell trade at the close of the confirmation candle.
- Place a stop-loss above the high of the third candle.
- Set a take-profit target at the next support zone.
49. Deliberation
The deliberation pattern is a bearish reversal formation made up of three bullish candles, similar in structure to the three white soldiers. The main difference is in the loss of momentum seen in the third candle. The first two candles are strong and show continued buying interest, but the third candle is noticeably smaller, often with an upper wick, showing hesitation or resistance.

The pattern suggests that although buyers are still present, they are beginning to run into selling pressure. It serves as a warning that the uptrend may be losing strength. A bearish confirmation candle following the deliberation pattern helps validate the shift in momentum.

Key Tips For The Deliberation Candlestick Pattern
- More effective when appearing at resistance zones or after long bullish runs.
- Volume fades on the third candle, signaling potential fatigue.
- Often used as a caution signal ahead of possible reversals.
- Not confirmed until a bearish candle follows.
- Works well with overbought signals from RSI or divergence setups.
| Section | Details |
|---|---|
| Construction | Candle 1: A strong bullish candle. Candle 2: Another bullish candle closing higher. Candle 3: A smaller bullish candle with signs of hesitation (small body or upper wick). |
| Forecast | A potential bearish reversal if followed by a bearish confirmation candle. |
| Type of Pattern | Three-candle bearish reversal pattern. |
| Trend Prior to the Pattern | Forms during an uptrend. |
| Opposite Pattern | Three White Soldiers. |
| Stop-Loss Placement | Above the high of the third candle. |
| Candlestick Success Rate In Accuracity: | Around 55% |
How Set Up a Trade with The Deliberation Candlestick Pattern:
- Identify a deliberation pattern forming after a steady rise.
- Wait for a bearish candle closing below the third candle’s low.
- Enter a sell trade at the close of the confirmation candle.
- Set a stop-loss above the high of the third candle.
- Place a take-profit at the next support level.
50. Identical Three Crows
Identical three crows is a strong bearish reversal pattern that forms at the end of an uptrend. It consists of three consecutive bearish candles that each open at or near the close of the previous candle, and all close lower. This structure indicates persistent selling pressure and little to no bullish retracement between sessions.

Unlike the standard three black crows, the identical opens reinforce the idea that sellers are in control and buyers are retreating entirely. It’s considered a reliable pattern when there is high volume or after an overbought signal.

Key Tips For The Identical Three Crows Candlestick Pattern
- Effective after long bullish trends or near resistance levels.
- Volume increasing through the pattern reinforces selling pressure.
- Rare but highly reliable when confirmed by broader market conditions.
- Often signals the start of a multi-session downtrend.
- Can be used with MACD crossovers or RSI divergence for stronger confirmation.
| Section | Details |
|---|---|
| Construction | Candle 1: A full-bodied bearish candle. Candle 2: Another bearish candle that opens near Candle 1’s close and closes lower. Candle 3: A third bearish candle, also opening near the prior close and closing lower. |
| Forecast | A strong bearish trend reversal is expected. |
| Type of Pattern | Three-candle bearish reversal pattern. |
| Trend Prior to the Pattern | Appears at the top of an uptrend. |
| Opposite Pattern | Three White Soldiers. |
| Stop-Loss Placement | Above the high of the first or third candle. |
| Candlestick Success Rate In Accuracity: | N/A |
How Set Up a Trade with The Identical Three Crows Candlestick Pattern:
- Spot an identical three crows pattern after a strong uptrend.
- Wait for a fourth candle confirming the move lower.
- Enter a sell trade at the close of the confirmation candle.
- Set a stop-loss above the highest candle in the pattern.
- Use a take-profit target at the next support.
(Learn To Trade And Read Candlestick Patterns Like A Pro)
What Are Candlestick Patterns?
Candlestick patterns graphically display daily price movement information on a chart. They display the details of an asset’s price movement and can predict the future price direction.
Candlestick charting originated in Japan in the 18th century. It was developed by Munehisa Homma, a rice trader from Sakata, who used this method to analyze rice market trends. His techniques laid the foundation for modern candlestick patterns, which were later popularized in the Western world by Steve Nison in the 1990s.
Candlestick patterns generally represent one full day of price movement, so there are often approximately 20 trading days with 20 candlestick patterns in one month.
Candlestick charts are a major component of a candlestick pattern. They present the price movements of derivatives, securities, and currencies as patterns. It is a crucial aspect of technical analysis and is used to interpret price information quickly from just a few price bars.
The candlestick details a single trading on a daily chart. Below are its three basic features:
- The body represents the open-to-close-range.
- The wick (the shadow) shows the intra-day, high or low.
- The color shows the direction of the price movement- a green (or white body) shows a price increase, while a red (or black body) shows that the price has reduced.
Candlesticks create patterns that help traders identify significant support or resistance levels over some time. Many candlestick patterns show opportunities within the market. For example, while some give insights into the balance between buying and selling pressures, others pinpoint continuation patterns.
What Is The Relevance and Accuracy of Candlestick Patterns?
Different market factors, including the circumstances surrounding a trade, influence the relevance and accuracy of candlestick patterns. In most cases, candlestick patterns need to be more accurate for many traders to depend on. Therefore, they combine candlestick patterns with other risk management techniques to increase accuracy.
Below are specific factors that could influence the accuracy of candlesticks:
- Timeframe: The more prolonged the period is, the better the accuracy.
- Pattern and signal size: Large patterns often provide better signal accuracy.
- Security: Candlesticks work differently for forex, crypto, stocks, futures, and options. For example, some candlesticks work better for large-cap liquid stocks.
- Overall pattern: The environment surrounding perceived signals can influence the accuracy. Traders can study the environment to identify why a signal occurred or did not occur.
- Number of candles: The number of candles involved in a pattern can determine its accuracy. Usually, the more candles, the higher the accuracy.
Candlestick charts consist of various information based on the high, low, open, and close for the timeframe a trader selects. Taking time to review the market context carefully can help increase the accuracy of candlesticks.
What Are The Best Books To Learn Candlestick Patterns?
Several books consistently stand out as reliable sources for learning candlestick patterns, both for beginners and experienced traders. These books offer practical insights, clean chart examples, and well-researched explanations that don’t rely on outdated theories or vague interpretations.
- Japanese Candlestick Charting Techniques by Steve Nison: This is the most referenced book on the subject and widely credited with introducing candlestick patterns to the Western trading community. It covers individual patterns, combinations, historical context, and how they integrate with Western technical tools. The explanations are clear, and the examples are based on real-world charts.
- Encyclopedia of Candlestick Charts by Thomas Bulkowski: Bulkowski’s book is extremely detailed and goes beyond definitions. He includes statistical performance analysis for each pattern, something many other resources leave out. It’s a reference guide, best used to verify how often patterns work based on historical data.
- The Candlestick Course by Steve Nison: This book is a practical extension of the author’s original book. It includes quizzes, chart exercises, and examples geared toward application. It’s useful if you prefer structured learning with reinforcement tools.
- Beyond Candlesticks by Steve Nison: This one is slightly more advanced. It covers lesser-known Japanese charting techniques like Renko and Kagi, and goes into more subtle candlestick variations. It’s useful for traders looking to go beyond basic pattern recognition.
- Technical Analysis of the Financial Markets by John J. Murphy: This book is not focused mainly on candlesticks, it includes a strong section on them and shows how they fit into broader technical strategies. It’s valuable if you want to place candlestick patterns in context with trend analysis, volume, and indicators.
Can You Use Candlestick Patterns In Each Timeframe?
Yes, candlestick patterns can be used across all timeframes. The visual structure of the pattern remains the same regardless of whether you’re looking at a 1-minute chart or a monthly chart. What changes is how much information each candle represents and how that fits into your overall strategy.
The timeframe doesn’t change the nature of the pattern, but it does affect how reliable and actionable it is. A bullish engulfing candle on a 15-minute chart might only reflect temporary momentum, while the same pattern on a daily chart may suggest a full shift in trend.
Traders use patterns on one timeframe while checking higher ones to confirm the broader direction. This multi-timeframe approach helps filter out weak signals and can give a clearer view of market context.
Which Timeframe is the best for Candlestick Patterns?
There’s no single “best” timeframe for candlestick patterns that applies to every trader, it depends entirely on your trading style and strategy you are trying to implement. That said, daily charts are widely considered the most reliable timeframe for spotting and trading candlestick patterns.
Daily Timeframe
Patterns that form on daily charts carry more weight because each candle reflects a full trading session. This timeframe filters out intraday noise and shows clearer setups that are more likely to result in meaningful moves. Many swing traders and even institutional participants rely on daily candlestick signals when planning entries and exits. Most of the classic patterns like engulfing candles, hammers, and evening stars tend to perform more consistently here.
4-Hour and 1-Hour Charts
These timeframes are popular among short-term traders who want more opportunities without sacrificing too much signal quality. Patterns that form on these charts are less susceptible to fake-outs than those on 5- or 15-minute charts. They’re useful when aligned with the broader trend on higher timeframes like the daily chart.
Weekly Charts
Long-term investors or position traders will find weekly candlestick patterns are highly reliable. A single candle covers five trading days, and any setup that forms here reflects a much larger group of traders taking action. Patterns on weekly charts are less frequent but more significant when they appear.
Short Charts: 1-minute or 5-minute
Avoid relying on very low timeframes like 1-minute or 5-minute unless you’re scalping with a clear strategy. Patterns on these charts can look technically valid but fail quickly due to random price spikes, spreads, and slippage.
What Are The Limitations Of Candlestick Patterns?
Candlestick patterns are great for predicting future price movements, but they’re not foolproof. Traders who use them without understanding their limitations often end up misreading signals or forcing trades that aren’t there. Here’s what you need to keep in mind:
They Need Context to Work
A candlestick pattern means very little on its own. Without knowing where it’s forming – near support, resistance, trendlines, or key zones – it’s just a random arrangement of candles. The same pattern can mean two very different things depending on the surrounding structure.
Patterns Can Be Too Open to Interpretation
Not every engulfing candle is clear-cut. Some traders count partial overlaps; others don’t. What looks like a valid morning star to one person might look like nothing special to someone else. This subjectivity makes candlestick trading inconsistent if you don’t define your own rules.
They’re Often Late to the Move
Candlesticks react to what’s already happened. A reversal pattern like a hammer appears after price has dropped. That’s helpful for timing, but it means you’re always entering after the initial shift, not ahead of it.
They Don’t Explain Why Price Moved
Candles show what happened but not why. A bearish engulfing candle might signal strong selling, but if there’s no fundamental reason behind it, the move could be short-lived. This is where combining price action with market context like news, volume, and sentiment becomes important.
Low Timeframes Create More Noise
On charts like the 1-minute or 5-minute, candlestick patterns form constantly but most of them are unreliable. There’s too much random price movement, and patterns can be triggered by one big order or a quick news headline. The lower the timeframe, the more false signals you’ll run into.
They Don’t Predict Future Movement Alone
Patterns like evening stars or three white soldiers don’t guarantee price movement. They suggest what might happen, but the price can easily go the other way. Using patterns without confirmation is one of the fastest ways to get caught in fakeouts.
They Can Fail Without Warning
Even when a pattern forms perfectly and meets all the textbook conditions, it can still fail. No pattern has a 100% success rate. That’s why risk management and trade confirmation are required for long term trading success.
How High Is The Hit-Rate Of Candlestick Patterns?
The hit-rate of candlestick patterns varies depending on the specific pattern, the market conditions, and the timeframe it’s used on. Most patterns have an average success rate of 66%, but some perform better under certain conditions. For example, a bullish engulfing pattern forming near strong support with high volume will likely outperform the same setup forming in the middle of a sideways range.
It’s important to understand that candlestick patterns don’t guarantee outcomes, they highlight potential next market moves. Even the most reliable patterns fail regularly, which is why they’re best used as entry signals within a structured trading plan like WR Trading, not standalone systems. Traders who track their setups with confirmation tools, proper risk management, and attention to market context tend to see better results than those relying on patterns alone.
Difference Between Candlestick Patterns and Chart Formations
Candlestick patterns and chart formations are used in technical analysis to interpret market behavior. Yet, they differ in their scope and application. Candlestick patterns focus on individual price bars, typically representing one trading session, and provide insights into market sentiment within that period, such as potential reversals or continuations.
Conversely, chart formations consist of broader patterns formed by multiple price bars over an extended period, offering insights into the trend and potential future price movements.
These formations often require a longer-term perspective and provide signals related to trend continuation or reversal on a larger scale. Hence, while candlestick patterns and chart formations contribute to comprehensive technical analysis, they operate differently.
Pros and Cons of Candlestick Trading Patterns
Below are the advantages and downsides of candlestick trading patterns:
Pros
- Candlesticks provide a quick insight into market direction and actions
- Each candlestick displays four crucial points: opening, closing, high, and low, offering traders a comprehensive view.
- Color-coded candlesticks swiftly indicate market momentum direction
- Unique candlestick combinations form patterns not visible on other charting systems, offering unique insights
- Candlesticks are adaptable to various time frames, reflecting different trends accurately
Cons
- The abundance of information in candlestick charts may overwhelm some traders, affecting decision-making.
- Determining the sequence of high and low points may be challenging without real-time market observation.
Candlestick patterns give traders a quick and clear picture of how the market is moving. They show traders important points like when prices opened, closed, went high, and went low.
However, although they are valuable for understanding market trends and momentum, we recommend not getting overwhelmed by too many details.
How To Trade Candlestick Patterns?
Trading candlestick patterns doesn’t have to be complicated if you approach it systematically. Here’s a practical, six-step method that’s clear, detailed, and beginner-friendly:
Identify a Valid Candlestick Pattern
Start by examining your charts carefully for common candlestick patterns such as the Hammer, Shooting Star, Engulfing, or Morning Star. Ensure the pattern is clearly visible and occurs at significant price levels, like strong support or resistance areas. Patterns that occur at these key market levels often lead to stronger, more reliable signals.
Confirm the Pattern with the Next Candle
Never enter a trade solely based on the appearance of a candlestick pattern. Always wait for the next candle to provide confirmation. For example, after a bullish Hammer appears at support, wait for a strong green candle to close clearly above the Hammer’s high. This step significantly reduces the chance of entering a false signal.
Conduct Simple Technical Analysis
After confirming the candlestick pattern, do a quick yet thorough analysis using other basic tools and indicators to support your decision. Check if moving averages, trendlines, or indicators like RSI or MACD align with your pattern. If the pattern matches the broader technical context – for example, a bullish candlestick pattern occurs near an upward-trending moving average – the trade becomes even more reliable.
Enter the Trade at a Smart Price Level
Once your pattern is confirmed and supported by your analysis, enter the trade at the closing price of the confirmation candle. This entry approach prevents you from entering too late or chasing the market after the price has already moved significantly.
Set Clear Stop-Loss and Take-Profit Targets
Immediately set your stop-loss order to protect yourself. Place your stop-loss slightly below the lowest wick of a bullish pattern or slightly above the highest wick of a bearish pattern. Setting clear profit targets is equally important. Use logical levels such as previous highs, lows, support, or resistance. Aim for trades with a favorable risk-to-reward ratio, ideally at least twice your potential risk.
Manage Your Trade and Reflect on Results
Stay actively involved in your open trades by adjusting your stop-loss to lock in profits as the price moves in your favor. Don’t move stops closer if the trade moves slightly against you; stick to your original plan.
Once the trade concludes, review it in detail – note what worked well and where you could improve. Learning from each trade will steadily make you a more skilled, consistent, and profitable trader.
(Learn To Trade And Read Candlestick Patterns Like A Pro)
How To Find Candlestick Patterns in the Chart?
Recognizing candlestick patterns accurately on your charts is a valuable skill that enhances your trading performance. To help you master this, here’s a clear, practical six-step approach that anyone can follow:
Choose the Right Chart and Timeframe
Begin by selecting a clear, easy-to-read candlestick chart from your preferred trading platform. Your chosen timeframe significantly influences pattern clarity. Daily charts often offer reliable signals due to less noise, making it easier to spot patterns clearly. Shorter timeframes like hourly or 15-minute charts can also be useful but may require extra confirmation to avoid false signals.
Zoom Out and Understand the Context
Before you start identifying patterns, zoom out slightly to get a broader perspective of the current trend and price action. Clearly define whether the market is trending upwards, downwards, or moving sideways. Patterns appearing at key levels, such as major support or resistance zones, are more likely to produce stronger and more reliable trading signals.
Clearly Identify the Individual Candles
Carefully examine the recent candles one by one, noting the key price points – open, high, low, and close. Look specifically for candles with distinct characteristics, such as long wicks (which indicate strong rejection of price levels) or large bodies (which suggest strong buying or selling pressure). Understanding these individual candle characteristics sets the foundation for accurate pattern recognition.
Look for Recognizable Patterns
Once you’re familiar with individual candles, actively look for established candlestick patterns, including Engulfing, Hammers, Dojis, Morning Stars, and Evening Stars. Remember, patterns can consist of one, two, or several candles. Scan through the chart carefully and consistently to ensure you don’t overlook critical signals.
Confirm the Pattern Through Subsequent Price Action
Finding a candlestick pattern alone isn’t enough. Always verify the pattern through subsequent candles. For example, a Hammer at the bottom of a downtrend should ideally be followed by a bullish candle closing above the Hammer’s high to confirm that buyers are indeed entering the market. Waiting for this confirmation significantly improves the accuracy of your findings.
Validate Patterns with Additional Indicators
After identifying and confirming the candlestick pattern, cross-check it with other simple indicators or technical tools like moving averages, support/resistance levels, RSI, or volume indicators. If multiple indicators align and support the candlestick pattern you’ve found, it enhances confidence in your analysis, leading to stronger, higher-probability trades.
Which Different Types Of Candlestick Patterns Exist?
Candlestick patterns are clearly divided into 4 main types (categories) based on the market behavior they represent (Reversal/Bearish, Continuation, Consolidation, Bullish). Understanding these candlestick pattern types helps you quickly identify market conditions and improve your trading decisions.
See in this table below the 50 different Candlestick Patterns and their categorisation:
| Number | Candlestick Pattern | Signal | Description |
|---|---|---|---|
| 1 | Hammer | Bullish Reversal | A small-bodied candle with a long lower wick, showing rejection of lower prices. |
| 2 | Shooting Star | Bearish Reversal | A small-bodied candle with a long upper wick, rejecting higher price levels. |
| 3 | Bullish Engulfing | Reversal | One candle fully engulfs the previous candle’s body, signaling a shift in direction. |
| 4 | Morning Star | Bullish Reversal | Three candles: bearish, indecision, then bullish – indicating trend reversal. |
| 5 | Evening Star | Bearish Reversal | Three candles: bullish, indecision, then bearish – signaling a trend top. |
| 6 | Harami | Reversal | A smaller candle forms within the previous candle’s range, showing hesitation. |
| 7 | Hanging Man | Bearish Reversal | A small body with a long lower wick appearing after an uptrend. |
| 8 | Doji | Indecision/Neutral | A candle with little to no body, showing balance between buyers and sellers. |
| 9 | Pin Bar | Reversal | A long wick and small body indicating price rejection and potential reversal. |
| 10 | Bullish Mat Hold | Bullish Continuation | A five-candle formation where a brief pause is followed by trend continuation. |
| 11 | Gap Up / Gap Down | Momentum – Reversal / Continuation | A price gap between candles often signals strong momentum. |
| 12 | Tri Star | Reversal | Three consecutive Doji candles suggesting extreme market indecision. |
| 13 | Tweezer Top / Bottom | Reversal | Two candles with matching highs or lows at turning points. |
| 14 | Belt Hold | Reversal | A strong single candle with no wick on one side, showing firm direction. |
| 15 | Abandoned Baby | Reversal | A Doji gapped between two opposite candles, marking sudden reversal. |
| 16 | Kicker | Reversal | A sharp directional shift with a gap open opposite the prior trend. |
| 17 | Three Outside Up / Down | Reversal | Engulfing candle followed by a third confirming the new direction. |
| 18 | Three Inside Up / Down | Reversal | Harami confirmed by a third candle in the direction of the reversal. |
| 19 | Piercing Line | Bullish Reversal | Bullish candle closes above the midpoint of the prior bearish candle. |
| 20 | Dark Cloud Cover | Bearish Reversal | Bearish candle closes below midpoint of prior bullish candle. |
| 21 | Three Black Crows | Bearish Reversal | Three large red candles in a row after an uptrend. |
| 22 | Rising Three Methods | Bullish Continuation | A bullish candle, small pullback candles, and then another bullish candle. |
| 23 | Falling Three Methods | Bearish Continuation | A bearish candle, small upward candles, then a continuation downward. |
| 24 | Tasuki Gap | Continuation | Gapped candles followed by a pullback that does not fill the gap. |
| 25 | Inside Bar | Neutral / Breakout | A candle entirely within the prior candle’s range, showing contraction. |
| 26 | Outside Bar | Reversal / Breakout | A large candle engulfs the prior candle’s range, showing strength. |
| 27 | Spinning Top | Indecision | A small body with long upper and lower wicks, reflecting uncertainty. |
| 28 | Popgun | Breakout Setup | An inside bar followed by an outside bar, anticipating a breakout. |
| 29 | Shaven Head | Bullish Continuation | Bullish candle with no upper wick, showing strength to the close. |
| 30 | Shaven Bottom | Bearish Continuation | Bearish candle with no lower wick, showing strong selling. |
| 31 | High Wave Candlestick Pattern | Indecision | A small real body with long wicks, reflecting market instability. |
| 32 | Separating Lines | Continuation | Opposite color candles with the second opening at the first’s open. |
| 33 | On Neck | Bearish Continuation | Bullish candle closes at or near prior candle’s low, showing failure to recover. |
| 34 | In Neck | Bearish Continuation | Bullish candle closes slightly above the previous bearish close. |
| 35 | Breakaway | Reversal | Five candles showing a loss of momentum followed by a trend change. |
| 36 | Concealing Baby Swallow | Bearish Continuation | Bearish candles where the last engulfs a small-bodied one. |
| 37 | Homing Pigeon | Bullish Reversal | Two bearish candles with the second within the first’s body. |
| 38 | Ladder Bottom | Bullish Reversal | Three bearish candles, then a doji and a bullish candle. |
| 39 | Ladder Top | Bearish Reversal | Three bullish candles, then a doji and a bearish candle. |
| 40 | Matching High | Bearish Reversal | Two bullish candles closing at the same level near resistance. |
| 41 | Matching Low | Bullish Reversal | Two bearish candles closing at the same level near support. |
| 42 | Meeting Lines | Reversal | Two opposite candles that close at the same price. |
| 43 | Bullish Side by Side White Lines | Bullish Continuation | Two bullish candles with similar size and structure after a gap. |
| 44 | Bullish Stick Sandwich | Bullish Reversal | Bullish candle sandwiched between two bearish candles with matching closes. |
| 45 | Three Line Strike | Continuation | Three candles in trend direction followed by a large opposite candle. |
| 46 | Unique Three River Bottom | Bullish Reversal | Bearish candle, indecision, then bullish confirmation. |
| 47 | Three Stars in the South | Bullish Reversal | Three small bearish candles with decreasing range. |
| 48 | Advanced Block | Bearish Reversal | Three rising candles losing strength, suggesting exhaustion. |
| 49 | Deliberation | Bearish Reversal | Three bullish candles with weakening momentum. |
| 50 | Identical Three Crows | Bearish Reversal | Three bearish candles with nearly identical opens and lower closes. |
1. Reversal Candlestick Patterns
Reversal candlestick patterns indicate a possible shift in market direction. They appear at key turning points, signaling the end of an existing trend – either from bullish to bearish or vice versa. Common reversal patterns include the Hammer, Shooting Star, Engulfing Pattern, Morning Star, and Evening Star. Traders pay close attention to reversal patterns at significant price areas like major support or resistance, as these typically provide the strongest and most reliable signals.
2. Continuation Candlestick Patterns
Continuation candlestick patterns show that the current trend is likely to keep going after a brief pause or consolidation. These patterns signal a temporary rest period before the market resumes its original direction. Identifying these patterns within a clear trend can help traders confidently stay with the current momentum and ride the trend further.
3. Consolidation Candlestick Patterns
Consolidation or indecision candlestick patterns form when neither buyers or sellers are clearly in control, resulting in sideways price movements. Patterns like the Doji, Inside Bar, Spinning Top, or High Wave candle fall into this category. Consolidation patterns highlight periods of uncertainty and usually lead to breakouts, either continuing the existing trend or starting a new direction altogether. Always wait for a clear breakout from these patterns before entering trades to reduce the risk of false signals.
4. Bullish Candlestick Patterns
Bullish candlestick patterns suggest that buyers are gaining control and prices may rise. These patterns often form after a decline or during consolidation, signaling the potential start or continuation of an upward move.
Common bullish patterns include the Hammer, Bullish Engulfing, Morning Star, Piercing Line, and Three White Soldiers. These setups become more reliable when they appear near support zones, trendlines, or Fibonacci levels. Bullish patterns reflect a shift in market sentiment, where buying pressure overcomes selling pressure.
5. Bearish Candlestick Patterns
Bearish candlestick patterns indicate that selling pressure may soon outweigh buying interest, often forming at the end of an uptrend or after a brief pause in bullish momentum. These patterns suggest a bearish reversal and are used by traders to anticipate selloffs. Examples include the Shooting Star, Bearish Engulfing, Evening Star, and Three Black Crows. Bearish patterns become more reliable near resistance zones or after overextended price runs when confirmed by a strong close in the following session. They are great for timing exits or short entries.
Download Our Candlestick Pattern PDF (Cheat Sheet & Bible)
Download our free Candlestick Pattern PDF: Cheat Sheet & Bible by WR Trading by clicking on the button below. You can read it, print it, and learn with it to trade candlesticks. In the Candlestick Pattern PDF, we will give you all graphics, instructions, and an overview via a cheat sheet to use candlestick formations the right way. Feel free to share our PDF file everywhere.
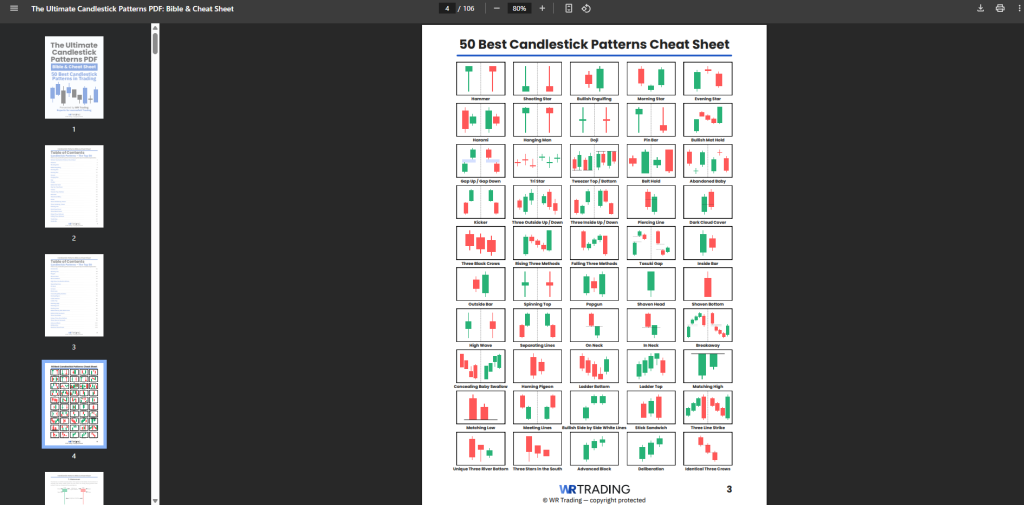
What Are the Worst Candlestick Patterns?
Due to their practicality and low sucess rate, these 3 candlestick patterns are seen as the least reliable:
- Rising Window / Falling Window
- Tri Star
- Mat Hold
Not every candlestick pattern offers a high-probability trading signal. Some are vague, hard to spot in real-time, or just don’t deliver consistent follow-through. These patterns may appear impressive in theory but lack practicality when it comes to real-world chart setups.
Here are three candlestick patterns that are considered the worst, not because they’re completely useless, but because they tend to be inconsistent, misleading, or too rare to rely on as a primary signal.
Rising Window / Falling Window
These are continuation patterns that rely on gaps between candles. The problem is they’re hard to spot on many charts – forex, crypto, and most CFD brokers don’t display gaps clearly due to continuous trading. Even when they do appear, there’s no standard rule for how wide the gap must be or how to confirm the continuation.
Tri Star
The Tri Star is one of the rarest candlestick patterns you’ll ever see when trading. It requires three doji candles in a row, which rarely happens with clean symmetry unless you’re specifically looking for them. Even when it does form, it’s hard to confirm, and the market often continues sideways, making it more of a statistical fluke than a reliable setup.
Mat Hold
This five-candle bullish continuation pattern looks great in textbooks but is difficult to trade in real conditions. You need a perfect sequence of candles: one strong bullish, followed by a tight consolidation, and then a breakout, all with precise candle ranges. Because of how specific this setup is, you’ll almost never see it form cleanly, and even when you do, it’s usually too late to catch a decent risk-to-reward setup.
Can Candlestick Patterns Be Used In All Types of Markets?
Yes, candlestick patterns aren’t limited to one market – they’re versatile and widely used because they represent human psychology and market sentiment. Traders across various markets and assets, from cryptocurrencies and stocks to forex and commodities, rely on these patterns to understand and predict price movements. Here’s how they apply to different markets:
Crypto
Crypto markets are known for their volatility and fast price changes. This means candlestick patterns often show up very clearly, offering quick insights into shifts between buyers and sellers.
In crypto, traders rely heavily on short-term patterns to spot potential reversals or momentum changes early. Given the speed at which crypto prices move, it’s useful to combine candlestick patterns with volume or simple technical indicators like RSI to confirm signals.
Forex
Forex markets run around the clock during weekdays, resulting in a lot of clear, consistent price patterns. Because currencies are directly influenced by global economic events and news, candlestick patterns often highlight important moments of market indecision or strong shifts in sentiment. Forex traders pair candlestick patterns with fundamental data releases or economic news calendars to strengthen their analysis, providing both technical and fundamental context.
Stocks
In stock trading, candlestick patterns can be useful around earnings reports or major corporate announcements, as these events often trigger strong emotional responses from investors. Stock traders use candlestick patterns to identify shifts in market sentiment, helping them anticipate where price might move next. Patterns tend to hold more significance when they’re formed at critical levels like key support, resistance, or alongside notable changes in trading volume.
Futures
Futures contracts cover commodities, indices, and more – each heavily influenced by supply and demand factors. Because these markets often have high liquidity and clear price movements, candlestick patterns regularly offer straightforward signals about possible price direction.
Futures traders trust patterns formed after significant price moves, looking for signs of reversals or continuation. Checking patterns against market fundamentals, such as inventory reports for commodities, can add extra reliability.
Options
Timing and price direction matter significantly for options traders. Candlestick patterns help options traders make more precise predictions about potential market direction or volatility changes. Identifying a bullish or bearish candlestick pattern in the underlying asset can be useful in deciding whether to buy call or put options. Combining patterns with implied volatility data or simple volatility indicators enhances their effectiveness in the options market.
CFDs
CFD traders focus on short-term price movements across various assets like indices, forex, commodities, or individual stocks. Because CFDs involve leveraged trades, accuracy and timing are critical.
Candlestick patterns help CFD traders quickly spot turning points or continued trends. When used together with basic technical tools such as moving averages, support/resistance levels, or momentum indicators, candlestick patterns become even more practical and reliable for trading CFDs effectively.
Why Do Candlestick Patterns Matter In The Market?
Candlestick patterns matter in trading because they’re one of the clearest ways to visualize the collective psychology and behavior of traders. When a well-known candlestick pattern forms on a chart, thousands of traders notice and react simultaneously, often leading to predictable price movements. Essentially, the more traders who see and respond to the same signal, the stronger and more reliable that signal becomes in influencing price direction.
Moreover, candlestick patterns simplify market analysis, making it easier for traders to quickly grasp market sentiment without needing complex indicators or advanced analysis. They provide immediate visual cues about potential shifts in buying or selling pressure, helping traders anticipate where prices might head next. Because these patterns are universally recognized, from institutional investors to retail traders, they remain consistently effective across all markets and timeframes.
Mastering Candlestick Trading with WR Trading Mentoring
At WR Trading Mentoring Academy, many new traders have enjoyed the expertise of professional traders since 2012. They gain access to comprehensive resources tailored to candlestick trading. The academy offers tutorials covering market techniques, analysis methods, and risk management strategies.
It also emphasizes practical application and community support. So, by mastering candlestick trading with WR Trading Mentoring Academy, traders become equipped with the knowledge and tools they need to succeed.
(Learn To Trade And Read Candlestick Patterns Like A Pro)
Frequently asked questions on Candlestick Patterns:
What Is the Most Accurate Candlestick Pattern?
The most accurate candlestick pattern varies depending on market conditions, but some widely recognized patterns include the bullish engulfing and bearish engulfing patterns.
Do Candlestick Patterns Really Work?
Yes, candlestick patterns have been observed to work effectively in predicting price movements. However, they have limitations and should be used with other technical analysis tools.
Do Professional Traders Use Candlestick Patterns?
Yes, many professional traders incorporate candlestick patterns into their trading strategies as part of their technical analysis.
How Do You Master Candlestick Patterns?
To master candlestick patterns, traders should study and practice recognizing different patterns and understanding their interpretations. They should also continuously refine their skills.
How Do You Predict the Next Candlestick?
Predicting the next candlestick involves analyzing the current market context, identifying patterns, considering support and resistance levels, and assessing other technical indicators for confirmation.
Can I Trade Without Candlestick?
Yes, traders can use alternative methods of technical analysis or rely solely on fundamental analysis to make trading decisions without using candlestick patterns.

