The foreign exchange market is the world’s largest and most liquid financial market, exceeding $7.5 trillion in daily transactions. At WR Trading, we want to present you mind-blowing facts like these to showcase the impact of forex on the global economy and how traders navigate this massive financial ecosystem. We’ll break down 20 fascinating forex statistics that might change the way you view the forex market.
20 Forex Statistics at a glance:
- The forex market has grown to over $7.5 trillion in daily volume since 2001.
- The U.S. dollar is involved in 88% of all FX trades.
- The Russian ruble’s trading share dropped below 0.5% in 2022.
- A record $19.1 trillion was traded in a single day on June 20, 2024.
- 2019–2022 saw the slowest FX market growth (+14%) since 2004.
- FX swaps account for 51% of global forex turnover.
- 94% of forex trading is between financial institutions; only ~6% involves non-financial customers.
- After the USD, the most traded currencies are EUR (31%), JPY (17%), and GBP (13%).
- China’s renminbi reached 7% of global FX trading in 2022 – now 5th most traded.
- EUR/USD is the most traded currency pair, making up 23% of global FX volume.
- Five trading hubs (UK, US, Singapore, Hong Kong, Japan) handle 78% of all FX volume.
- 62% of forex transactions are cross-border; 38% are domestic.
- Global FX reserves exceeded $12 trillion in 2023.
- USD’s share of global reserves fell to 59%; the euro holds ~20%.
- 54% of global trade is invoiced in U.S. dollars.
- The top 10 currencies make up ~90% of all FX trading.
- India’s rupee is the 2nd most traded emerging market currency (1.6% share).
- The Australian dollar dropped to 6th place in global FX rankings.
- Switzerland trades $390 billion in forex daily – 5.2% of global volume.
- Japan’s $42.8 billion yen-buying in Oct 2022 was its largest-ever FX intervention.

(Never Trade In Uncertainty Again – Join The WR Trading Mentorship)
1. Forex Trading Volume Has Grown Sixfold Since 2001
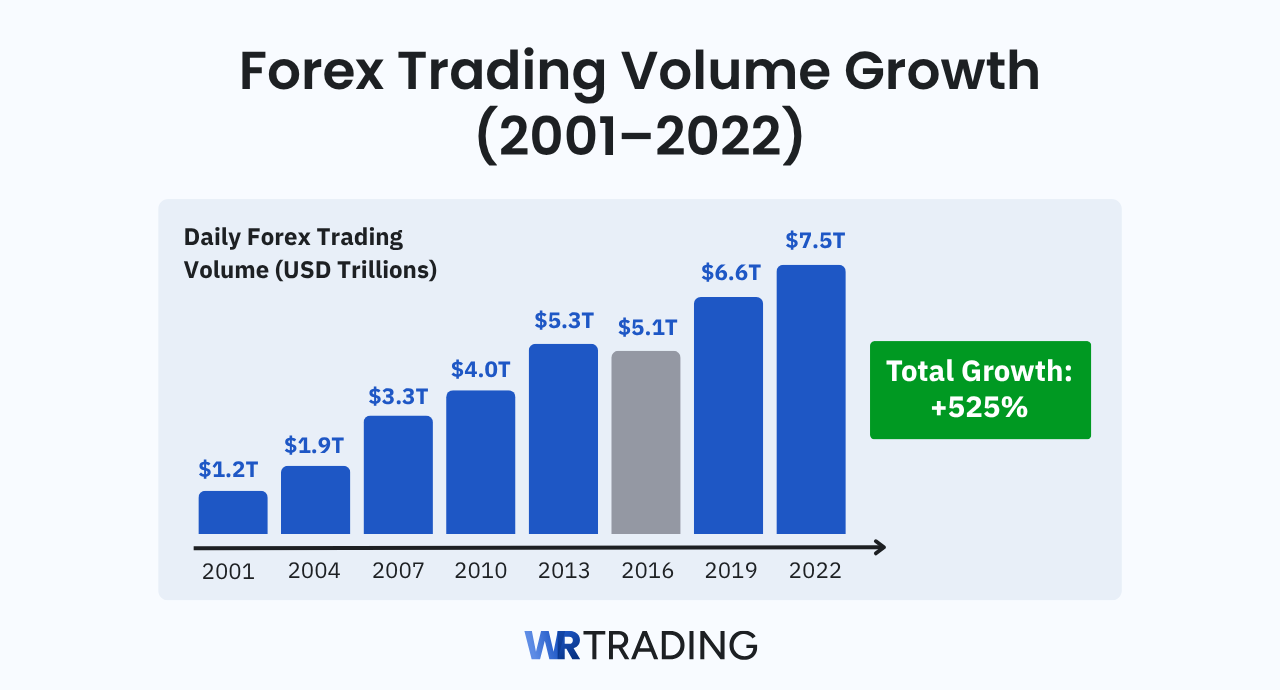
The forex market size has grown rapidly over the past few decades. In 2001, the average daily turnover was around $1.2 trillion; by 2007, it reached $3.3 trillion, and by 2013, it was $5.3 trillion. Despite a brief dip in 2016, volumes surged again in the following years. The table below shows the global average daily FX turnover at various points in time, as reported by BIS surveys:
| Year | Daily Forex Trading Volume |
|---|---|
| 2001 | $1.2 Trillion |
| 2004 | $1.9 Trillion |
| 2007 | $3.3 Trillion |
| 2010 | $4.0 Trillion |
| 2013 | $5.3 Trillion |
| 2016 | $5.1 Trillion |
| 2019 | $6.6 Trillion |
| 2022 | $7.5 Trillion |
https://www.bis.org/statistics/rpfx22_fx.htm
https://www.moneyandbanking.com/commentary/2019/12/15/foreign-exchange-trading-2019-edition
2. The US Dollar Is Involved in 88% of All FX Trades
The U.S. dollar (USD) remains the top currency globally, with the BIS reporting that the dollar was on one side of 88% of all currency trades in 2022, unchanged from its share in 2019. In other words, nearly every major forex transaction involves exchanging USD for another currency.
This extends the dollar’s dominance that has persisted for decades – by comparison, a decade earlier, the USD was involved in about 85% of trades, and no other currency comes close to this level of market dominance.
| Year | U.S. Dollar Share of Global FX Trades |
|---|---|
| 2010 | 85% |
| 2019 | 88% |
| 2022 | 88% |
3. Russian Ruble’s Trading Share Plunges Below 1%
The role of the Russian ruble (RUB) in global FX trading has diminished to negligible levels after Russia’s invasion of Ukraine in 2022. In the 2019 BIS survey, the ruble accounted for around 1% of worldwide FX turnover. By 2022, the ruble was effectively excluded from the BIS results – Russia’s central bank did not participate due to sanctions and BIS membership suspension, and ruble trading was minimal on sanctioned institutions.
Even prior to 2022, the RUB was a minor currency internationally (ranked around 18th in 2019). The war and financial sanctions imposed on Russia, such as exclusion from SWIFT for some banks and convertibility restrictions, caused ruble trading with global counterparties to dry up further. This means the ruble is now mostly traded onshore or within a limited network.
| Currency | Share of Global FX Trades (2019) | Share (2022) |
|---|---|---|
| Russian Ruble (RUB) | 1.1% (approx.) | <0.5% |
https://www.reuters.com/markets/us/global-fx-trading-hits-record-75-trln-day-bis-survey-2022-10-27
4. Record $19.1 Trillion Traded in a Single Day
Forex trading volumes can spike during periods of market stress or major events. A testament to this is the record $19.1 trillion traded in a single day on 20 June 2024, reported by CLS, the FX settlement provider. That astonishing figure is over two and a half times the normal daily average of around $7 trillion for CLS.
It occurred primarily due to the U.S. market’s shift to a T+1 (trade plus one day) securities settlement cycle, effective from May 28, 2024. This transition forced financial institutions, asset managers, and market participants to significantly increase FX transactions, as they needed to align currency exchanges with the shortened settlement window for U.S. securities trades.
| Date | Daily FX Settlement Value |
|---|---|
| 20th June 2024 | $19.1 trillion |
| Average 2024 day | $7 trillion |
(Never Trade In Uncertainty Again – Join The WR Trading Mentorship)
5. Slowest Growth in FX Turnover Since 2004
Global FX turnover grew 14% from 2019 to 2022, rising from $6.6 trillion to $7.5 trillion in daily volume. While still a sizable increase, the BIS noted this was the slowest growth rate for a triennial survey period since 2004. Only two survey periods since 2004 saw similarly low growth, and one period (2013–2016) even saw a slight decline. By contrast, the prior 2016–2019 interval had nearly a 30% jump in volume.
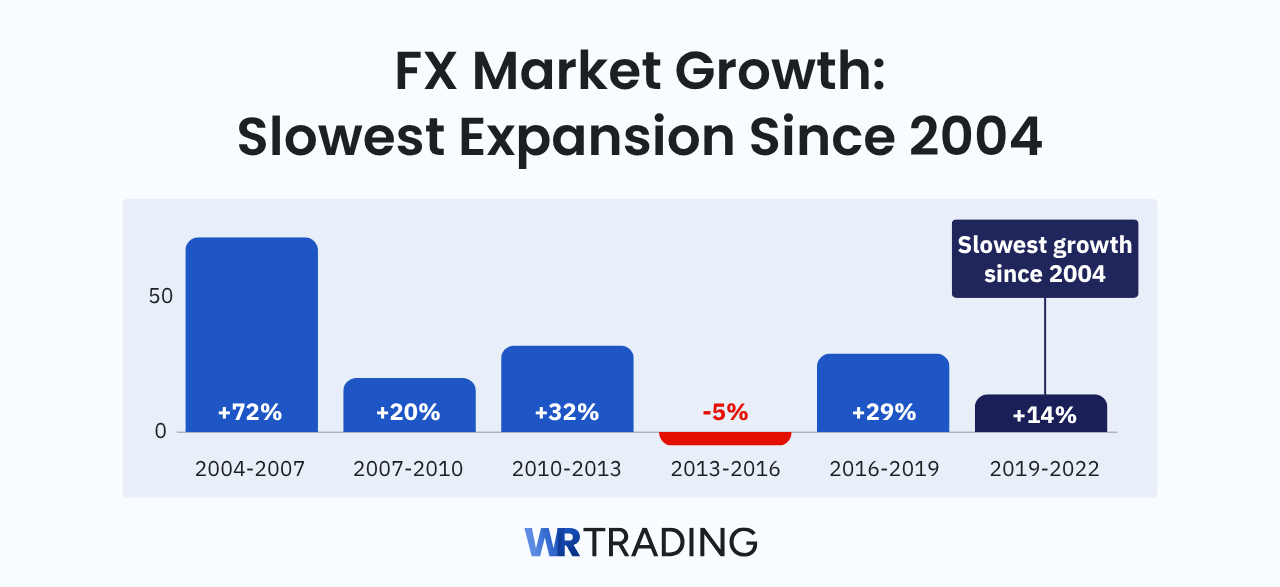
Several factors contributed to the muted growth in FX trading. The 2019–2022 data collection coincided with heightened market volatility from shifting interest rate expectations, surging commodity prices, and geopolitical tensions (such as the war in Ukraine). Normally, volatility can boost trading, but pandemic-related restrictions in some financial centers may have dampened activity. The slowdown suggests that after decades of rapid expansion, the FX market is maturing, with growth spurts now more tempered except during major upheavals.
| Period | 3-Year Growth in FX Volume |
|---|---|
| 2004–2007 | +72% |
| 2007–2010 | +20% |
| 2010–2013 | +32% |
| 2013–2016 | –5% |
| 2016–2019 | +29% |
| 2019–2022 | +14% |
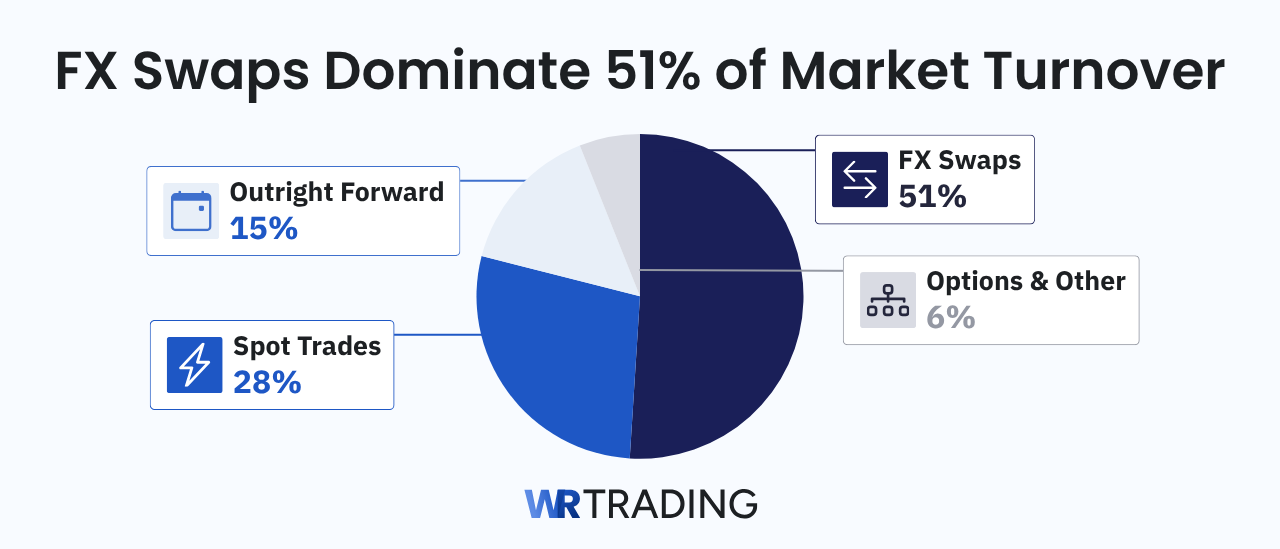
6. FX Swaps Dominate 51% of Market Turnover
Foreign exchange swaps are the most traded instrument in the FX market, accounting for 51% of global turnover in 2022. FX swaps involve an exchange of two currencies with a promise to reverse the exchange at a later date, and they are commonly used by banks and companies to manage short-term funding or hedge currency exposure.
| Instrument | Daily Turnover (Apr 2022) | Share of Global FX Volume (2022) |
|---|---|---|
| FX Swaps | $3.8 trillion | 51% |
| Spot Trades | $2.1 trillion | 28% |
| Outright Forwards | $1.2 trillion | 15% |
| Options & Other | $0.4 trillion | 6% |
7. Interbank Trading vs. Other Counterparties
The FX market has a diverse set of participants, but the majority of volume occurs among financial institutions. In April 2022, about 46% of global FX turnover was inter-dealer – trading directly between reporting dealer banks. Another 48% was between dealers and “other financial institutions,” a category that includes asset managers, hedge funds, proprietary trading firms, and institutional investors.
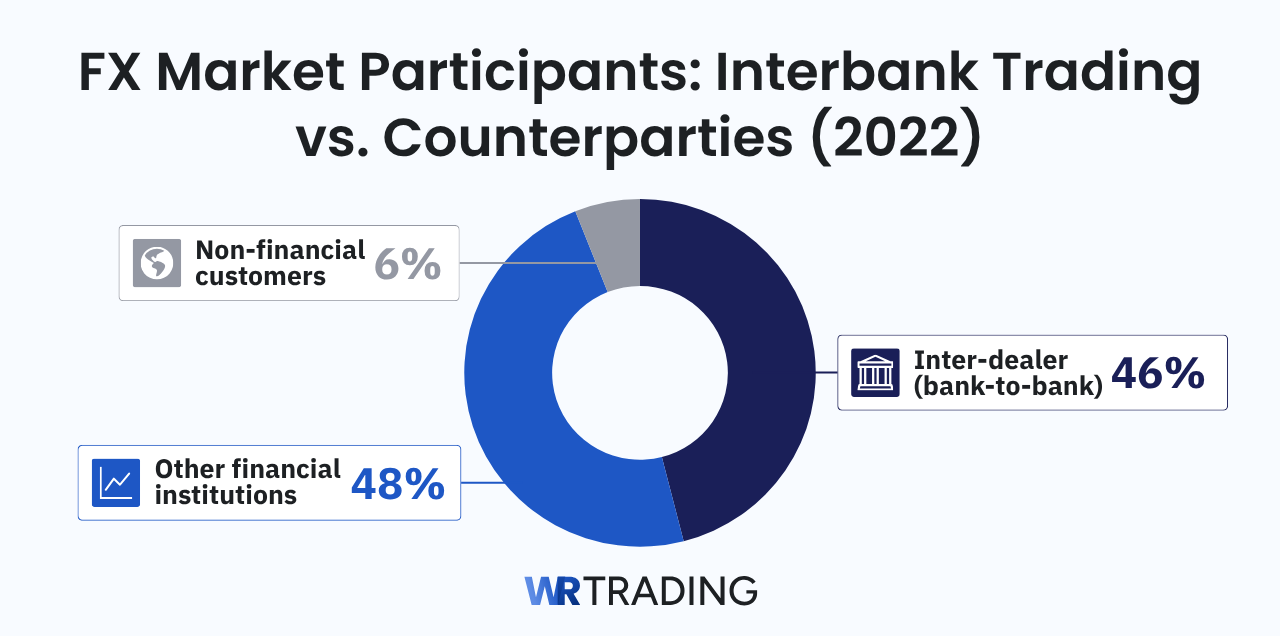
Trades involving non-financial customers (such as corporations, importers/exporters, and governments conducting real-economy currency exchanges) accounted for the remaining ~6% of turnover. This small slice highlights that FX trading is largely a wholesale market, with corporate trade-related currency conversions being only a minor portion of daily volume.
Most FX activity is driven by banks and investors reallocating portfolios or hedging financial exposures rather than by companies buying/selling currency for commerce. Even so, the interbank market ultimately exists to facilitate those end-user needs and global capital flows.
| Counterparty | Share of FX Turnover (2022) |
|---|---|
| Inter-dealer (bank-to-bank) | 46% |
| Other financial institutions | 48% |
| Non-financial customers | ~6% (remainder) |
8. Euro, Yen, and Pound are the Next Most Traded Currencies
After the U.S. dollar, the euro (EUR) is the second most traded currency, appearing in about 31% of global transactions as of 2022. The euro’s share dipped slightly from 32% in 2019, showing marginally lower activity, but it firmly remains the runner-up in worldwide usage.
Following the euro, the Japanese yen (JPY) and British pound (GBP) are the third and fourth most traded currencies. In 2022, the yen was involved in 17% of trades and the pound in 13%, both unchanged from their shares in 2019. These rankings have stayed consistent over time, with USD, EUR, JPY, and GBP collectively forming the core of major currency pairs.
| Currency | Share of Global FX Trades (2019) | Share (2022) |
|---|---|---|
| Euro (EUR) | 32% | 31% |
| Japanese Yen (JPY) | 17% | 17% |
| British Pound (GBP) | 13% | 13% |
(Never Trade In Uncertainty Again – Join The WR Trading Mentorship)
9. China’s Renminbi Climbs to 7% of FX Trading
The Chinese renminbi (RMB or CNY) has rapidly risen through the currency ranks. In 2022, the RMB accounted for 7% of global FX trading, making it the 5th most traded currency worldwide. This is a significant jump from just a 4% share in 2019. A decade ago, the renminbi was barely 1% of turnover and outside the top ten, but its share has roughly doubled with each triennial BIS survey.
The RMB’s ascent reflects China’s growing economic footprint and efforts to internationalize its currency. This trend was the largest market share gain by any currency between 2019 and 2022. The renminbi’s rise has come as China gradually loosens capital controls, more trade is settled in RMB, and global investors increase exposure to Chinese markets. In 2016, the RMB was added to the IMF’s Special Drawing Rights basket, cementing its status as a major reserve currency.
| Year | Renminbi (CNY) Share of Global FX Trades | Global Rank |
|---|---|---|
| 2010 | 0.9% | 17th |
| 2019 | 4.3% | 8th |
| 2022 | 7.0% | 5th |
10. EUR/USD is the Most Traded Currency Pair (23% of Volume)
The euro/U.S. dollar (EUR/USD) pair is the world’s most actively traded currency pair, constituting about 22–23% of global FX turnover in 2022. Nearly one out of every four dollars traded in the FX market is exchanged between euros and U.S. dollars.
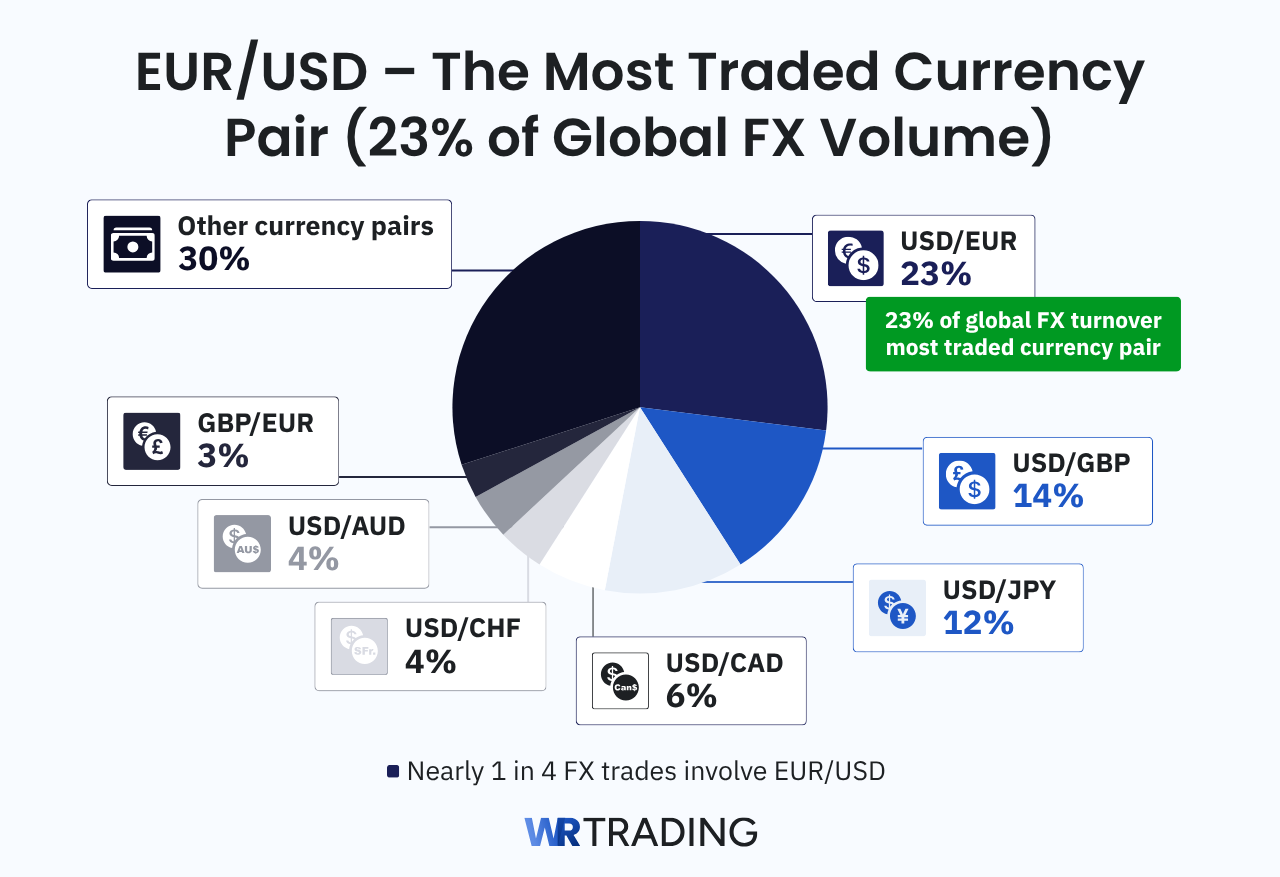
This shows the huge volume of commerce and capital flows between the Eurozone and the United States, as well as the pair’s popularity for speculation due to its liquidity and relatively low transaction costs. EUR/USD has long held the top spot among currency pairs, given that it links the two largest currencies.
| Currency Pair | Share of Global FX Turnover (2022) |
|---|---|
| EUR/USD (Euro – U.S. Dollar) | 23% |
| USD/JPY (U.S. Dollar – Yen) | 17% |
| GBP/USD (British Pound – U.S. Dollar) | 10% |
| USD/CNY (U.S. Dollar – Chinese Yuan) | 7% |
| USD/JPY (U.S. Dollar – Japanese Yen) | 7% |
https://www.bankofengland.co.uk/-/media/boe/files/statistics/bis-survey/2022/summary-of-uk-survey-results-2022.pdf
https://www.bis.org/publ/qtrpdf/r_qt2406b.htm
11. Five Major Hubs Handle 78% of FX Trading
The United Kingdom, the United States, Singapore, Hong Kong, and Japan collectively accounted for about 78% of total FX trading in 2022. The UK alone made up 38% of the global turnover in April 2022, maintaining London’s position as the world’s largest FX trading hub.
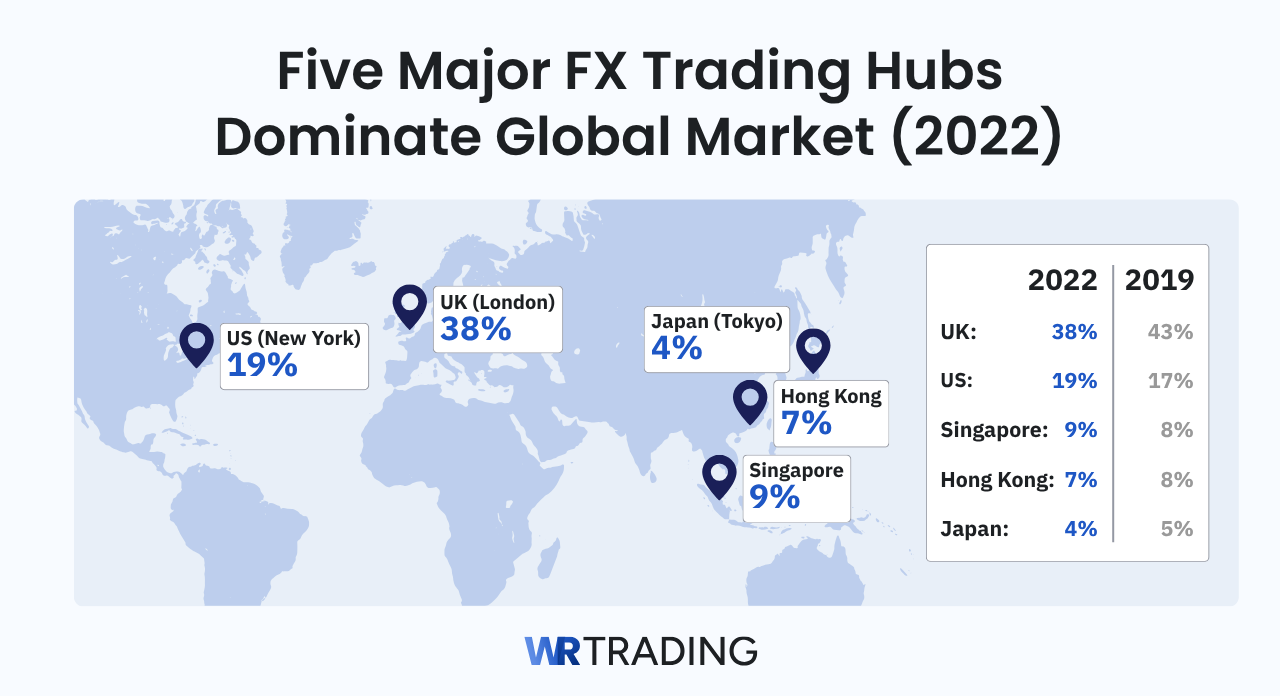
The U.S. was the second-largest center at 19%. Asia’s biggest venues, Singapore and Hong Kong, each have around 7–9%, and Tokyo, Japan, had roughly 4%. This geographic distribution has remained fairly stable, though the U.S. and Singapore gained shares in 2022 while London and Hong Kong saw slight declines from 2019.
| Trading Center | Share of Global FX Volume 2022 | Share of Global FX Volume 2019 |
|---|---|---|
| United Kingdom (London) | 38% | 43% |
| United States (New York) | 19% | 17% |
| Singapore | 9% | 8% |
| Hong Kong SAR | 7% | 8% |
| Japan (Tokyo) | 4% | 5% |
| Combined Top 5 | 78% | 81% |
https://www.bis.org/statistics/rpfx22_fx.htm
https://www.reuters.com/markets/us/global-fx-trading-hits-record-75-trln-day-bis-survey-2022-10-27
12. Cross-Border Transactions Make Up 62% of FX Volume
The FX market is inherently global – most trades involve participants in different countries. In April 2022, 62% of all forex transactions were cross-border, up from 56% in 2019. The remaining ~38% of trades were between counterparties in the same country. The increase in cross-border shares brings it closer to the levels seen in 2016 (around 65%), indicating the internationalization of trading rebounded after a dip in 2019.
| Type of Trade | Share of Total Trades in 2022 |
|---|---|
| Cross-border trades | 62% |
| Local (domestic) trades | 38% |
13. Global Foreign Exchange Reserves Exceed $12 Trillion
Central banks worldwide collectively hold an enormous stockpile of foreign currencies as official foreign exchange reserves, totaling about $12 trillion as of 2023. Global FX reserves have grown tenfold in the past two decades – from roughly $1.2 trillion in 1999 (just after the euro’s introduction) to over $12 trillion today.
These reserves are held to back national currencies, stabilize exchange rates, and provide liquidity in times of crisis. The record high was $12.92 trillion in Q4 2021 before slight declines due to valuation changes and some reserves being used for currency interventions.
| Year | Total World FX Reserves |
|---|---|
| 1999 | $1.2 trillion |
| 2021 | $12.9 trillion |
| 2023 | $12.1 trillion |
https://www.reuters.com/markets/currencies/us-dollar-share-global-fx-reserves-stays-flat-q2-imf-2023-09-29
https://benjaminbraun.org/posts/treasury-holdings
(Never Trade In Uncertainty Again – Join The WR Trading Mentorship)
14. USD Share of Global Reserves Falls to 59%, Euro ~20%
Although the U.S. dollar dominates FX trading, its position in central bank reserves has gradually declined. The USD accounted for 59% of allocated global foreign exchange reserves in 2020, the lowest share in 25 years. Back in 1999, the dollar comprised 71% of reserves; since then, it has fallen about 12 percentage points.
This drop has not been matched by a surge in any single alternative – the euro’s share has hovered around 20% of global reserves (it was about 18% in 1999 and 20% in 2020). Other major currencies like the Japanese yen and British pound make up small single-digit portions each around 5% each in recent years, while the remainder consists of “nontraditional” reserve currencies such as the Canadian and Australian dollars, which together have grown to around 9–10% of reserves.
| Currency | % of Official FX Reserve 2020 |
|---|---|
| US Dollar (USD) | 59% |
| Euro (EUR) | ~20% |
| Others – Japanese Yen, Pound, etc. | ~21% |
https://www.reuters.com/markets/currencies/us-dollar-share-global-fx-reserves-stays-flat-q2-imf-2023-09-29
https://www.imf.org/en/Blogs/Articles/2021/05/05/blog-us-dollar-share-of-global-foreign-exchange-reserves-drops-to-25-year-low
15. 54% of Global Trade Invoiced in U.S. Dollars
As of 2022, roughly 54% of global trade transactions are invoiced in USD. This means over half of world exports/imports by value are billed and settled in dollars, even if the U.S. is not directly involved in the transaction.
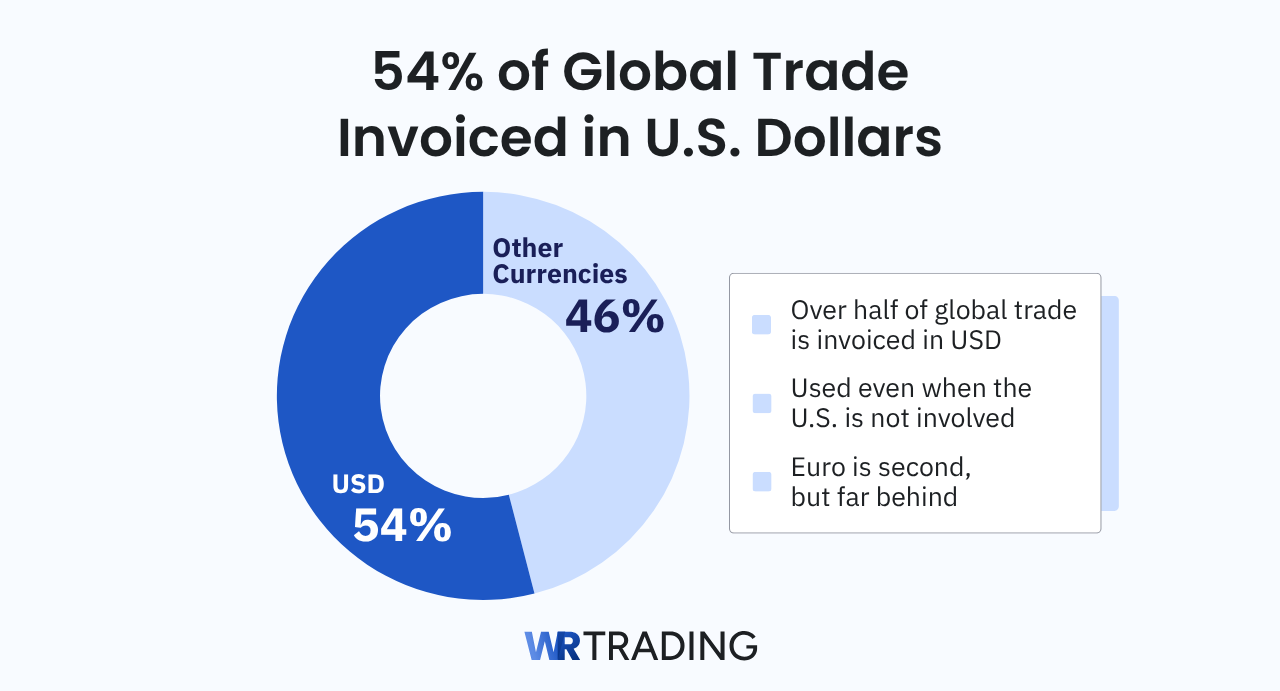
For example, a sale of machinery from Germany to India might be priced in USD. The euro is the second most common invoicing currency (especially within Europe and certain trade networks), but no single currency approaches the dollar’s usage globally. The fact that the dollar is used for a majority of trade invoices highlights its role as the de facto language of commerce.
| Currency used for Trade Invoicing | Share of World Trade |
|---|---|
| US Dollar (USD) | 54% |
| Other currencies (combined) | 46% |
16. Just 10 Currencies Account for ~90% of All FX Trading
Hundreds of currencies exist in the world, but the FX market is overwhelmingly concentrated in a handful of major ones. The top 10 currencies collectively are on about 89–90% of all forex trades. The U.S. dollar is the top currency – being one side of 88% of trades – followed by the euro, Japanese yen, British pound, Chinese renminbi, Australian dollar, Canadian dollar, Swiss franc, Hong Kong dollar, and Singapore dollar. After these ten, each additional currency contributes well under 2% of the global volume.
| Rank (2022) | Currency | % of Global FX |
|---|---|---|
| 1. | USD (U.S. dollar) | 88.5% |
| 2. | EUR (Euro) | 30.5% |
| 3. | JPY (Japanese yen) | 16.7% |
| 4. | GBP (British pound) | 12.9% |
| 5. | CNY (Chinese yuan) | 7.0% |
| 6. | AUD (Australian Dollar) | 6.4% |
| 7. | CAD (Canadian Dollar) | 6.2% |
| 8. | CHF (Swiss franc) | 5.2% |
| 9. | HKD (Hong Kong Dollar) | 2.6% |
| 10. | SGD (Singapore Dollar) | 2.4% |
17. Indian Rupee – 2nd Most Traded EM Currency
India’s currency, the rupee (INR), has become the 15th most traded currency worldwide as of 2022, with about 1.6% of global FX turnover. This makes it the second most traded emerging market currency after China’s yuan. Its rise reflects India’s growing economic footprint and the increasing interest of foreign investors in rupee assets.
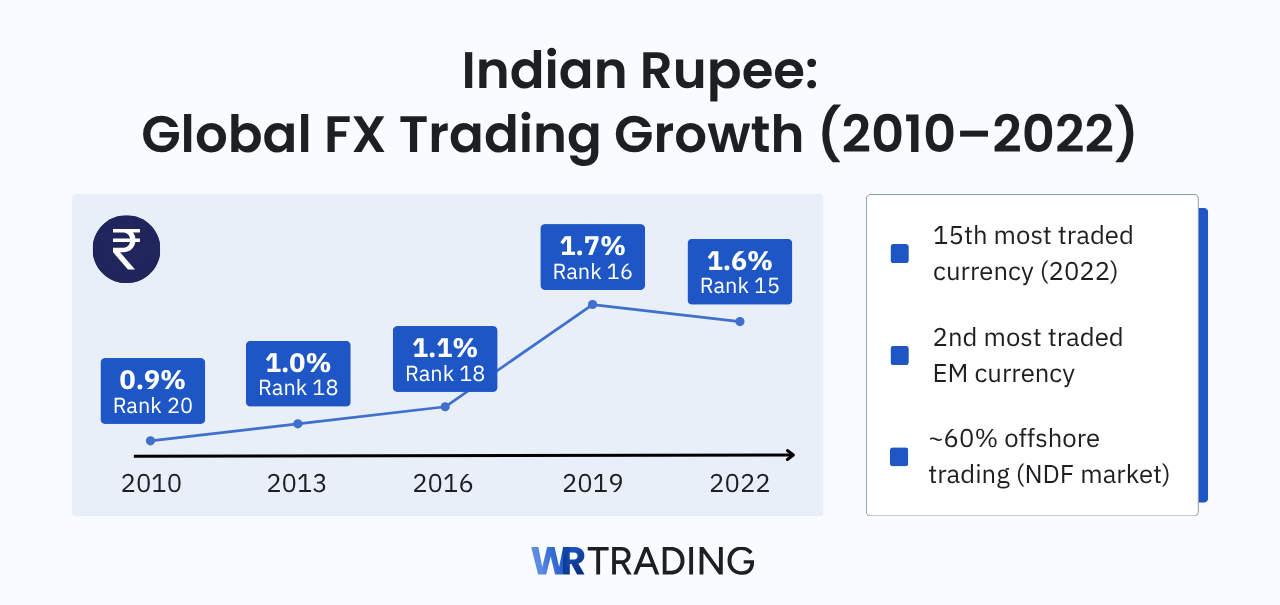
Due to India’s capital controls, an active offshore NDF (non-deliverable forward) market for USD/INR has developed in financial hubs. By 2022, over 60% of rupee trading was occurring outside India, primarily via NDF contracts in centers such as London, Singapore, and New York. This means the bulk of rupee liquidity is offshore, where international banks and hedge funds trade the currency beyond the purview of Indian regulators.
| Year | INR Global Rank | INR Share of Global FX |
|---|---|---|
| 2010 | 20th | 0.9% |
| 2013 | 18th | 1% |
| 2016 | 18th | 1.1% |
| 2019 | 16th | 1.7% |
| 2022 | 15th | 1.6% |
https://www.bis.org/statistics/rpfx22_fx.pdf#page=14
https://en.wikipedia.org/wiki/Template:Most_traded_currencies
https://www.elibrary.imf.org/view/journals/001/2024/236/article-A001-en.xml
18. Australian Dollar Slips to 6th – Surpassed by Chinese Yuan
The Australian dollar (AUD) has long been among the top five most-traded currencies, but in 2022, it was overtaken by China’s renminbi. The AUD fell to the 6th most traded currency globally, with about a 6% share of daily FX turnover. This is a slight decline from its ~6.8% share in 2019.
The Reserve Bank of Australia noted that the AUD’s share “declined slightly”, and its ranking dropped from 5th to 6th in the latest survey. The currency pair AUD/USD also slipped in rank – it was the 4th most traded pair in 2019 but was 6th in 2022. These changes are largely due to the rise of China’s yuan, which climbed into the top five.
| Year | AUD Global Rank | Share of Global FX |
|---|---|---|
| 2010 | 5th | 7.6% |
| 2013 | 5th | 8.6% |
| 2016 | 5th | 6.9% |
| 2019 | 5th | 6.8% |
| 2022 | 6th | 6.0% |
19. Switzerland Trades $390 Billion/Day – 5.2% of Global FX Volume
Switzerland punches far above its weight in FX trading, with an average of $367 billion per day in foreign exchange turnover. That is about 5% of the global total, placing Switzerland among the top six trading centers worldwide after the UK, US, Singapore, Hong Kong, and Japan.
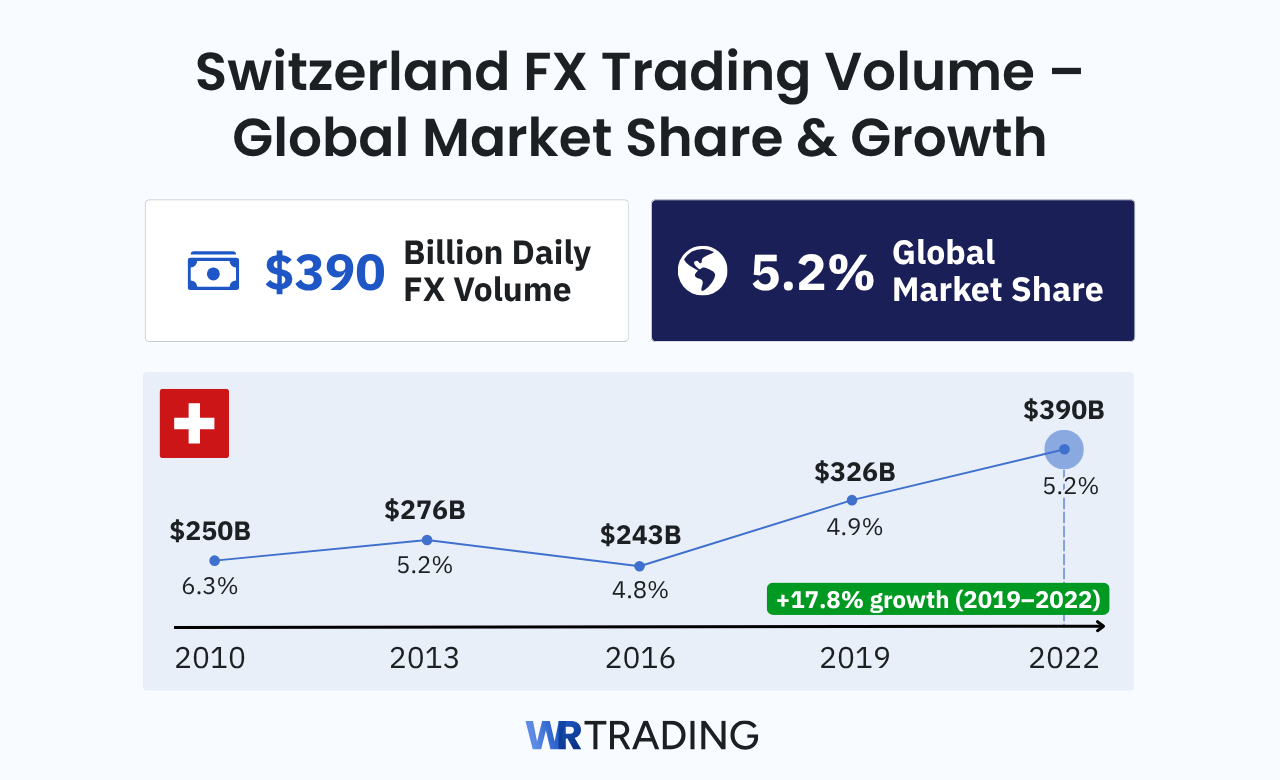
It’s remarkable given Switzerland’s small population of ~8.6 million and its economy of about 0.8% of world GDP. Zürich is the main FX hub in Switzerland, hosting many international banks’ trading desks and asset managers. The BIS 2022 survey confirmed the high volume: $390B daily, up from $326B in 2019 – a 17.8% jump.
| Year | Average Daily FX Turnover (USD billion) | Global Market Share % |
|---|---|---|
| 2010 | $250 | 6.3% |
| 2013 | $276 | 5.2% |
| 2016 | $243 | 4.8% |
| 2019 | $326 | 4.9% |
| 2022 | $390 | 5.2% |
20. Japan’s $42.8 Billion Intervention – Largest Ever in FX Markets
Japan conducted a historically massive intervention in 2022 to support its falling currency. On October 31st, 2022, the Bank of Japan, under the guidance of the Ministry of Finance, intervened by buying yen and selling U.S. dollars after the yen’s value had plunged to a 32-year low against the dollar.
Data later revealed that Japan spent ¥6.35 trillion yen over about two trading days, equivalent to $42.8 billion, in these interventions. This sum is the largest single-month and multi-day currency intervention on record for Japan and one of the largest ever seen in FX markets. It dwarfed Japan’s previous interventions – about $20B was spent in September 2022, and prior to 2022, Japan had not intervened in over a decade.
| Date | Japan’s Yen-Buying Intervention |
|---|---|
| Sep30th, 2022 | ~¥2.8 trillion (≈$19.5 billion) – first yen-buying in decades |
| Oct 31st, 2022 | ¥6.35 trillion (≈$42.8 billion) – record intervention |
https://www.reuters.com/markets/asia/japan-likely-spent-record-amount-october-prop-up-yen-2022-10-31
https://www.reuters.com/markets/asia/japan-confirm-size-yen-buying-intervention-eyes-size-war-chest-2022-09-30
Conclusion
The foreign exchange market remains the largest and most dynamic financial market in the world, with daily trading volumes exceeding $7.5 trillion. The statistics covered in this article reveal the sheer scale of FX trading, from the dominance of the U.S. dollar to the rise of emerging market currencies like the Chinese yuan.
Despite its size, the forex market is constantly evolving. Regulatory changes, economic shifts, and technological advancements influence its structure and trading behavior. Therefore, if you are looking to get into this ever-changing market, it’s a great idea to try out a beginner-friendly course like WR Trading. It covers everything you need to know, from basic trading knowledge to advanced proven strategies.
(Never Trade In Uncertainty Again – Join The WR Trading Mentorship)
FAQ: Most Asked Questions Regarding Forex Statistics
How Do We Verify the Sources for These Forex Statistics?
All statistics in this article are sourced from highly reputable financial institutions, including the Bank for International Settlements (BIS), International Monetary Fund (IMF), World Bank, and central banks like the Federal Reserve and European Central Bank. Each statistic is backed by publicly available reports, which are linked at the end of each section for transparency.
Why Is the U.S. Dollar Involved in Most Forex Trades?
The U.S. dollar serves as the global reserve currency, used in international trade, finance, and central bank reserves. Its stability, liquidity, and widespread acceptance make it the preferred currency for settlements worldwide.
Which Forex Trading Hub Handles the Most Transactions?
The United Kingdom (London) is the world’s largest forex trading hub, processing about 38% of global FX turnover. New York follows, with Singapore, Hong Kong, and Tokyo rounding out the top five.
What Are the Most Traded Currency Pairs in Forex?
The EUR/USD pair is the most traded, accounting for about 23% of total forex transactions. Other highly traded pairs include USD/JPY, GBP/USD, and USD/CNY, reflecting strong economic ties and liquidity between these currencies.
Why Do Some Currencies Trade More Offshore Than in Their Home Countries?
Certain currencies, such as the Indian rupee (INR) and the Chinese yuan (CNY), face capital controls that restrict their free exchange in domestic markets. As a result, large portions of their forex trading take place offshore, in financial hubs like London, Singapore, and New York, through non-deliverable forwards (NDFs) and other instruments.

