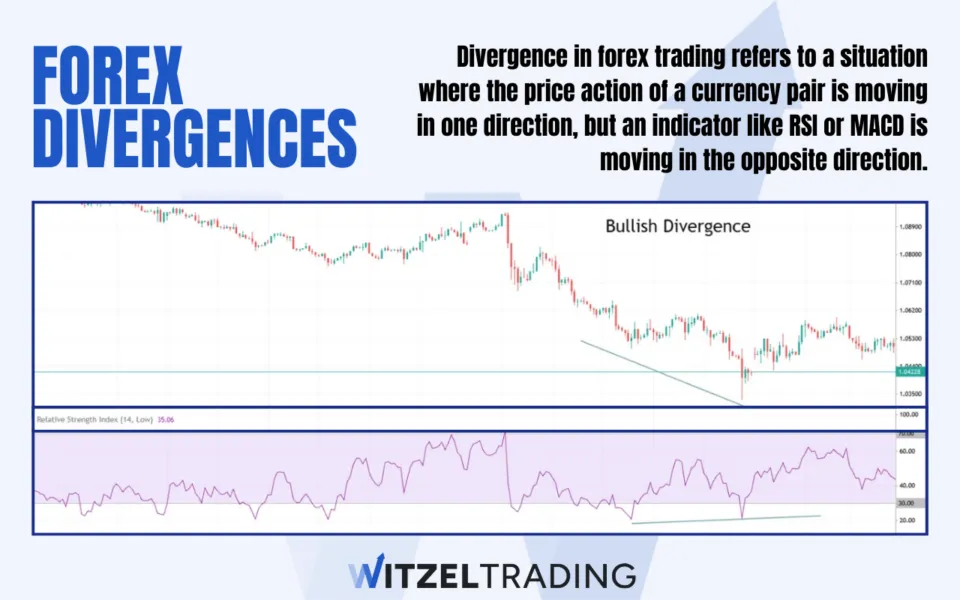
Divergence in forex trading refers to a situation where the price action of a currency pair is moving in one direction, but an indicator (the Relative Strength Index (RSI), the Moving Average Convergence Divergence (MACD), or the Stochastic Oscillator) is moving in the opposite direction.
This divergence between signals can give you an early warning that a potential trend reversals (or continuation) is looming. The three main types of divergence are bullish divergence, bearish divergence, and hidden divergence, and each serves a different purpose and can be used under different circumstances depending on your strategy.
Key Facts about Divergences
- Divergence indicates a potential trend reversal: Divergence serves as an early warning mechanism that the price is moving in one direction
- Three main types of divergence: Encounter bullish or bearish divergence, and hidden divergence in the markets
- Can be used on multiple timeframes: Divergence is particularly useful on all Timeframes
- Indicators for detecting divergence: Popular indicators include the RSI, MACD, Stochastic Oscillator, and CCI
- Divergence should always be combined with other analysis: Although divergence is powerful, it should not be traded in isolation
(Never Trade In Uncertainty Again – Join The WR Trading Mentorship)
What is a Divergence in Forex?
A divergence in forex occurs when the price of a currency pair and an indicator (typically an oscillator) move in opposite directions. This discrepancy creates a signal that tells you that the current price trend might be losing steam, and that a reversal might soon happen.
The reason why divergences can be a powerful tool in trading, is because they often indicate price movements before they actually occur. Divergences are categorized into three types:
- Bullish divergence: This occurs when the price of the currency pair makes a lower low, but the indicator forms a higher low (this suggests that although the price is still falling, the selling pressure is decreasing, which may lead to an upward reversal).
- Bearish divergence: A bearish divergence happens when the price forms higher highs, but the indicator makes lower highs. This indicates weakening bullish momentum and can signal that a price drop is imminent.
- Hidden divergence: This occurs in the direction of the prevailing trend and signals continuation. In an uptrend, it appears as a higher low in price, but a lower low in the indicator. Conversely, in a downtrend, a higher high in price but a lower high in the indicator can signal that the trend is likely to continue.
Each type of divergence can give you unique insights into the market, and understanding how to recognize and trade them is a critical skill that will boost your overall success rate in forex trading.
Example of a Bullish Forex Divergence
Imagine that the EUR/USD pair is in a downtrend. The price drops to a new lower low, but the RSI indicator forms a higher low during this period.
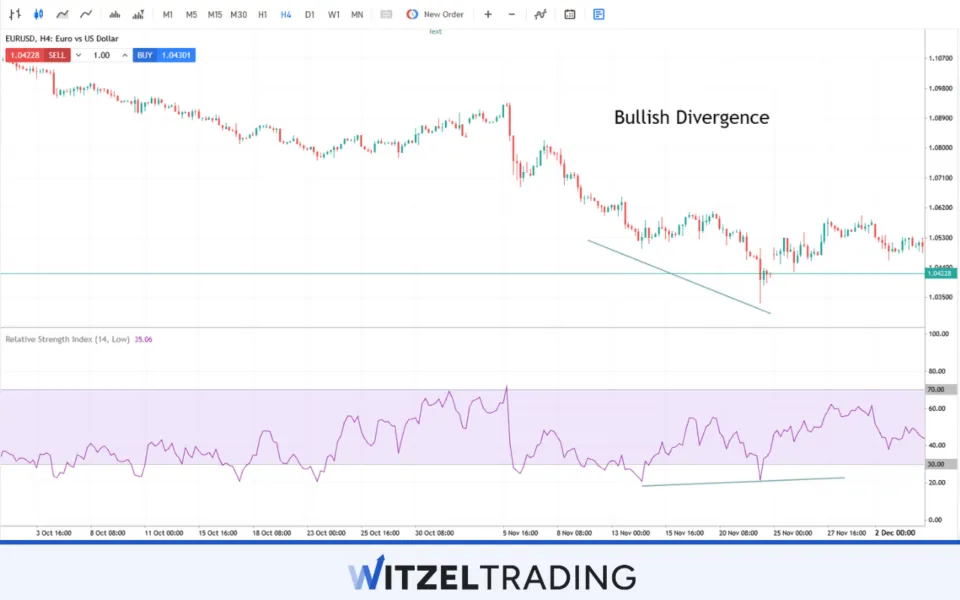
This creates a bullish divergence and suggests that the downward trend is losing momentum, meaning that you might look to enter a buy position in anticipation of a reversal.
Steps to trade a Bullish Divergence:
1. Identify lower lows in price: The first step is to spot the lower lows in price.
2. Check the indicator: Look at the corresponding oscillator, such as the RSI, and check if it’s forming higher lows during this same period.
3. Confirm the reversal: Wait for price action to break above the previous high to confirm that the reversal is in motion.
4. Enter the market: Once confirmation is in place, you’ll open a buy position.
5. Place a stop-loss: Protect your position by placing a stop loss below the most recent low.
A bullish divergence is a signal that the price of a currency pair is showing weakening downward momentum, and that the market could be preparing for an upward reversal.
It happens when the price forms a lower low, but the indicator (such as the RSI) forms a higher low, suggesting that despite the price continuing to decline, buying interest is starting to outweigh selling pressure.
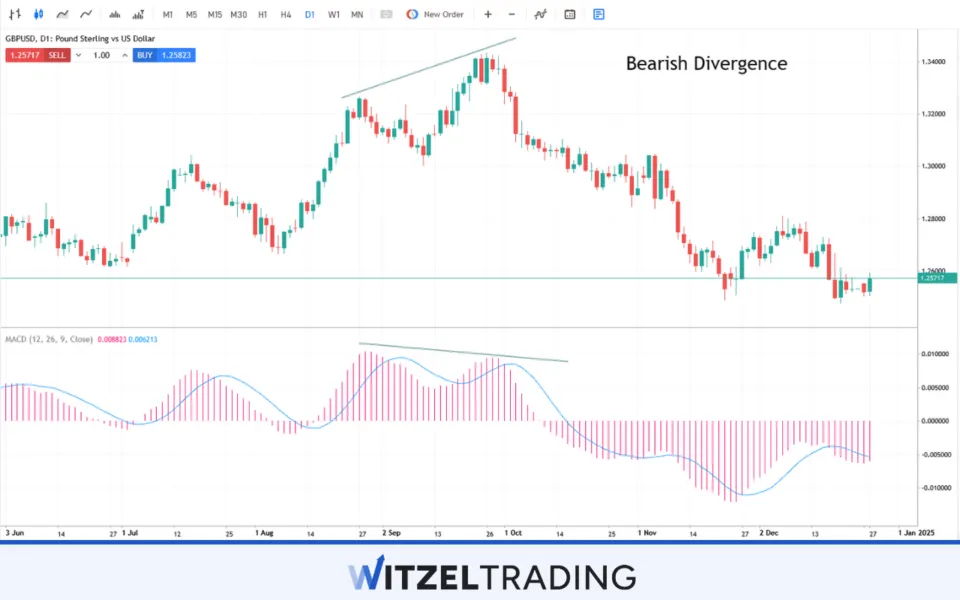
Example of a Bearish Forex Divergence
Let’s say the GBP/USD pair is in an uptrend, and the price reaches a new higher high.
However, when you check the MACD, you notice that it has formed a lower high during this same period.

This discrepancy creates a bearish divergence, signaling that the market may soon turn lower, ending the uptrend.
(Never Trade In Uncertainty Again – Join The WR Trading Mentorship)
Steps to trade a Bearish Divergence:
1. Identify higher highs in price: Look for the price forming higher highs as a preliminary sign.
2. Check the indicator: Verify that your chosen indicator is making lower highs during this same period.
3. Look for confirmation: Wait for the price to break below the previous low to confirm the reversal.
4. Enter the market: Open a sell position after confirmation.
5. Place a stop-loss: Always protect your position by placing a stop-loss above the most recent high.
A bearish divergence signals that an uptrend is weakening, and that a potential reversal to the downside may occur.
It takes place when the price of a currency pair forms higher highs, but the indicator (like MACD) forms lower highs, showing that although the price is rising, buying momentum is in fact waning.
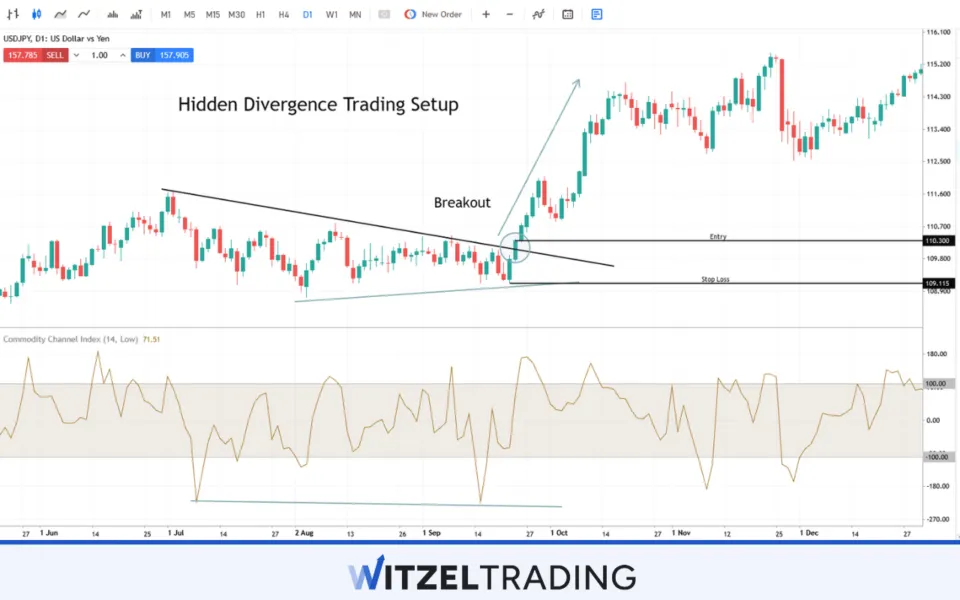
Example of a Hidden Forex Divergence
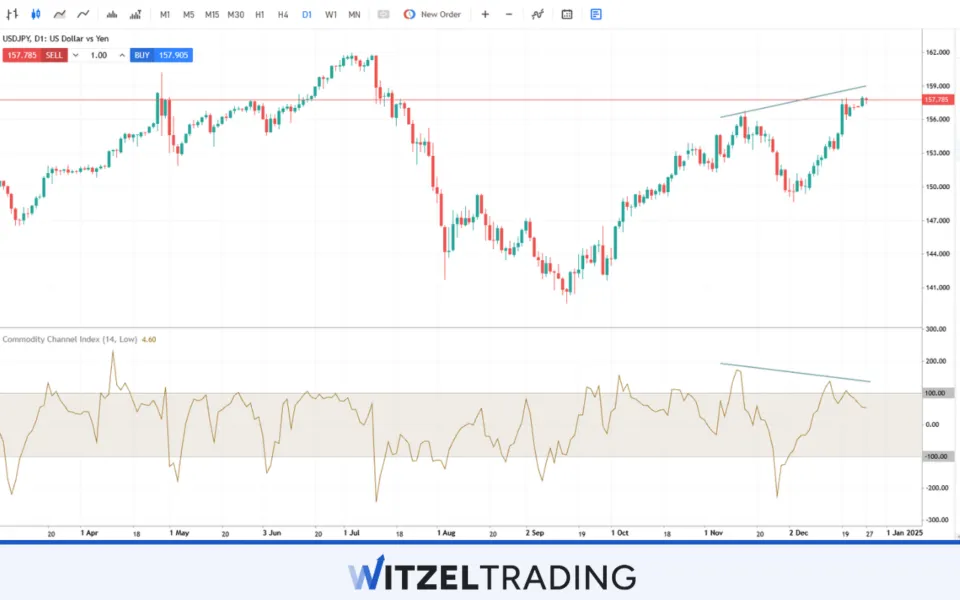
Suppose the USD/JPY pair is in a strong uptrend, and the price forms a higher low. However, the RSI forms a lower low during the same period.
In this example, this creates a bullish hidden divergence, suggesting that the uptrend will likely continue.
Steps to trade Hidden Divergence:
1. Identify the prevailing trend. Check if the market is in a strong uptrend or downtrend.
2. Spot the divergence. Look for a higher low (in an uptrend) or lower high (in a downtrend) in the price, while the indicator forms the opposite.
3. Trade with the trend. Since hidden divergence signals trend continuation, trade in the direction of the prevailing trend.
4. Enter the market. Open a buy position (in an uptrend) or sell position (in a downtrend).
5. Place a stop-loss. Set a stop loss at a level that protects your position from unnecessary risk.
Hidden divergence occurs in the direction of the prevailing trend and is used as a signal that the trend will likely continue.
In an uptrend, it appears when the price makes a higher low but the indicator forms a lower low. In a downtrend, it shows as a lower high in price but a higher high in the indicator.
(Never Trade In Uncertainty Again – Join The WR Trading Mentorship)
How to Trade Forex Divergences
The process of trading divergences is methodical and requires that you pay attention to details.
Here are the main steps to follow when trading divergences in the forex market:
1. Spot the divergence: Identify the type of divergence (bullish, bearish, or hidden) on your chart (look for discrepancies between price and the indicator).
2. Confirm with price action: Wait for a price action confirmation, such as a break of the previous high or low, as this helps to avoid false signals and ensures that the trend reversal or continuation is legitimate.
3. Choose the right indicator: Use popular momentum indicators like the RSI, MACD, or Stochastic to spot divergences (each indicator has its strengths, so it’s important to choose one that fits your trading style).
4. Wait for the correct timing: Divergence can signal a change, but it doesn’t always happen immediately-be patient and wait for confirmation before entering a trade.
5. Apply proper risk management: Always use stop losses and calculate your position size based on the risk you are willing to take-never forget that risk management is crucial to surviving in forex trading.
Which Indicators are suitable to Detect Forex Divergences?
Several indicators can be used to detect divergences-these indicators are designed to measure momentum and help you to identify situations where the momentum is not in sync with the price movement.
- Relative Strength Index (RSI): This is one of the most widely used indicators for divergence. It shows whether a currency pair is overbought or oversold, and helps you identify divergence when the price and the RSI move in opposite directions.
- Moving Average Convergence/Divergence (MACD): MACD is another popular momentum indicator that tracks the relationship between two moving averages. Divergence on MACD is a strong signal of trend reversal, and for many who trade on divergences, the first indication of looming trade entry.
- Stochastic Oscillator: The Stochastic Oscillator compares the closing price of a currency pair to its price range over a period of time-divergence in this indicator often signals an impending reversal or continuation of the trend.
- Commodity Channel Index (CCI): The CCI measures the deviation of the price from its average price over a given period, and divergence in the CCI can highlight potential trend changes, or continuations.
What are the Pros and Cons of Forex Divergences?
Pros
- Early identification of reversals
- Useful across timeframes
- Can be combined with other indicators
Cons
- False signals
- Requires patience
- Complexity for new traders
Pros:
Divergence can be used to spot trend reversals early, allowing you to enter positions before the full trend change occurs. Divergence can be applied to multiple timeframes, from minutes to daily charts, making it a versatile reversal strategy.
Divergence can be used in conjunction with other technical tools, such as trend lines and candlestick patterns that increases its reliability.
Cons:
Divergence can sometimes provide false signals, especially in choppy or volatile market conditions, and it’s essential to wait for confirmation before fading the trend.
Divergence patterns may take time to fully develop, requiring you to exercise patience before acting on a growing signal. For beginners, understanding and applying divergence correctly may seem complex without proper education and practice.
Conclusion
Divergence is a powerful tool for identifying trend reversals and continuation in the forex market. By understanding the types of divergence, bullish, bearish, and hidden, you can improve your ability to enter positions at favourable points in the market, optimising your profitability.
Like all trading strategies, divergence should be used in conjunction with other technical analysis tools and risk management strategies, and it demands patience to be successfully identified and applied. Divergence can offer you significant advantages (like early entry points), but it is not foolproof nor an infallible forecast.
You need to understand how to confirm divergence signals and use appropriate risk management techniques to maximize your success. Join the WR Trading Mentorship to learn the subtle details of reliable divergence signals that can increase your overall profitability.
(Never Trade In Uncertainty Again – Join The WR Trading Mentorship)
Frequently Asked Questions on Forex Divergences
What is a Bullish Divergence in Forex?
A bullish divergence is when a currency pair’s price makes lower lows, but the indicator (such as RSI or MACD) makes higher lows. This suggests that the downward trend is losing strength and may reverse upward. If the price trend has been going lower, this might change and the price might pick up.
How do I identify Bearish Divergence?
Bearish divergence happens when the price forms higher highs while the indicator forms lower highs-this suggests weakening bullish momentum and a potential downward reversal. The price movement of a currency pair waxes and wanes within a fairly narrow band in forex, and being able to anticipate where the price is likely to go next by watching for divergence gives you a competitive edge.
What is Hidden Divergence in Forex?
Hidden divergence occurs when the price forms a higher low in an uptrend or a lower high in a downtrend, but the indicator shows the opposite pattern. Hidden divergence is typically used to signal trend continuation, meaning that no matter minor ticks, the current price trend is likely to carry on in the same direction.
What are the Best Indicators for detecting Divergence?
Popular indicators for detecting divergence include the RSI, MACD, Stochastic Oscillator, and CCI, but you should always seek additional confirmation from other indicators in your charting before concluding that a divergence signal is legitimate.
Can divergence be used on any timeframe?
Yes, divergence can be used on any timeframe. The longer the timeframe, the more reliable the signals tend to be, and this is where the patience required of successful reversal traders comes into play.
What are the risks of Trading Divergences?
The primary risks of trading on the back of divergence include false signals and market continuation despite divergence. You should use stop-losses and confirm signals with other tools to mitigate these risks, because while divergence seldom happens without an ensuing potential trading opportunity, there are no guarantees in trading.