Market structure defines how price moves within different phases: whether it is trending, consolidating, reversing, or breaking out. Put slightly differently, market structure refers to the behavior of price action in the forex market, which is often classified into distinct phases or patterns.
These phases provide traders with essential clues about the likely future direction of the market, and since the forex market is the largest and most liquid financial market in the world (with a daily trading volume exceeding $6 trillion), grasping its structure is where successful trading begins
Key Facts about Forex Market Structures
- Forex market structures show price movements in the forex market
- They include consolidation, trend phases, market reversals, trend continuation patterns, and breakouts
- The prevailing forex market structure will determine trade entry and exit
- Understanding forex market structure will help you attain a higher profitability
- Price action is often combined with technical indicators like moving averages, Relative Strength Index (RSI), and Bollinger Bands for confirmation
- Analyzing market structure can be done on various timeframes (1-minute, 15-minute, to daily, weekly)
(Never Trade In Uncertainty Again – Join The WR Trading Mentorship)
List of Forex Market Structures Explained
1. Consolidation
Consolidation refers to a phase in the market where price moves within a defined range, between support and resistance levels, without really establishing a clear trend direction.
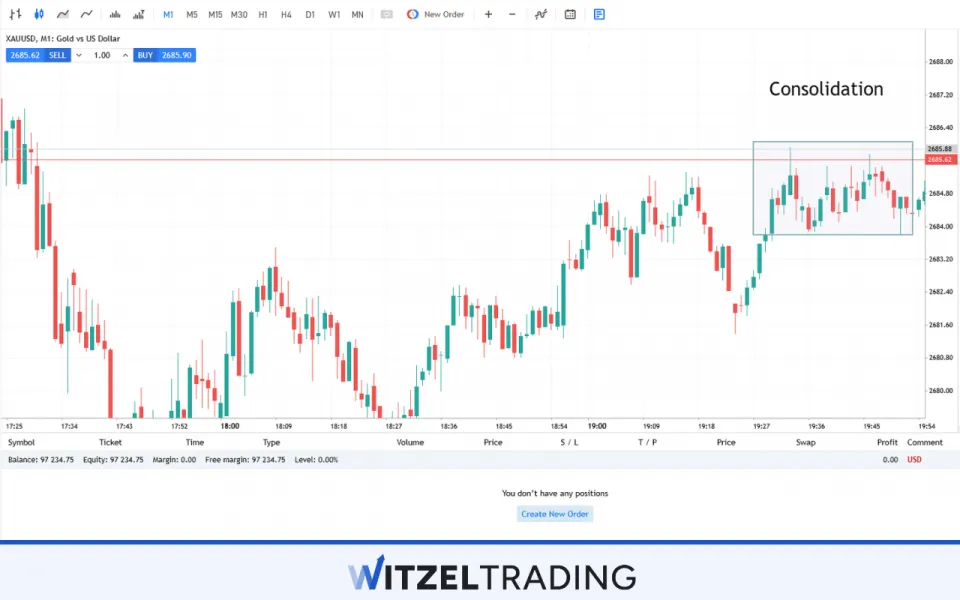
It often follows a strong price movement (whether it was up or down) and marks a period of relative indecision, or market “rest”.
In this phase, the market consolidates gains or losses, and traders might well be waiting for a breakout or continuation of the previous trend before a directional run begins again.
As an example:
- Let’s take the EUR/USD currency pair. After a strong uptrend from 1.1000 to 1.1200, the price enters a consolidation phase, moving sideways between 1.1150 (resistance) and 1.1100 (support). The price action does not show clear upward or downward movement, as the market pauses for a potential breakout. Traders watching this range will expect a breakout once the price either breaches the resistance at 1.1150 or breaks below the support at 1.1100.
How to trade consolidation:
- Range trading. This strategy involves buying when the price hits support and selling when it touches resistance. You’ll wait for the price to hit the lower bound of the range (support) and buy, and when the price approaches the upper bound (resistance), you’ll sell.
- Breakout trading. If you prefer breakout strategies, you’ll wait for the price to move beyond either support or resistance, signaling a potential trend. Once the breakout happens, you can enter trades in the direction of the breakout.
| Phase | Market behavior | Trading strategy | Timeframe focus |
|---|---|---|---|
| Consolidation | Price moves sideways, bound by support and resistance levels | Range trading or breakout trading | Best on lower timeframes (1h, 4h) |
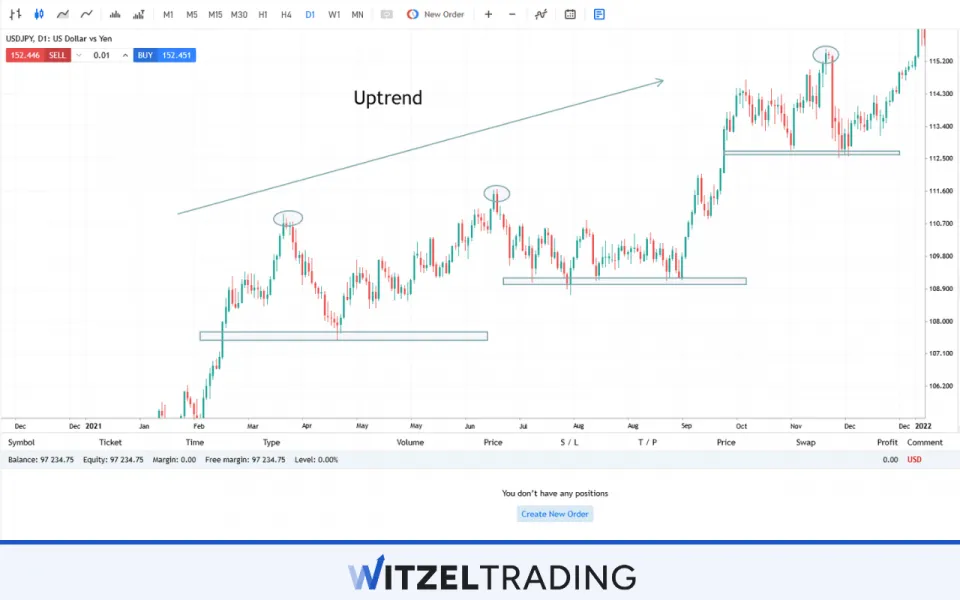
2. Trend Phase (uptrend and downtrend)
Definition:
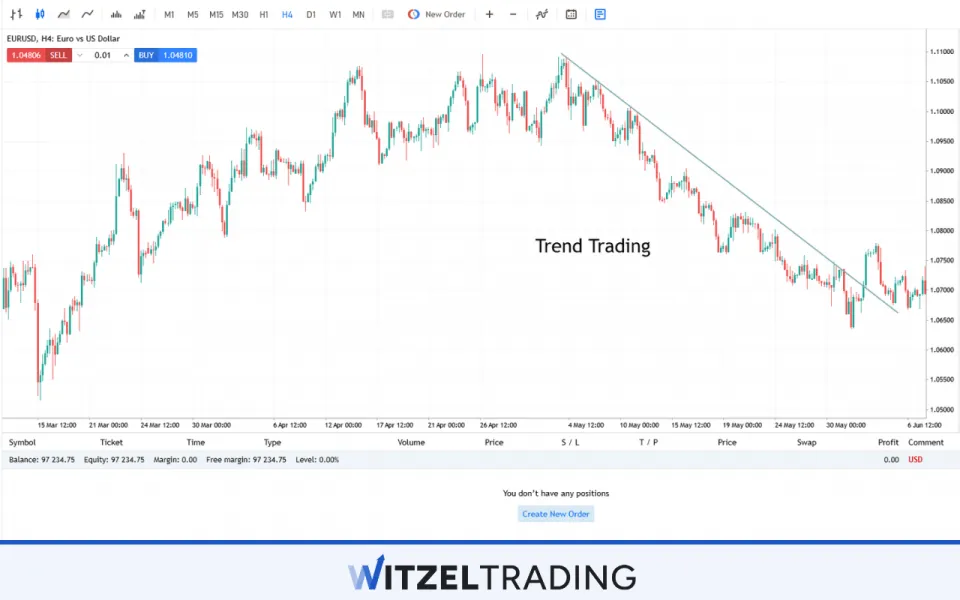
A trend phase is indicated when the market shows a clear directional movement.
Uptrends are marked by higher highs and higher lows, indicating strong buying interest, while downtrends are characterized by lower highs and lower lows, indicating selling pressure.
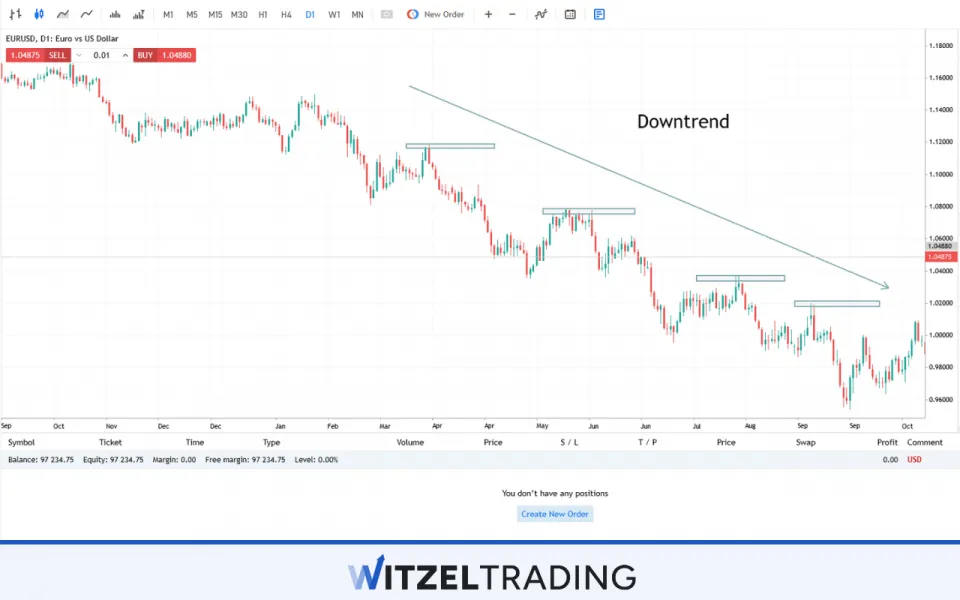
A trend phase can persist for days, weeks, or months, and understanding whether the market is trending or not is key to trading successfully.
By way of an example:
- Uptrend. Consider USD/JPY, where the price moves steadily from 108.00 to 112.00. The price action shows clear higher highs and higher lows. In this phase, traders might look for opportunities to buy on pullbacks or retracements to key support levels (e.g., 109.50 or 110.00).
- Downtrend. On the other hand, if GBP/USD is moving downward from 1.3500 to 1.3200, the price forms lower highs and lower lows. You might sell on rallies to resistance, or short the market after a breakout below support.
How to trade the trend phase:
- Trend following. You can use various methods to follow the trend, such as moving averages (a 50-period or 200-period moving average) to confirm the direction and momentum. You’ll buy in an uptrend during retracements, or sell during pullbacks in a downtrend.
- Using trend indicators: Indicators like the Average Directional Index (ADX) can help determine the strength of the trend. A high ADX value (above 25) denotes a strong trend, while a low ADX value sitting below 20 suggests consolidation, or at best a weak trend.
| Phase | Market behavior | Trading strategy | Indicators to use |
|---|---|---|---|
| Uptrend | Price moves in higher highs and higher lows | Buy on retracements or pullbacks | Moving Averages, MACD, ADX |
| Downtrend | Price moves in lower highs and lower lows | Sell on rallies or retracements | Moving Averages, MACD, ADX |
3. Market Reversals
Definition:
A market reversal happens when price direction changes, very often a signal of the end of a trend.
A clear reversal happens after a sustained trend, where the market shifts its momentum and moves in the opposite direction.
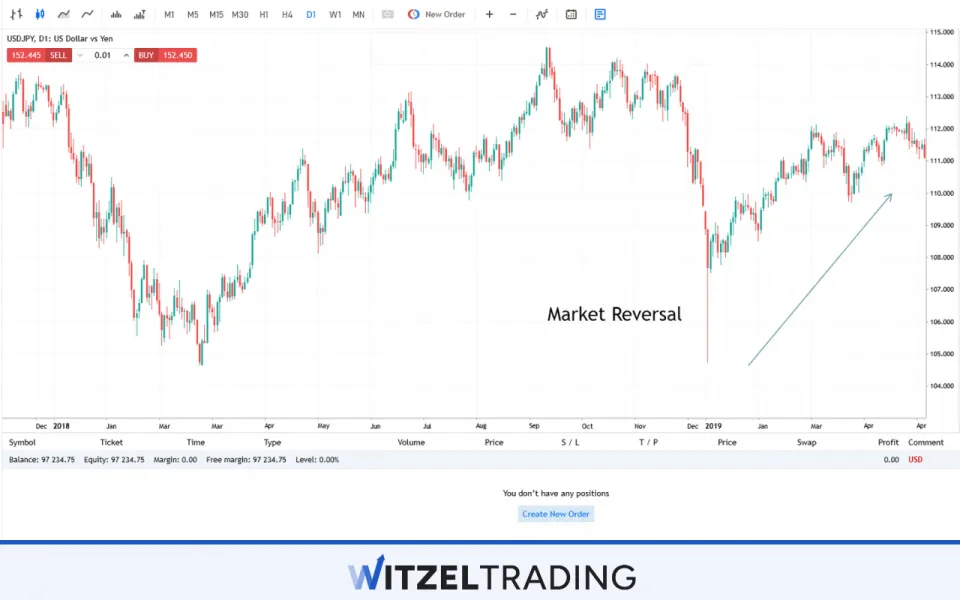
These reversals can take different forms in your charting, such as Head and Shoulders, Double Tops/Bottoms, or candlestick reversal patterns.
As an example:
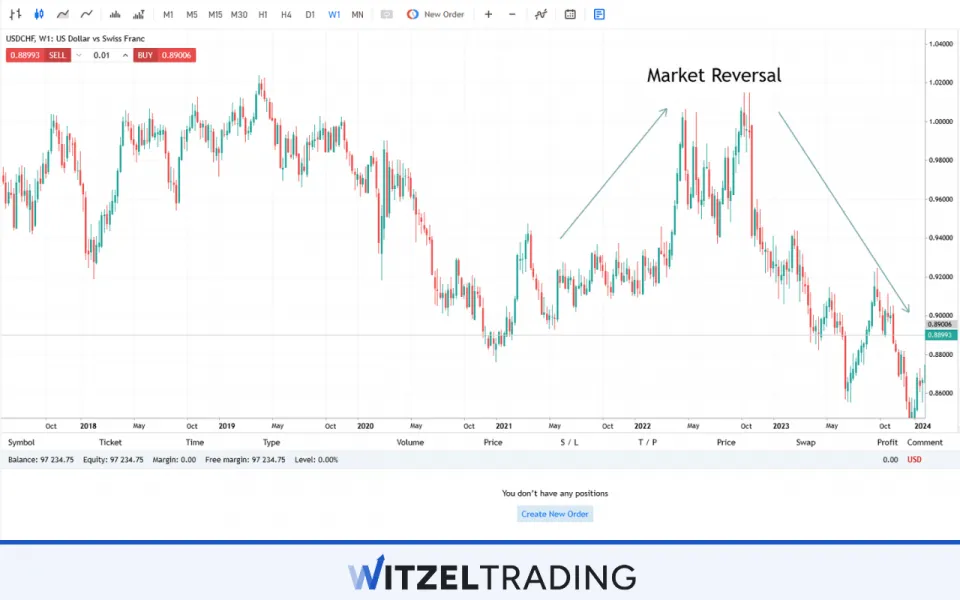
- Reversal from uptrend to downtrend. In the case of USD/CHF, the price moves from 0.9400 to 1.0100 in a clear uptrend, then forms a Head and Shoulders pattern at the top of the trend. Once the price breaks below the neckline, a reversal to the downside is confirmed.
- Reversal from downtrend to uptrend. For EUR/GBP, after a strong downtrend from 0.9000 to 0.8700, the price forms a Double Bottom at 0.8700. The breakout above the resistance at 0.8750 signals a bullish reversal.
How to trade market reversals:
- Pattern recognition. You should watch for chart patterns like Head and Shoulders, Double Tops/Bottoms, or candlestick reversal patterns (engulfing candles or doji candles) to confirm the reversal.
- Wait for confirmation. It’s important not to trade the reversal prematurely-traders typically wait for the price to break beyond key levels, such as the neckline in a Head and Shoulders pattern or the breakout level in a Double Bottom.
- Risk management. Reversals carry risk, so stop-loss orders are essential. Place your stops just outside the pattern (above the head in a Head and Shoulders or below the support in a Double Bottom).
| Phase | Market behavior | Trading strategy | Confirmation signals |
|---|---|---|---|
| Reversal | Price changes direction, forming a new trend or consolidation | Enter in the direction of the new trend | Candlestick patterns, chart patterns (Head & Shoulders, Double Bottom) |
(Never Trade In Uncertainty Again – Join The WR Trading Mentorship)
4. Trend Continuation Structures
Definition:
Trend continuation structures occur when the price consolidates temporarily within a trend, after which the original trend resumes.
These structures suggest that the market remains in the dominant trend, and that the pause is only a temporary correction.
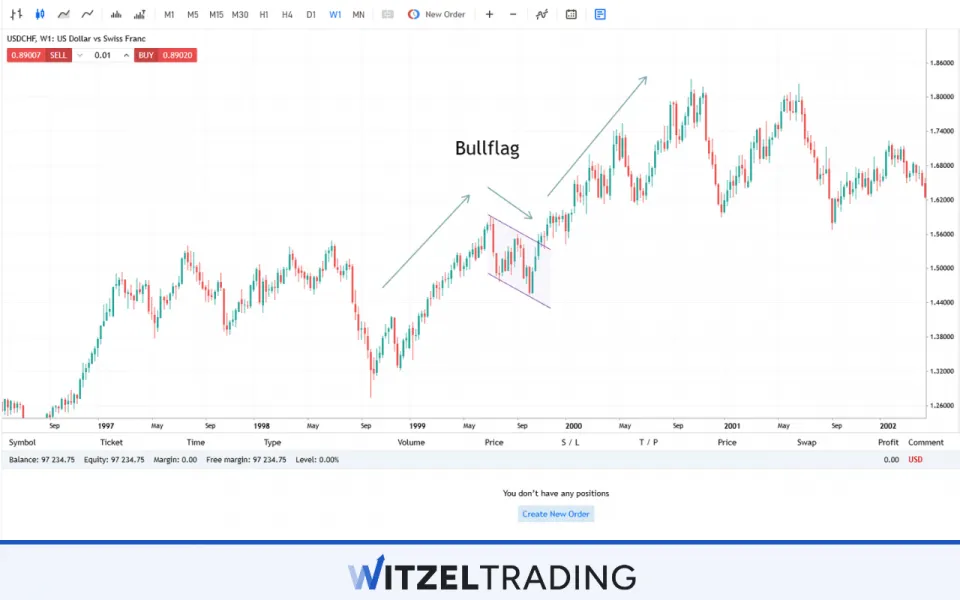
Common continuation patterns include flags, pennants, and triangles.
Example:
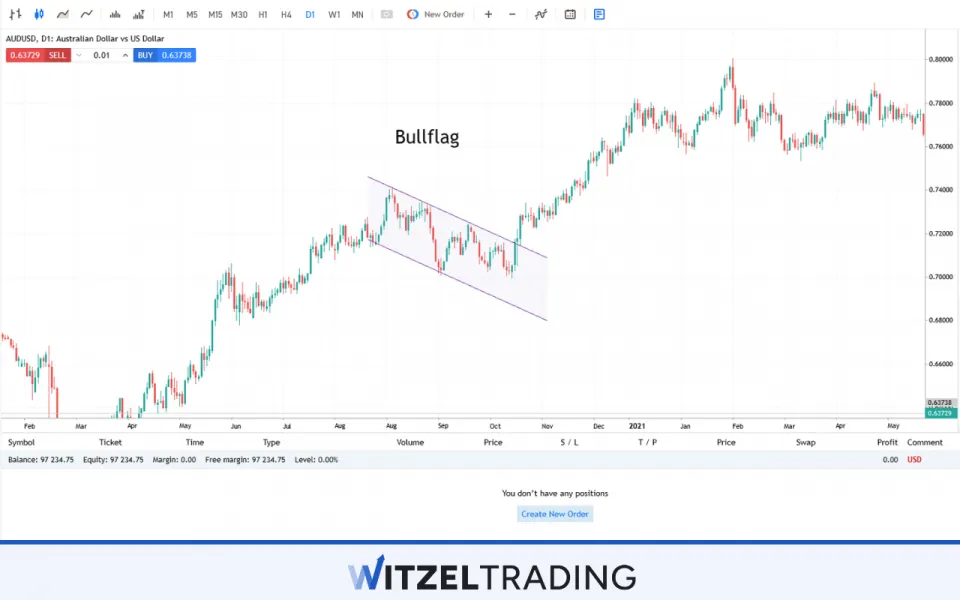
- Bullish continuation. After an uptrend, AUD/USD forms a Bull Flag (a small downward sloping channel). When the price breaks above the flag’s upper boundary, the uptrend resumes.
- Bearish continuation. After a downtrend, GBP/JPY forms a Bear Pennant (a small consolidation with converging trendlines). A break downward below the pennant’s lower trendline confirms the continuation of the downtrend.
How to trade trend continuation structures:
- Enter on breakouts. When the price breaks out of the continuation pattern, you enter in the direction of the prevailing trend. In an uptrend, this means buying at the breakout point, and in a downtrend, it means selling.
- Use momentum indicators. Tools like the Relative Strength Index (RSI) or MACD can help confirm that the trend’s momentum is still strong enough for it to continue after a moment’s consolidation.
| Phase | Market behavior | Trading strategy | Confirmation indicators |
|---|---|---|---|
| Trend continuation | Market consolidates before resuming the trend | Buy on pullbacks in an uptrend, sell on rallies in a downtrend | RSI, MACD, Bollinger Bands |
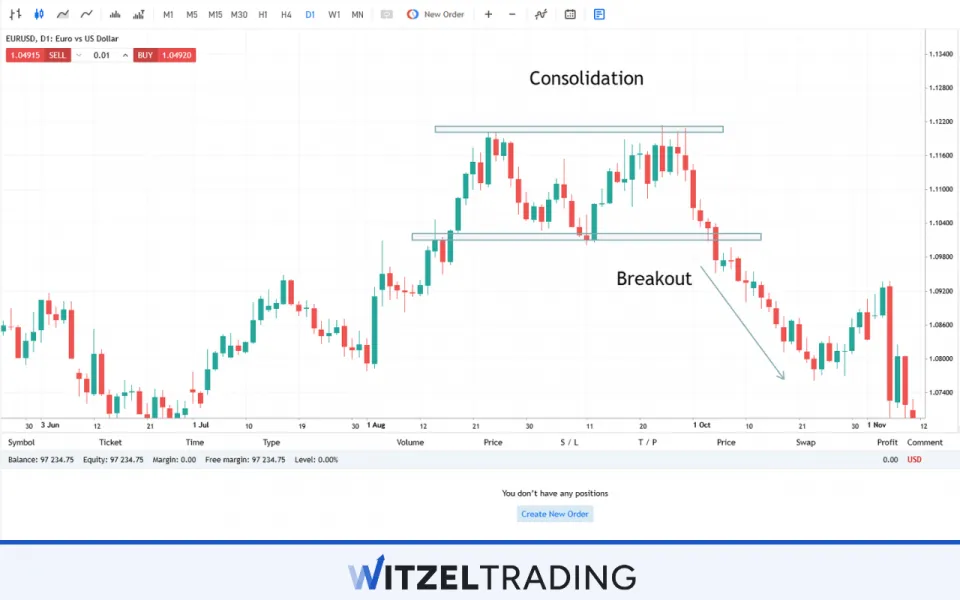
5. Breakout Structures
Definition:
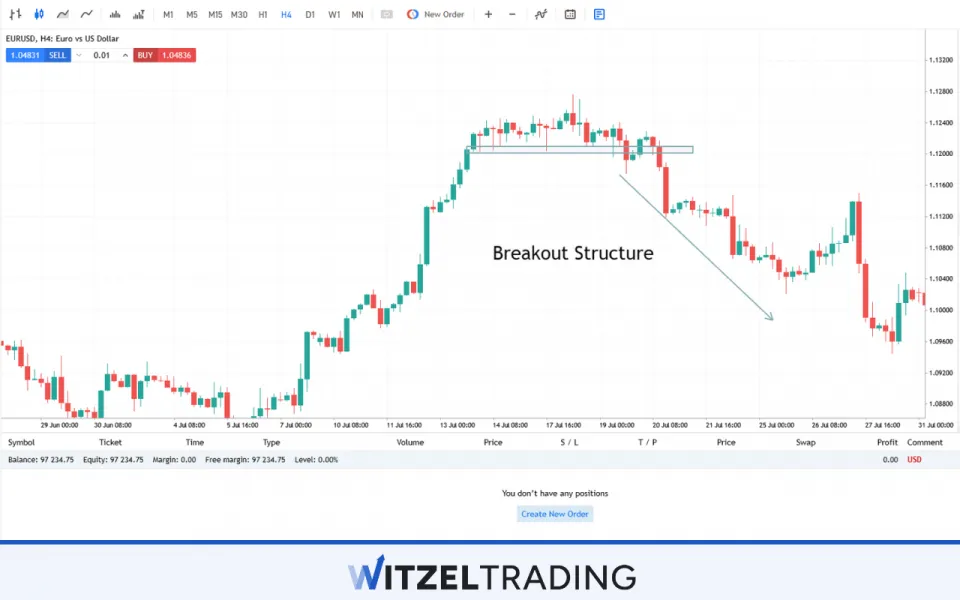
A breakout occurs when the price moves decisively through a key level of support or resistance, signaling a new trend or at least a significant price movement.
Breakouts can happen from consolidation zones, trend continuation patterns, or even as part of a trend reversal.
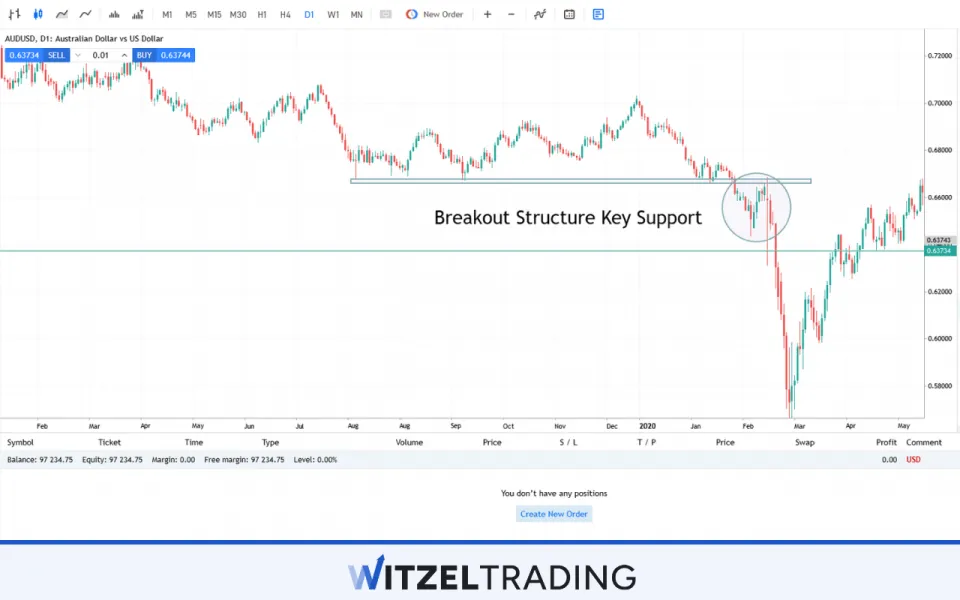
The breakout phase typically follows a period of consolidation, where the market has been moving in a range before it breaks out of that range.
Some good examples of breakouts:
- EUR/USD might trade within a narrow range of 1.1200 to 1.1250 for several days. When the price breaks above 1.1250, it signals a potential upward movement. Traders would enter a long position at the breakout point, anticipating further bullish momentum.
- GBP/JPY forms a descending triangle, with the lower trendline acting as support. When the price breaks below the support level at 150.00, you can enter a short position, expecting further downward movement.
How to trade breakout structures:
- Enter at the breakout point. You should attempt to place your orders at the breakout level, either above resistance for a bullish breakout or below support for a bearish breakout.
- Risk management. False breakouts (fakeouts) are common, so placing a stop-loss order just inside the breakout range helps protect you against this risk.
- Volume analysis. High trading volume during a breakout is a key indicator that the breakout is likely to be genuine.
| Phase | Market behavior | Trading strategy | Confirmation signals |
|---|---|---|---|
| Breakout | Price breaks through key support or resistance | Buy on breakout above resistance, sell on breakout below support | Volume, candlestick patterns (e.g. engulfing), momentum indicators |
(Never Trade In Uncertainty Again – Join The WR Trading Mentorship)
Which is the best Market Structure for making a profit in Forex Trading?
The trend market is generally considered the best market structure for making profits in forex trading.
This is because trends typically offer the most reliable and profitable opportunities for you as a trader, as price movements are often strong and sustained over time.
In a trending market, you have the chance to capture significant moves, especially when you align your trades with the prevailing trend-”the trend is your friend”.
In contrast, market reversals and consolidations can often lead to whipsaw price action, where you run the risk of entering and exiting your trades too early or too late, resulting in losses.
Trends provide comparatively clear entry points and exits, often marked by pullbacks or retracements in the case of an uptrend, and rallies in the case of a downtrend.
The way to profit from trends is to follow the trend and avoid fighting it.
You can use trend-following indicators, such as moving averages, to identify the direction and strength of the trend.
Additionally, momentum indicators like MACD and ADX can help confirm whether the trend is likely to continue, allowing you to ride the trend for maximum profit.
Learn to read Market Structures with the WR Trading Course
WR Trading offers excellent coaching for traders who want to master the art of reading market structures.
Our course covers everything from understanding basic price action to recognizing complex chart patterns and structures, and by providing in-depth lessons and real-time market examples, we ensure that students can identify market structures confidently to subsequently trade with precision.
You’ll learn how to read price action, use technical indicators to confirm structures, and develop strategies based on different market conditions.
With hands-on training and detailed breakdowns, WR Trading empowers you to become more skilled in market analysis, and trade with greater confidence and ensuing profitability
(Never Trade In Uncertainty Again – Join The WR Trading Mentorship)
How is the Forex Market structured in a financial way?
The foreign exchange (FX) market comprises various segments, each with distinct characteristics; these include the over-the-counter (OTC) market, futures, and options, all of which involve major banks and financial institutions.
- OTC market. The majority of forex trading occurs in the OTC market, where transactions take place directly between two parties (retail traders, banks, and brokers). The OTC market is highly liquid and operates globally, with no central exchange.
- Forex futures. Futures contracts allow you to buy or sell a currency at a specified price on a future date. These are standardized contracts, and a large percentage gets traded on the Chicago Mercantile Exchange (CME).
- Forex options. Forex options give you the right, but not the obligation, to buy or sell a currency at a predetermined price by a certain date. Options are often used by large institutions and corporations to hedge against currency risks.
- The role of banks: Banks, both central and commercial, play a significant role in forex market structure. Central banks, such as the Federal Reserve (USA), European Central Bank (ECB), and Bank of Japan (BOJ), influence currency prices through interest rate decisions, monetary policies, and foreign exchange interventions, while commercial banks facilitate currency exchange for individuals, corporations, and institutional clients.
Understanding the various forex market structures and the financial impetus or influence behind the various segments equips you with the tools to understand market behavior, and make more profitable trades.
By recognizing these phases and applying the right strategies, you can adapt to changing market conditions and maximize your success.
Moreover, understanding the structural foundation of the forex market and the role of banks and financial institutions further enriches your understanding, enabling you to navigate the market with greater precision-when you understand the macro structure of the forex market, trading successfully with the micro details becomes clearer and more successful.
Most Frequently Asked Questions On Forex Markets Structures
Does “forex market structure” mean how the thing is assembled?
No. We talk of forex market “structure(s)” to denote moments in time when the forex market is consolidating, trending, undergoing a market reversal, or experiencing a trend continuation, or when the price is breaking out of its recent range. Forex market structures refer to the different phases in which prices move, and these phases change, providing opportunities to enter price movements and profit from them.
Why is it important to understand the foreign exchange market’s structures?
Understanding forex market structures is crucial because it helps you to identify the current phase of the market, whether it is in a trend, consolidation, or reversal phase. By recognising these structures, you gain the big picture and are then able to make more informed decisions about when to enter or exit trades, how to manage the risk, and maximise your profit potential.
What are the main types of market structures in forex trading?
The main types of market structures in forex trading are consolidation (a period of sideways price movement, where the market consolidates after a trend), a trend phase (a period where the market is moving in a clear direction, either going up in a bullish trend, or going down in a bearish trend), market reversals (a shift in the market from an existing trend to the opposite direction, often triggered by a pattern or key support/resistance level), trend continuation structures (patterns like flags, pennants, and wedges that signal the market is likely to continue in the prevailing trend, and breakout structures (when price breaks out of a key level of support or resistance, signaling a potential new trend).
What is the difference between consolidation and a trend phase in forex?
In a consolidation phase, the market is moving sideways, creating a range between a support and resistance level. Prices are neither making higher highs nor lower lows, indicating indecision in the market, while in a trend phase, the market moves in one direction, either upwards (bullish) or downwards (bearish), creating higher highs and higher lows (an uptrend) or lower highs and lower lows (a downtrend).
How can I identify when the market is in a consolidation phase?
The consolidation phase is identified by a lack of clear direction, where prices oscillate within a defined range. You can look for horizontal support and resistance levels or a tightening price range. Technical indicators like Bollinger Bands or the Average True Range (ATR) can also help you spot low volatility, which indicates consolidation.
What are the signs of a market reversal in forex trading?
A market reversal occurs when price changes direction, usually after a strong trend. Signs of reversal include reversal chart patterns such as Head and Shoulders, Double Tops/Bottoms, and Inverse Head and Shoulders. Also, candlestick patterns (like engulfing patterns, hammer, or doji) and divergence indicate reversal (the latter referring to a divergence between price and indicators like the RSI or MACD, where price makes new highs/lows, but the indicator does not).
What is the best way to trade forex during a trend phase?
To trade effectively during a trend phase, follow the trend-enter long positions in an uptrend, and short positions in a downtrend. Use trend indicators like moving averages, the ADX (Average Directional Index), or the Parabolic SAR to help you confirm the trend direction and strength. Also, wait for pullbacks, entering during pullbacks or corrections to get better entry points, using tools like Fibonacci retracements. Trading the trend is generally the most profitable, but you should always try to refine your entry and exit points to maximize your profits.
What is a trend continuation structure, and how does it work?
A trend continuation structure occurs when the market pauses or consolidates during a trend, only to resume in the same direction. Common continuation patterns include flags (short term consolidations after a strong price move, forming a rectangular shape), pennants (similar to flags, but the consolidation takes the form of a small symmetrical triangle), and wedges (both Rising and Falling Wedges signal that the trend is likely to continue, once the price breaks out of the pattern).
How can I spot a breakout structure in forex?
A breakout structure is identified when price breaks through key levels of support or resistance, usually accompanied by an increase in volume or momentum. Common breakout patterns include triangles (symmetrical, ascending or descending triangles often precede breakouts), channels (when price breaks above a descending channel in an uptrend or below an ascending channel in a downtrend), and rectangular ranges (a breakout happens when price moves beyond the top or bottom of a defined range).
What role do trendlines and support/resistance levels play in identifying market structures?
Trendlines and support/resistance levels are fundamental tools in identifying forex market structures, as trendlines help you define the slope of an uptrend or downtrend and act as dynamic support/resistance levels, while support/resistance are static levels that indicate price points where the market has historically reversed or stalled, which are essential for recognizing consolidation, reversal, or breakout structures.
How does the concept of market structure apply to forex risk management?
Understanding market structures is vital for risk management primarily because it helps you determine appropriate entry and exit points, as well as stop-loss placement. During a trend phase, you can place stop-losses below recent lows in an uptrend or above recent highs in a downtrend. In consolidation, your risk management might involve setting stops around key support/resistance levels and waiting for a breakout. For their part, reversal patterns require careful risk management since price can move unpredictably after breaking support or resistance.