Chart patterns are visual representations of price movements in the form of a recognizable shape or configuration, which can suggest the future forex market direction.
Chart patterns can offer you valuable insights into potential forex market moves, and the above patterns are the most commonly employed and valuable patterns to work with.
Short List of the Best Forex Patterns
(Never Trade In Uncertainty Again – Join The WR Trading Mentorship)
Explanation of the Best Forex Chart Patterns
1. Double Top and Double Bottom
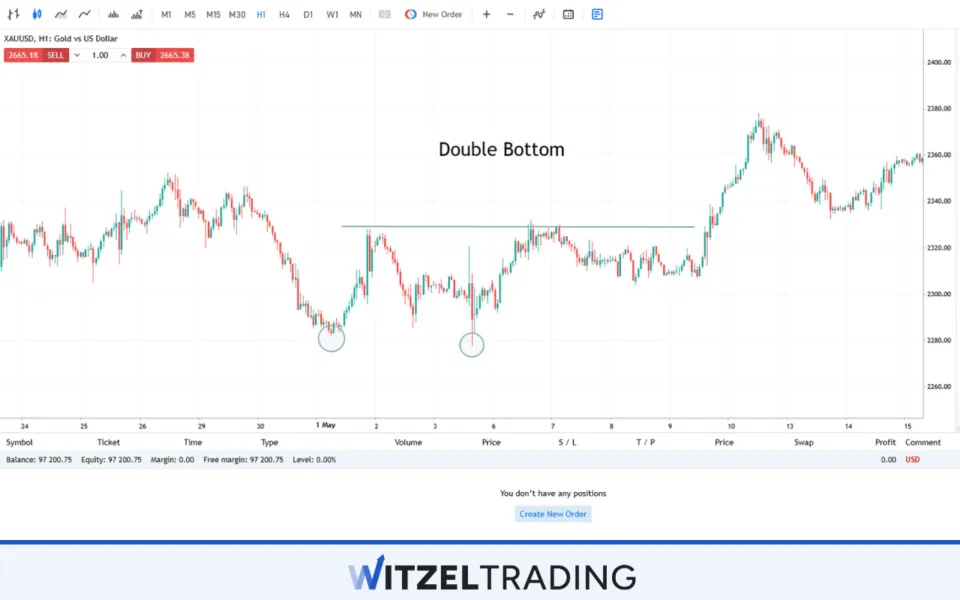
The Double Top and Double Bottom are reversal patterns that signal a change in the trend direction.
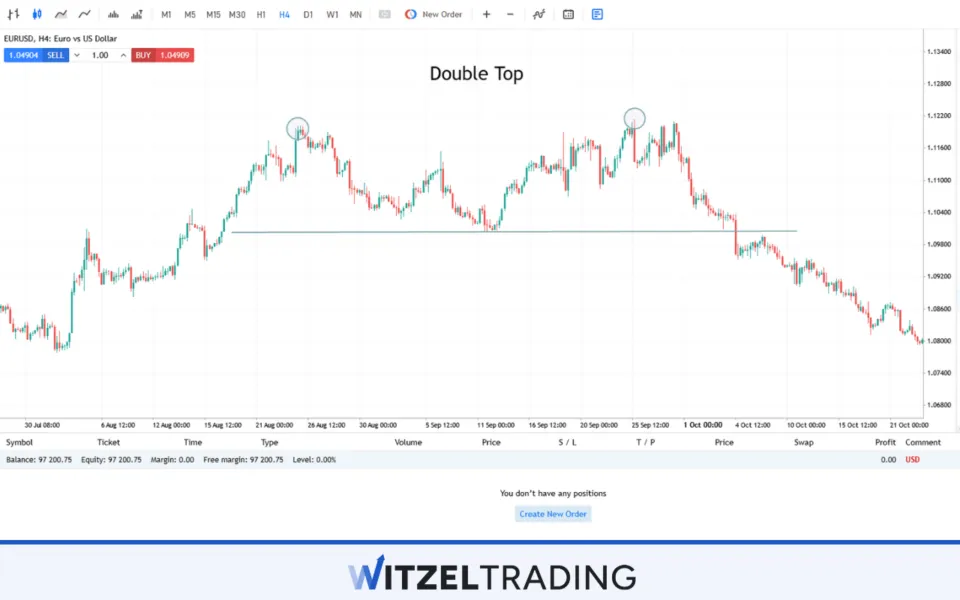
A Double Top is a bearish reversal pattern that forms after an uptrend, and it typically signals that the price will fall.
A Double Bottom, on the other hand, is a bullish reversal pattern that manifests after a downtrend, indicating that the price will likely rise.
Here’s an example of both:
- Double Top: Imagine a price chart of EUR/USD, where the price rises to a certain level, pulls back, rises again to the same level, and then falls. The two peaks represent the “tops,” and the breakout below the low point in between the peaks confirms the reversal.
- Double Bottom: If, for example, the GBP/USD pair has fallen, hits a low, rises slightly, then falls again to the same level before rallying, this would form a Double Bottom, meaning the price is likely to rise now.
| Pattern | Trend before | Trend after | Confirmation signal |
|---|---|---|---|
| Double Top | Uptrend | Downtrend | Price breaks below the neckline* |
| Double Bottom | Downtrend | Uptrend | Price breaks above the neckline |
* The “neckline” is a trendline drawn underneath a head and shoulders pattern, and it’s employed in technical analysis, signaling a buying opportunity.
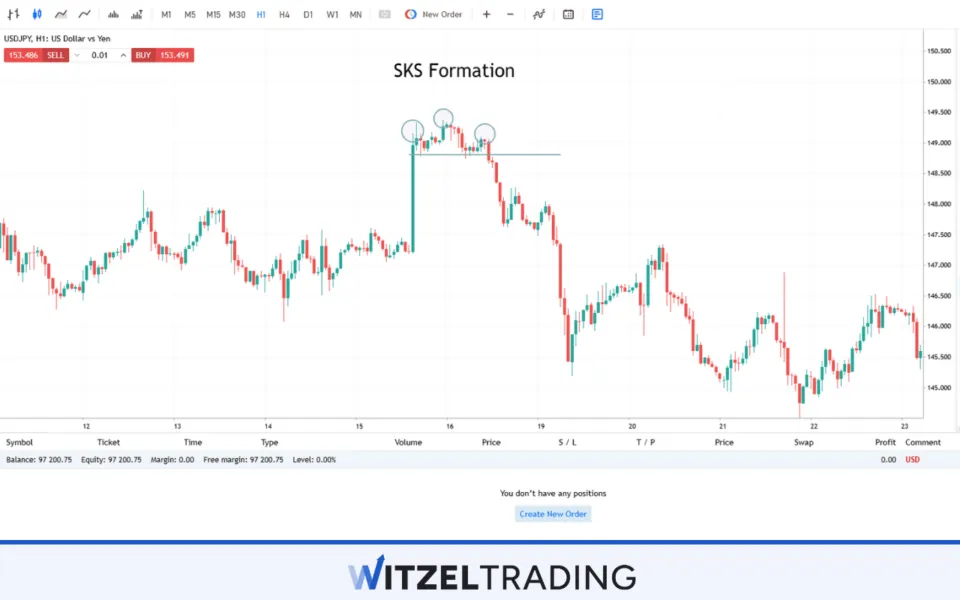
2. Head and Shoulders Pattern
The Head and Shoulders pattern is one of the most reliable reversal chart patterns you can watch for and use to gauge entry points.
It consists of three peaks-a higher peak (the head), between two smaller peaks (the shoulders).
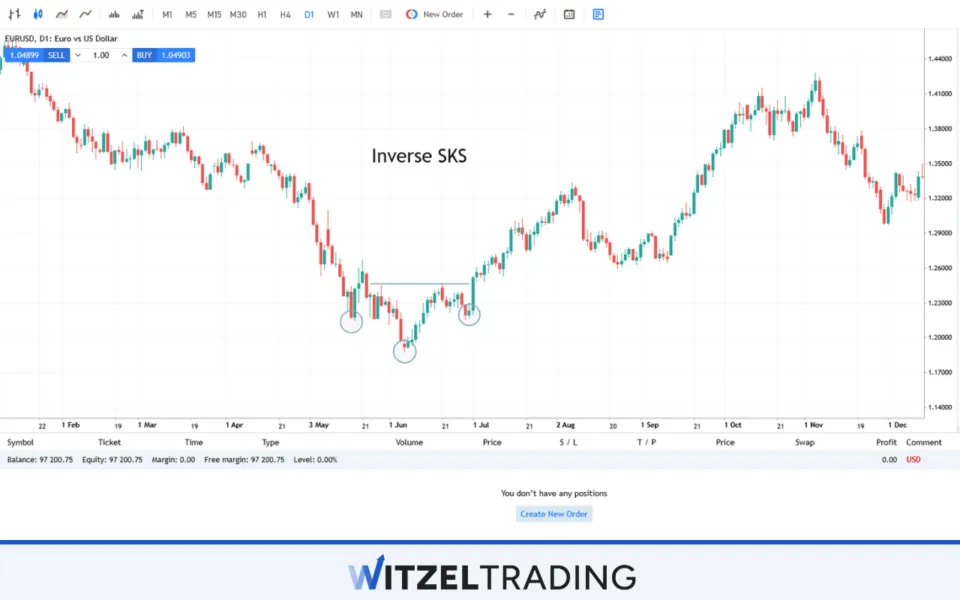
A Head and Shoulders Top signals the end of an uptrend, while an Inverse Head and Shoulders (the reverse of the regular pattern) signals the end of a downtrend, and the beginning of an uptrend.
As an example of both types of Head and Shoulders:
- Head and Shoulders Top: If the price of USD/JPY rises, forms a peak (shoulder), then falls and rises to a higher peak (head), falls again and then rises yet again to form another “shoulder” peak, and a downward breakout from the neckline will confirm the trend reversal.
- Inverse Head and Shoulders: If USD/JPY falls and forms a lower low (shoulder), rises to a temporary high, then falls again to an even lower point (head), then rises momentarily again only to fall back to the first lower low (shoulder), then breaks above the neckline, this pattern signals an upward trend reversal.
| Pattern | Trend before | Trend after | Confirmation signal |
|---|---|---|---|
| Head and Shoulders Top | Uptrend | Downtrend | Price breaks below the neckline |
| Head and Shoulders Bottom | Downtrend | Uptrend | Price breaks above the neckline |
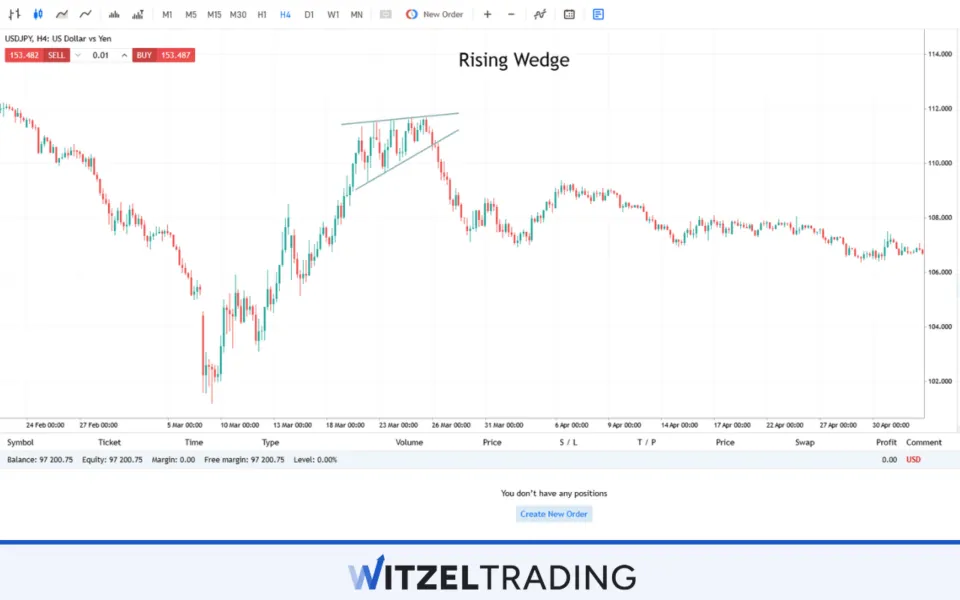
3. Rising and Falling Wedge
A Rising Wedge is a bearish pattern formed when the price moves higher within converging trendlines.
It suggests that buying pressure is weakening, and a reversal downward is likely.
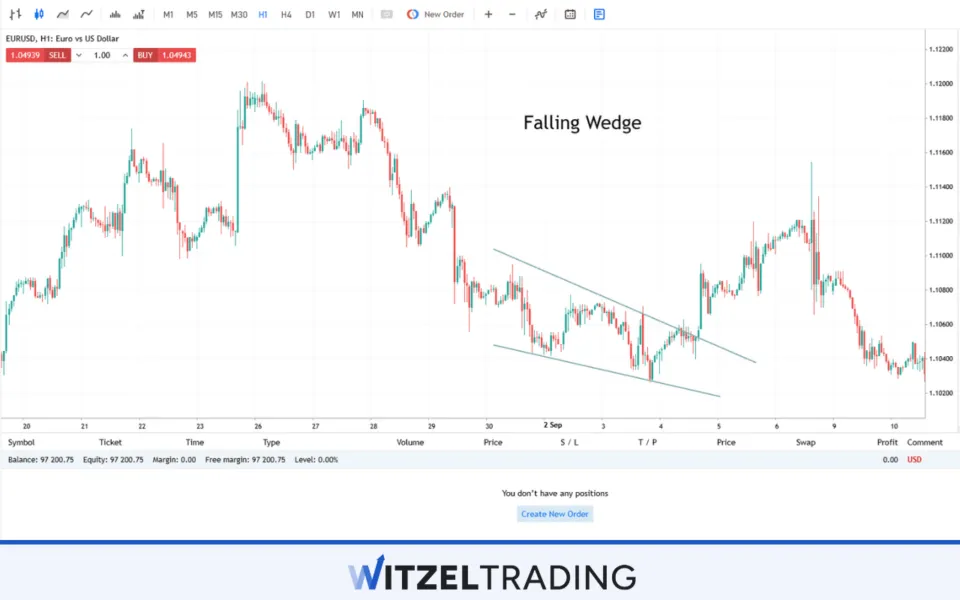
A Falling Wedge is the opposite, where the price moves lower within converging trendlines, signaling that selling pressure is fading and a bullish breakout is expected.
Examples of both would be:
- Rising Wedge: For example, in a 4-hour chart of AUD/USD, if the price rises with higher highs and higher lows but the trendlines begin to converge, it indicates the potential for a reversal to the downside.
- Falling Wedge: In a falling wedge, such as with EUR/USD, the price is making lower lows and lower highs, but the pattern narrows, signaling that a bullish breakout is on the horizon.
| Pattern | Trend before | Trend after | Confirmation signal |
|---|---|---|---|
| Rising Wedge | Uptrend | Downtrend | Price breaks below the lower trendline |
| Falling Wedge | Downtrend | Uptrend | Price breaks above the upper trendline |
(Never Trade In Uncertainty Again – Join The WR Trading Mentorship)
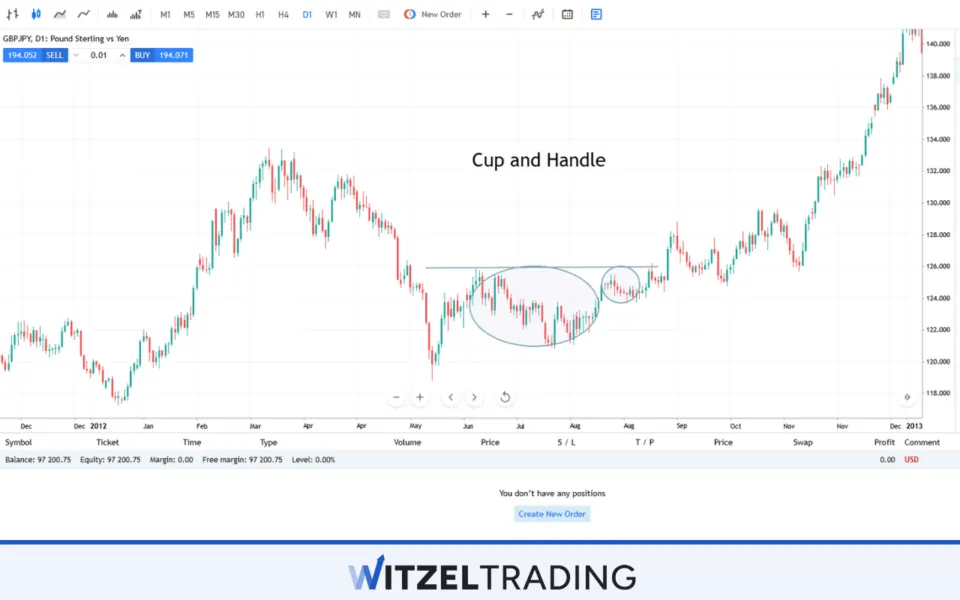
4. Cup and Handle Pattern
A bullish continuation pattern that appears looking rather like the shape of a tea cup. The Cup and Handle pattern denotes a persistent upwards price movement after a brief hiatus.
It begins with a rounded bottom (the cup), followed by a consolidation phase that forms the handle.
This pattern suggests that after a period of consolidation, the price will break out to the upside.
As an example:
- In a chart of GBP/JPY, the price forms a rounded bottom (the cup), then consolidates in a small range (the handle) before breaking upwards. This is a typical Cup and Handle formation, indicating continued bullish momentum.
| Pattern | Trend before | Trend after | Confirmation signal |
|---|---|---|---|
| Cup and Handle | Uptrend | Continuation | Price breaks above the handle’s high |
5. Bull & Bear Flag Pattern
Bull Flags and Bear Flags are continuation patterns that indicate the likelihood of a trend resuming after a fairly brief consolidation.
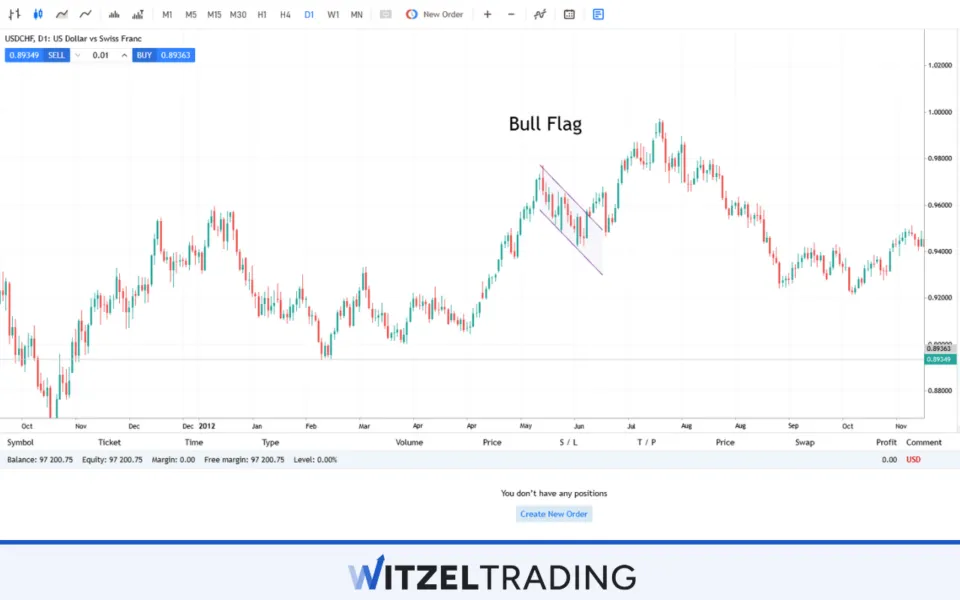
A Bull Flag appears after an uptrend and is a small rectangular or parallelogram-shaped consolidation before a breakout higher.
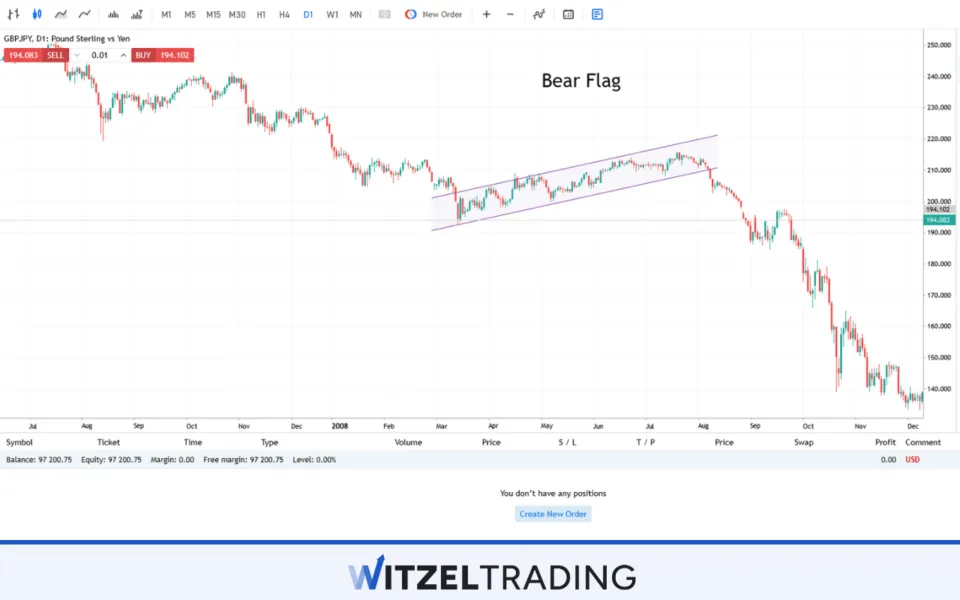
A Bear Flag forms after a downtrend and signals that the price is likely to continue downward after a brief consolidation.
As examples:
- Bull Flag: If USD/CHF has been in an uptrend and then forms a flag pattern (small downward channel), the breakout above the flag suggests the uptrend will resume.
- Bear Flag: Conversely, if EUR/USD has been in a downtrend and consolidates within a narrow upward range, the breakout to the downside indicates that the bearish trend will continue.
| Pattern | Trend before | Trend after | Confirmation signal |
|---|---|---|---|
| Bull Flag | Uptrend | Continuation | Price breaks above the flag’s high |
| Bear Flag | Downtrend | Continuation | Price breaks below the flag’s low |
6. V Formation Pattern
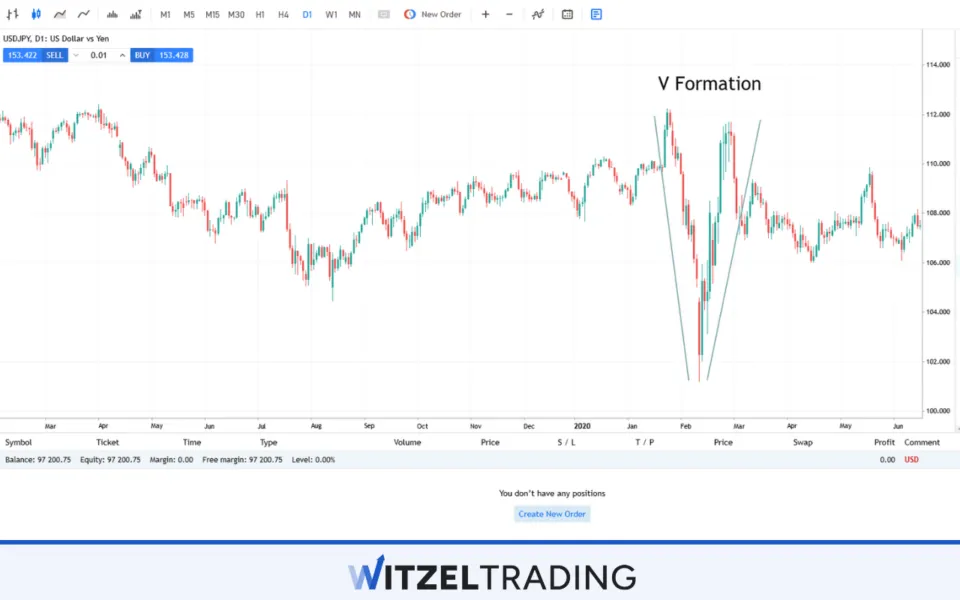
The V Formation is a noticeably sharp and rather rapid price movement that forms a “V” shape on your chart.
This pattern can signal a reversal in trend and indicates that after a steep decline (or rise), the price quickly reverses in the opposite direction.
An example:
- V Formation: in the USD/JPY pair may occur when the price drops sharply, forms a sharp bottom (the vertex of the “V”), then quickly reverses direction and rallies back upwards.
| Pattern | Trend before | Trend after | Confirmation signal |
|---|---|---|---|
| V Formation | Sharp decline | Reversal | Rapid price movement in the opposite direction |
(Never Trade In Uncertainty Again – Join The WR Trading Mentorship)
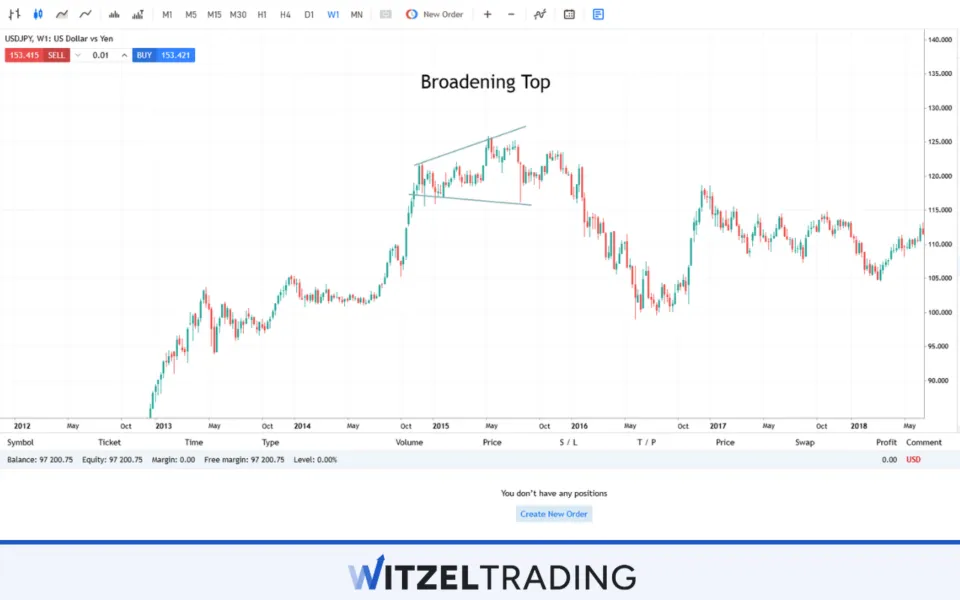
7. Broadening Top and Bottom
The Broadening Formation (also known as a megaphone pattern) is a type of reversal pattern where price action forms wider and wider swings over time.
It typically signals high volatility due to pronounced indecision in the market.
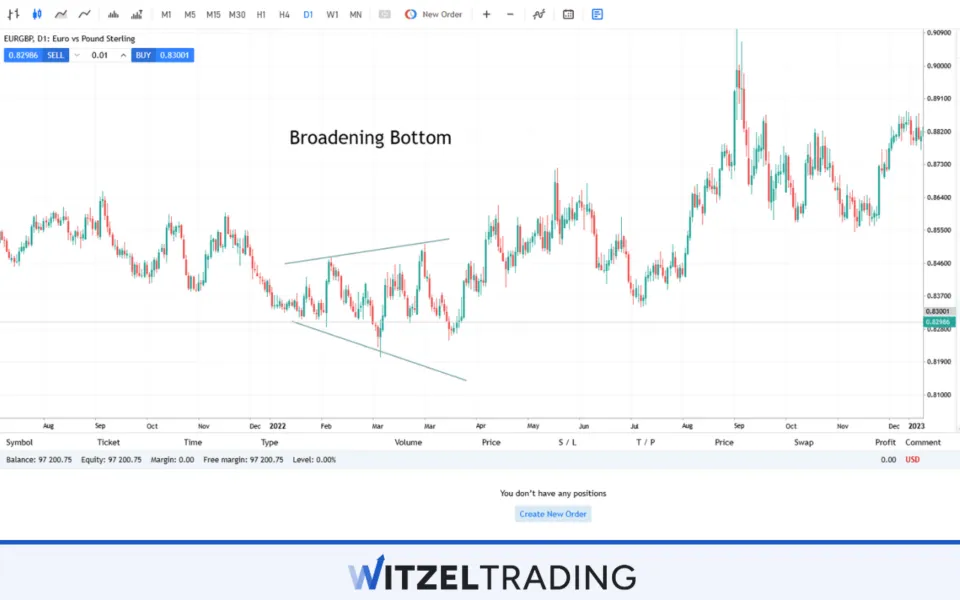
A Broadening Top follows an uptrend, indicating a potential reversal to the downside, while a Broadening Bottom follows a downtrend, signaling a potential reversal upward.
Good examples of both would be:
- Broadening Top: After an uptrend, the price starts making higher highs and lower lows, forming an expanding pattern. The eventual breakout below the lower trendline signals a trend reversal.
- Broadening Bottom: In a downtrend, the price forms lower lows and higher highs, signaling that the market is undecided, but a breakout above the upper trendline signals a reversal.
| Pattern | Trend before | Trend after | Confirmation signal |
|---|---|---|---|
| Broadening Top | Uptrend | Downtrend | Break below the lower trendline |
| Broadening Bottom | Downtrend | Uptrend | Break above the upper trendline |
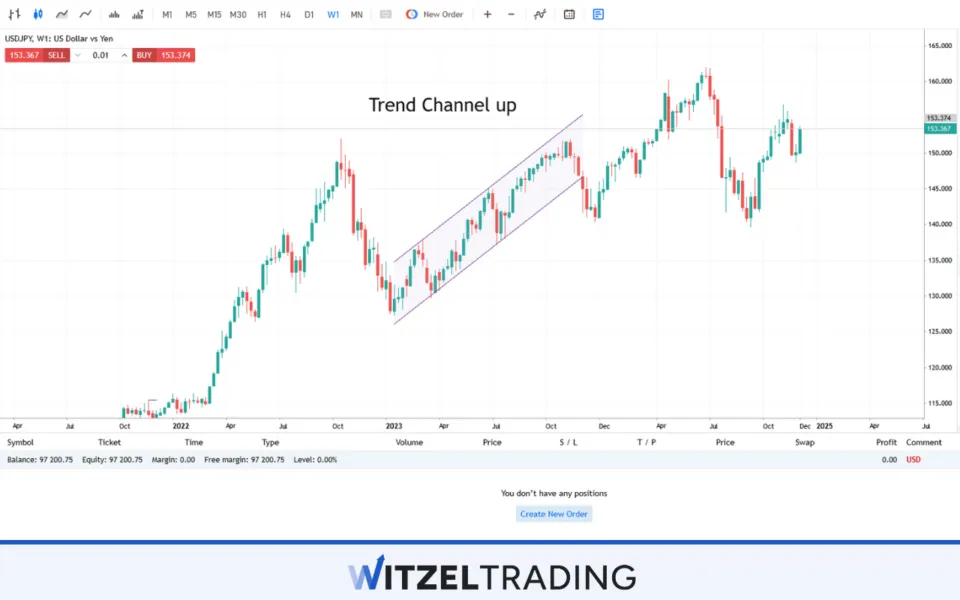
8. Trend Channel Formation Pattern
A Trend Channel is a continuation pattern where the price moves within two parallel trendlines.
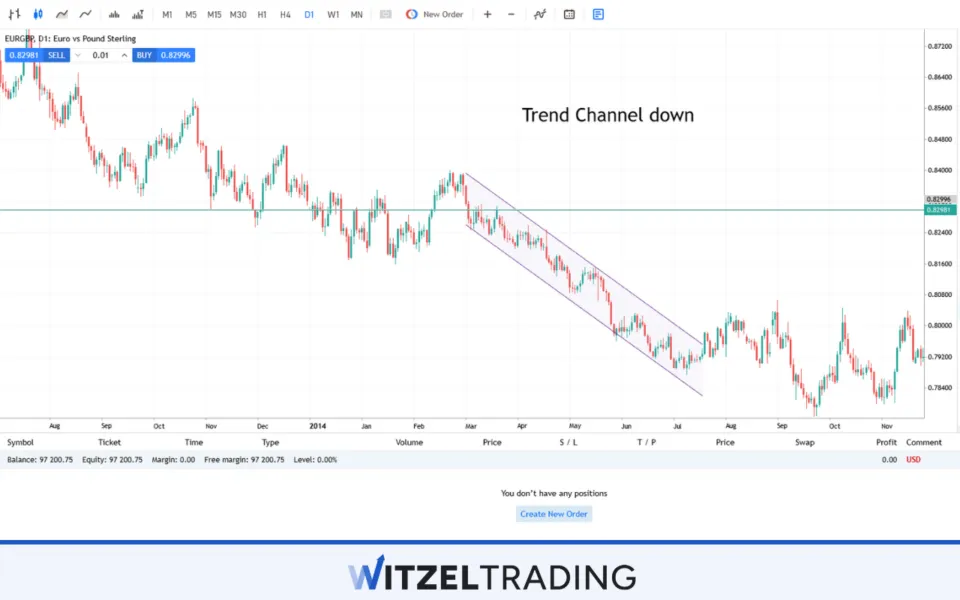
This pattern can appear in both uptrends (ascending channels) and downtrends (descending channels), and it suggests that the trend will continue once the price breaks out of the channel.
By way of examples:
- Trend Channel (up): In an ascending channel, USD/JPY might form a pattern where the price rises in a parallel upward channel. A breakout above the upper trendline signals further upward movement.
- Trend Channel (down): In a descending channel, GBP/JPY patterns for a parallel downward channel. Should the price break out below the bottom trendline, it denotes further downward movement.
| Pattern | Trend before | Trend after | Confirmation signal |
|---|---|---|---|
| Trend Channel (up) | Uptrend | Continuation | Price breaks above the upper channel |
| Trend Channel (down) | Downtrend | Continuation | Price breaks below the lower channel |
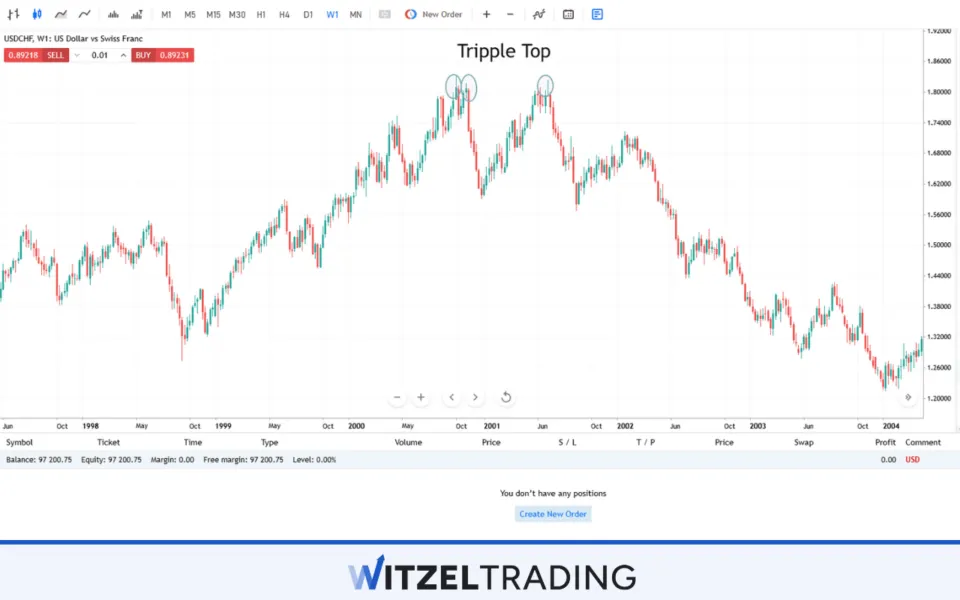
9. Triple Bottom and Top
The Triple Bottom and Triple Top are reversal patterns that are similar to Double Tops and Bottoms, but they involve three peaks (or valleys) rather than two.
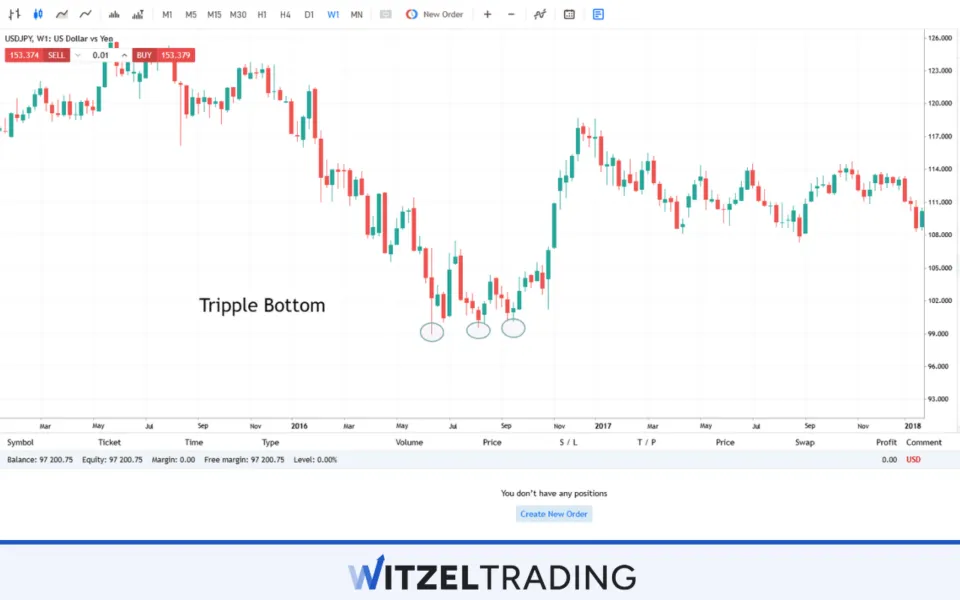
A Triple Bottom appears in a downtrend and suggests that the price will rise.
A Triple Top occurs in an uptrend, signaling that the price is likely to reverse downward.
Examples of both:
- Triple Bottom: In the case of GBP/USD, if the price hits a low three times, forming a triple bottom, the breakout above the neckline would signal a bullish reversal.
- Triple Top: A pattern forms when USD/CHF makes three peaks at roughly the same level, before breaking below the neckline, signaling a reversal to the downside.
| Pattern | Trend before | Trend after | Confirmation signal |
|---|---|---|---|
| Triple Bottom | Downtrend | Uptrend | Price breaks above the neckline |
| Triple Top | Uptrend | Downtrend | Price breaks below the neckline |
(Never Trade In Uncertainty Again – Join The WR Trading Mentorship)
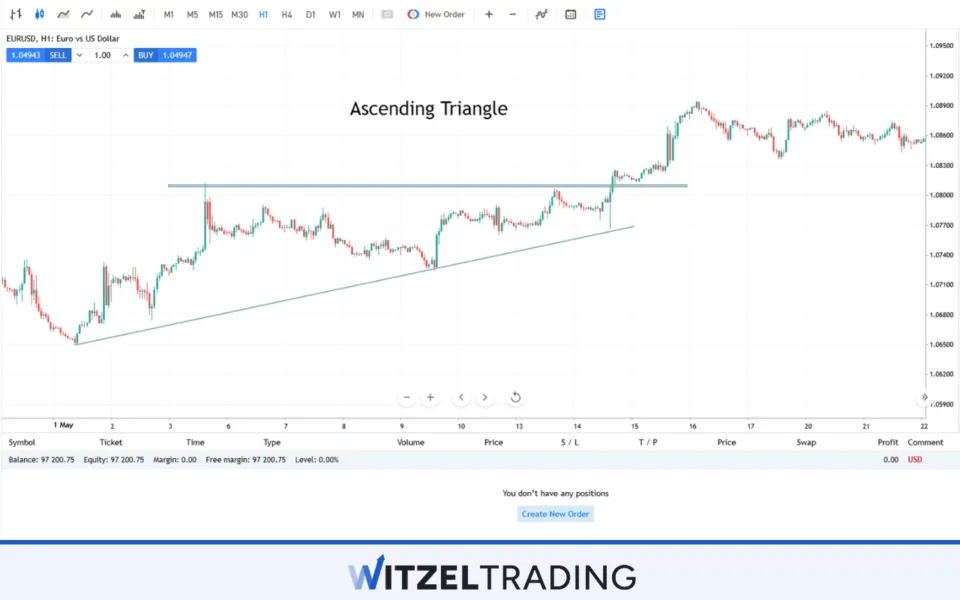
10. Ascending and Descending Triangle
The Ascending Triangle is a bullish continuation pattern that forms when price forms a series of higher lows and a flat resistance level.
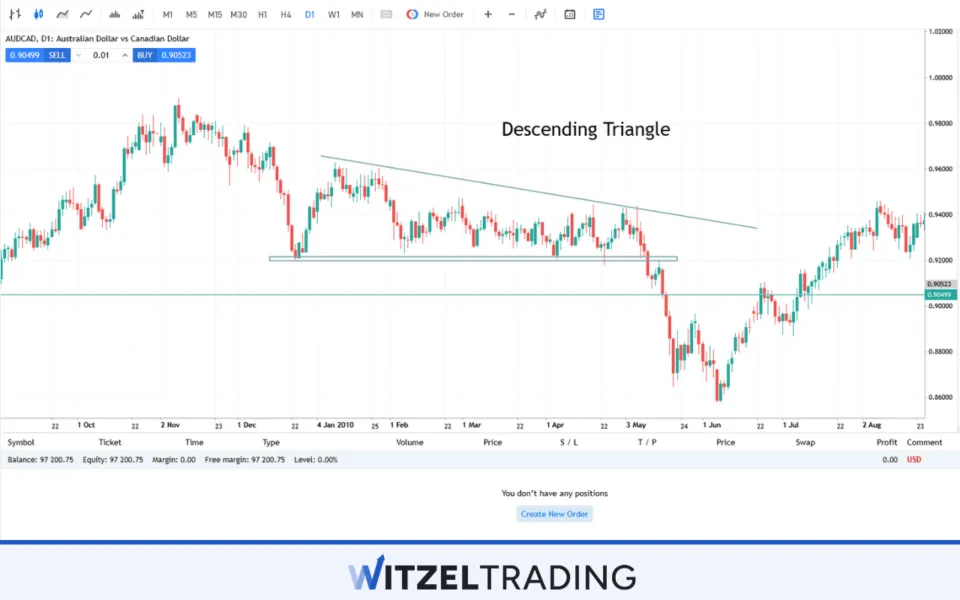
A Descending Triangle is a bearish continuation pattern, formed by lower highs and a flat support level.
Examples:
- Ascending Triangle: EUR/USD could form an ascending triangle with higher lows and a resistance at the same level. A breakout above the resistance level signals continued upward movement.
- Descending Triangle: A descending triangle in GBP/USD with lower highs and a flat support line suggests that a break below the support level will likely continue the downtrend.
| Pattern | Trend before | Trend after | Confirmation signal |
|---|---|---|---|
| Ascending Triangle | Uptrend | Continuation | Break above the resistance line |
| Descending Triangle | Downtrend | Continuation | Break below the support line |
What profitability rate can you expect from Forex Chart Patterns?
Historically, chart patterns like the Head and Shoulders and Double Top/Bottom have a success rate of around 70-80% when used correctly.
The profitability rate for forex chart patterns can vary widely, however, depending on the pattern, the currency pair, the timeframe, and overall market conditions.
This rate can be lower or higher, however, depending on factors such as proper risk management, confirmation indicators, and trade execution efficiencies.
Once you’ve learned to spot pattern formations and position yourself for trade entry, also typically confirming what you’re seeing with other technical indicators, regular profitability becomes easier to predict.
Which Currency Pairs are the best for using Chart Patterns?
Major pairs like EUR/USD, GBP/USD, USD/JPY, and AUD/USD are commonly used for chart pattern analysis, because they tend to exhibit more predictable chart patterns due to their liquidity and volatility.
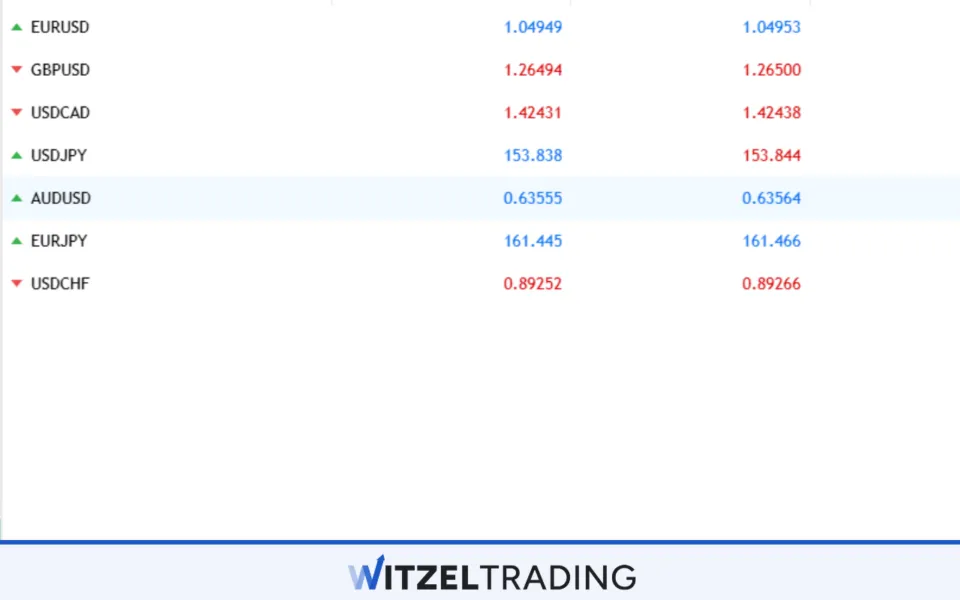
These pairs typically have enough movement and tight spreads to make chart patterns more reliable, and that reliability is valuable to you as a trader.
Less liquid pairs (exotics) on the other hand, may have more erratic price action that make patterns harder to discern, and profitability more elusive.
See our best currency pairs to trade here!
Learn to Read Forex Charts with WR Trading
WR Trading offers in-depth education for traders who want to learn how to recognize and trade using chart patterns.
By combining practical training with real-time market analysis, we provide a hands-on approach to mastering technical analysis and chart pattern recognition.
Understanding chart patterns is just one aspect of becoming a proficient trader, and WR Trading can help you refine your skills with detailed strategies, an abundance of educational resources, and ongoing mentoring.
(Never Trade In Uncertainty Again – Join The WR Trading Mentorship)
FAQs: Most Frequently Asked Questions On Forex Chart Pattern
Why are chart patterns important in forex trading?
Chart patterns help you to identify potential price movements and forex market trends. By analyzing the structure of price movements on a chart, you can predict the direction of future price action, whether it’s the continuation of a current trend, or a reversal. Patterns will aid you most when combined with other technical analysis tools.
What does a Double Top or Double Bottom pattern in forex look like?
A Double Top in forex trading occurs after a strong uptrend, where the price hits a resistance level twice and fails to break through it. This forms two peaks at the same price level, signaling a possible trend reversal to the downside. A Double Bottom is the opposite, because it forms after a downtrend when the price hits a support level twice without breaking it, indicating a potential bullish reversal.
What’s a Head and Shoulders Pattern? And Inverse Head and Shoulders?
The Head and Shoulders pattern highlights a likely bearish reversal, and it forms after an uptrend. It consists of three peaks: the middle peak (head) is the highest, and the two outside peaks (shoulders) are lower. When the price breaks the neckline (support level), the pattern is complete, and the forex market is expected to trend downward. The Inverse Head and Shoulders is the opposite, as it signals a bullish reversal and forms after a downtrend.
How accurate are wedge patterns in predicting future price movements?
Wedge patterns (both rising and falling) are fairly reliable in identifying price breakouts in forex trading, but their accuracy depends on the overall trend and forex market conditions. A rising wedge usually forecasts a bearish reversal when price is in an uptrend, while a falling wedge typically denotes a bullish reversal in a downtrend. The key is to watch for a breakout from the wedge’s boundary (trendline) and confirm the move with indicators like volume or momentum.
Can I use chart patterns for both short-term and long-term forex trading?
Yes, chart patterns can be applied to both short-term and long-term forex trading, but their effectiveness may vary depending on the time frame. In scalping or day trading, short-term patterns like flags or pennants are commonly used to capitalize on quick price movements. For swing trading or position trading, patterns like Double Top/Bottom, Head and Shoulders, and Cup and Handle work better to capture larger price swings over a longer period.
What about managing risk when trading chart patterns?
Risk management is crucial when trading chart patterns in forex, and some key strategies would include using stop-loss orders (placing stop-loss orders just beyond the pattern’s breakout point to limit potential losses if the pattern fails), position sizing (this means you only risk 1 – 2% of your trading capital per trade to avoid significant losses), looking at the risk-to-reward ratio (aiming for at least 1:2 or higher), and confirming your charts with indicators (combining chart patterns with other technical indicators like the RSI or MACD to confirm the trade’s validity).
What is the best time to trade based on chart patterns?
Chart patterns can form at any time, but they are often more reliable during periods of higher volatility, such as during the London and New York trading sessions. The best time to trade chart patterns is when there is enough liquidity and volume to confirm the breakout or reversal, especially after key economic releases or news events. Patterns that form in low-volume periods in forex may be more prone to false breakouts.
Do I need advanced charting tools to trade chart patterns?
While advanced charting tools can enhance your analysis, you don’t need expensive software to trade chart patterns. Most forex brokers offer free charting platforms (e.g., MetaTrader 4/5) that allow you to draw trendlines and identify common chart patterns. It’s more about understanding the structure of the patterns and knowing when to enter and exit based on the visible price action.