Supply and demand zones are places on a price chart where the market often stalls before reversing. Certain buying and selling pressures are at these levels, where traders seek to capture explosive movements. Let’s explore how to trade supply and demand zones the right way.
Key Facts about Supply and Demand Zones
- Supply and demand zones are areas on a chart where prices have moved significantly in the past (with the expectation that the same place will produce a similar move in the future).
- This trading strategy relies on several theories. The first includes the economic concept of supply and demand. Another popular one concerns the beliefs of so-called ‘smart money’ or institutional traders and how they execute trades.
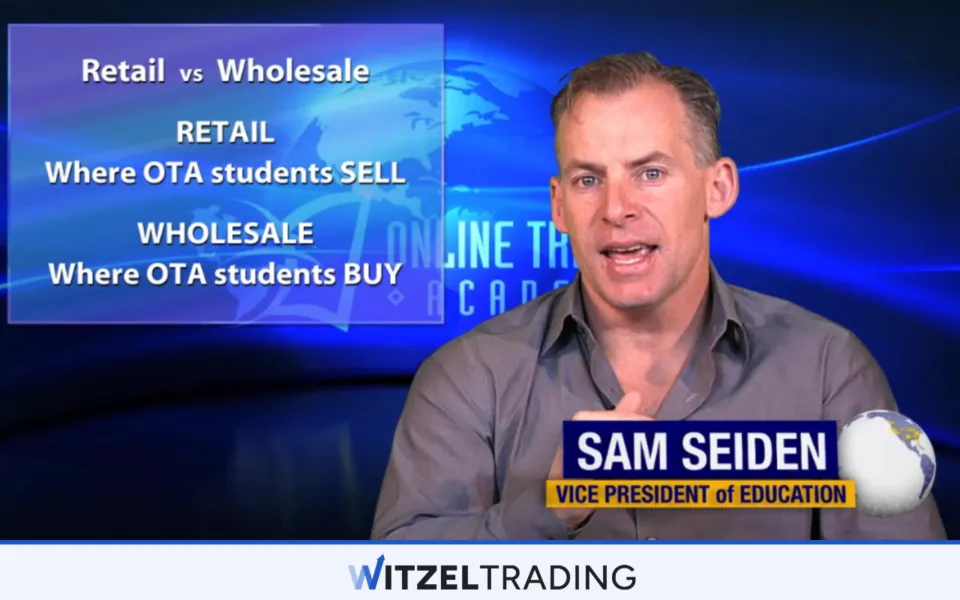
- Many credit Sam Sieden as the trader who made this strategy popular in the early 2010s.
- Supply and demand trading works best when a combination of higher time-frame analysis, price action patterns, and other confidential elements is used.
(Never Trade In Uncertainty Again – Join The WR Trading Mentorship)
What Are Supply And Demand Zones?
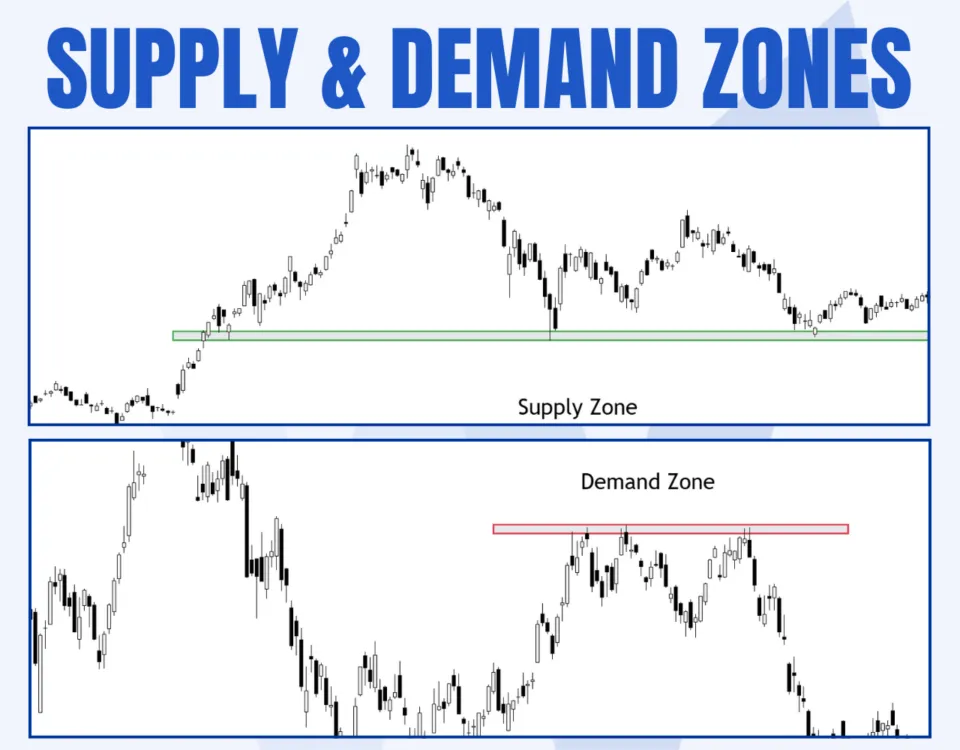
Supply and demand zones are a broader concept of support and resistance, indicating levels on a chart where strong buying or selling activity has previously caused a reversal.
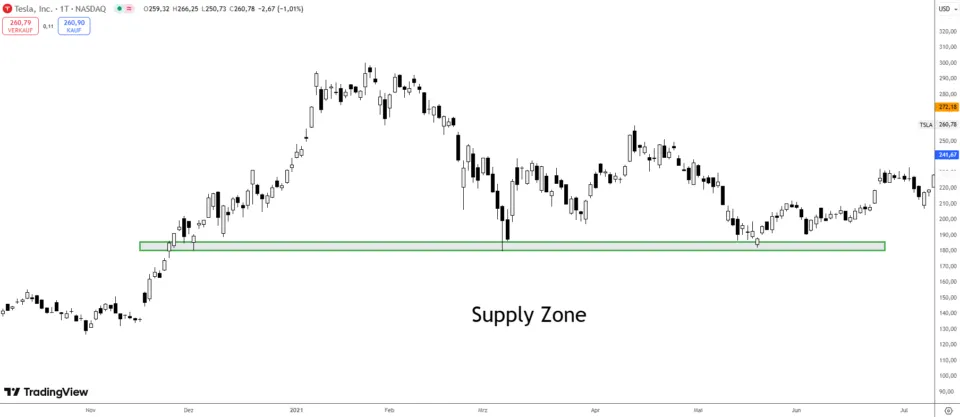
- Supply Zone: Represents areas with a high concentration of sellers, often leading to price drops when revisited.
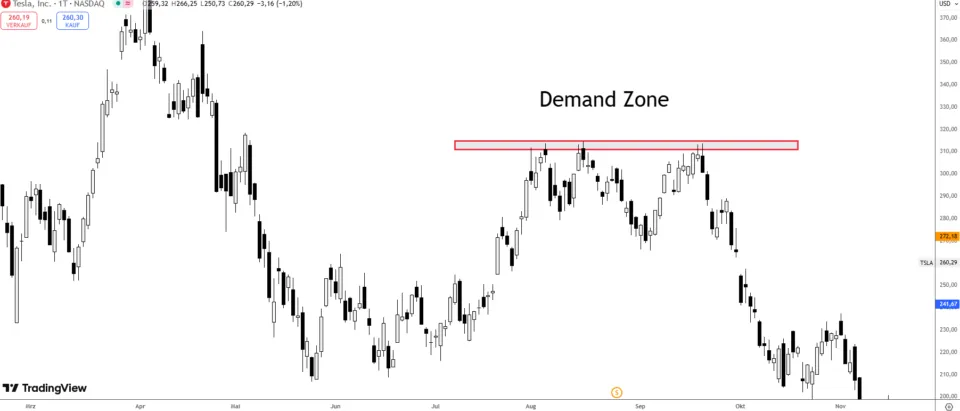
- Demand Zone: Denotes areas with a high concentration of buyers, causing price rises when tested again.
These zones are grounded in the economic principle of supply and demand:
- When supply exceeds demand (more sellers than buyers), prices fall.
- When demand surpasses supply (more buyers than sellers), prices rise.
Analysts sometimes indicate that equilibrium can occur (when supply and demand are balanced). This would result in range-bound conditions or sideways price movements in the trading context.
How To Identify Supply And Demand Zones
Here is a practical guide to identifying these zones:
- Choose a higher time frame (from 4HR and above): supply and demand zones become stronger as you go up in time frame. While they become less frequent, they are usually more reliable the higher the reference. Also, you get a better zoomed-out view.
- Next, look for areas where the market stalled or bounced before producing a strong move in the opposite direction. This can happen immediately or after a consolidation period. You can also find multiple smaller zones within bigger zones. This is why using higher time frames helps you better identify strong areas.
Finally, ensure the starting point of your zones isn’t older than three months. Recency is vital when identifying supply and demand zones. Generally, the market places more significance on a recently formed zone compared to one which may have formed over three months ago. Put simply, the theory indicates that ‘smart money’ wouldn’t wait for a long time to execute their trades.
- You will draw rectangles in a colour of your choice which highlight the identified area. If you find a zone with three or more clear support/resistance points, your rectangle should cover all of them. Finally, mark each zone as a line according to its precise support and resistance level (this will become effective soon).
How To Trade Supply And Demand Zones?
Now comes the hard part – trading supply and demand zones! So, what are the steps?
- While not always a requirement, you should consider the prevailing trend. Supply and demand zones are technically reversals. So, many will choose to trade zones in the direction of the current trend (where they act as a continuation).
- Once the market has entered the zone, you should wait for it to reach the marked support or resistance level. While we seek for zones, the price will, more often than not, touch and spike through a specific support or resistance point.
Remember what we mentioned ‘stop loss hunting?’ It’s commonly believed that many traders place their stop losses at exact levels (or just above a specific support and resistance). The theory is that the smart money ‘hunts’ for these stops. Hunting for these orders makes theirs stronger (which explains why the move that follows from a zone is often forceful).
One should expect to see patterns where there are candles with small bodies and long wicks e.g., pin bars, hammers, spinning tops.
- A trader can consider entering once they see the relevant price action. Some traders may execute as soon as they see the latter. Still, you could also wait a while and enter with a pending order using a Fibonacci level.
Another common occurrence with supply and demand zones is that the market rarely moves immediately after entering them. You can expect further consolidation. Consider drawing your Fibonacci from the nearest support or resistance to the most significant swing low/high, and place a pending order between the 50-78.4% or 23.6-50% levels.
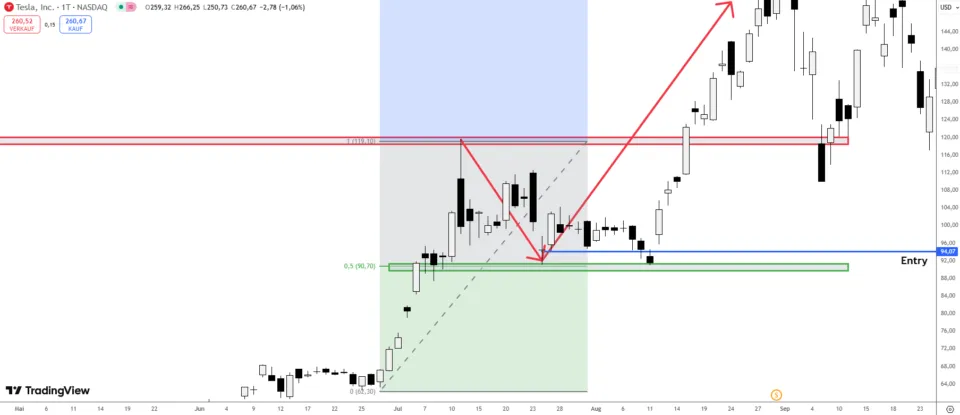
- You can place your stop at the nearest support or resistance level or add a ‘buffer’ where it is some distance beyond. Regardless, your risk-to-reward ratio should be a minimum of 1:3. This means where you plan to exit should be at least three times greater than the size of your stop loss.
(Never Trade In Uncertainty Again – Join The WR Trading Mentorship)
The Theory Behind Supply And Demand Zones
The supply and demand trading strategy is widely credited to Sam Seiden since the early 2010s. Knowing this is useful for understanding some key aspects of identifying zones and another element linked to them: ‘smart money.’
Based on his experience, Seiden believes traded markets consist of large or institutional players (the ‘smart money’). These players are ‘smart’ because they use certain techniques to fool retail or ordinary traders. According to him and other proponents of supply and demand, the ‘smart money’ is largely responsible for the formation of zones.
The belief is that they enter into trades incrementally due to the huge size of their orders. This contrasts with the average trader who doesn’t trade as much size. Thus, their orders won’t cause any noticeable shift in price. So, supply and demand enthusiasts believe the approach differs for the ‘smart money.’
Entering trades in chunks is more effective as it won’t cause a sudden shift in value. Furthermore, the theory is that they would employ techniques like ‘stop loss hunting’ to enter greater positions. This is believed to be why you will often see candle spikes in supply and demand zones.
Which Signals To Use When Trading Supply And Demand
The steps outlined previously are basic – adding confluence is always what truly matters. No trader should execute a trade based on a zone alone. Let’s list the confirmation factors to consider:
- Key support and resistance levels – these attract the significant buying or selling interest necessary to create the zone.
- Trend alignment – trading a zone in the direction of the dominant trend generally decreases the likelihood of a failed setup.
- Candlestick patterns – certain candle formations indicate rejection at key levels and precede the explosive moves from a supply or demand zone.
- Technical indicator analysis – indicators can provide different information for a particular zone. For instance, moving averages can act as ‘dynamic support and resistance’; the Relative Strength Index may provide momentum divergence, which signals the potential for a reversal.
- Price structure – you should observe several types of zones like the rally base-rally and rally-base drop. Regardless, smart traders will want to see consolidation or a break of a high/low structure to confirm the strength of a zone.
- Market sentiment or news – a specific high-impact economic release (like an Fed interest rate decision) may be the fuel needed for a huge move from a zone.
Tips When Trading Supply And Demand
Here are some quick-fire tips (some of which we’ve covered) for trading supply and demand.
- Master the identification of zones
- Wait for the return to a zone
- Look for confluence
- Practice proper risk management
- Avoid multiple-tested zones
- Monitor high-impact news events
- Have and stick to your trading plan
- Adapt to different market conditions
- Consider dynamics around zones like momentum, trend, and volume
Best Currency Pairs For Supply And Demand Trading
Generally, all major and cross currency pairs will provide decent supply and demand zones. Major or USD-based pairs (e.g, EUR/USD, GBP/USD, USD/JPY, etc.) are generally the most preferred.
This is because they offer the highest liquidity with balanced volatility and price movements. Supply and demand traders prefer markets that produce ‘stable’ zones. When volatility is too high, it can cause erratic behaviour, making your entries unpredictable.
Learn Forex Trading With WR Trading
Although supply and demand zones apply to all markets, they are quite popular in forex. When skillfully done, this trading strategy can provide excellent profit opportunities. Still, there is more to learn to master for traders to have the best success – this is where WR Trading comes in! Our comprehensive trading education regarding Forex Trading is designed for smarter, profitable trading.
Key focus areas include high risk-reward ratio analysis, trading plans, low time commitment, and knowing exactly when to (and not to) trade. Our course has three modules, taking traders from the basics to profitable trading with proven results.
(Never Trade In Uncertainty Again – Join The WR Trading Mentorship)
Conclusion
This guide should equip you with the foundation for trading supply and demand correctly. As with any strategy, many nuances are involved, ranging from the quality and types of zones to the market context around them. We always preach that combining other factors (i.e., confluence) makes any trading approach more accurate. This is what ultimately gives you a sustainable trading edge.
Frequently Asked Questions on Supply and Demand Zones
Should you use supply and demand zones?
While indicators designed to identify zones can compliment your analysis, you should always use the manual approach as the primary method.
Do supply and demand zones apply to all financial instruments?
Yes, they work in forex, stocks, cryptocurrencies, commodities, metals, etc.
How do I know if a supply and demand zone will hold or fail?
Unfortunately, there is no foolproof method. Still, traders will consider the number of times a zone has been tested, the strength of the move away from a zone, and other confirmation factors.