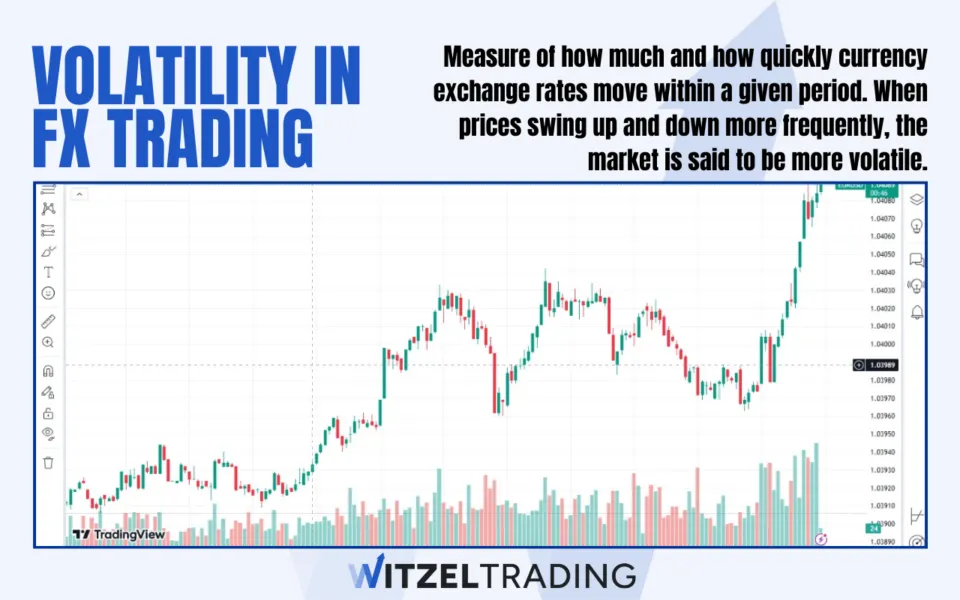
Market volatility in forex is the measure of how much and how quickly currency exchange rates move within a given period. When prices swing up and down more frequently, the market is said to be more volatile. In other words, volatility captures the intensity of price changes: a currency pair with high volatility may climb or drop sharply in a short time, while a pair with low volatility tends to move more steadily.
Key Facts About Volatility in Forex
- Measurement of Price Swings: Volatility measures how much a currency pair’s price moves away from its average level over a specific period, showing traders how “choppy” or stable the market has been.
- High vs. Low Volatility: High volatility means larger and more frequent price swings, which can quickly shift profits or losses, while low volatility indicates steadier price action with fewer abrupt changes.
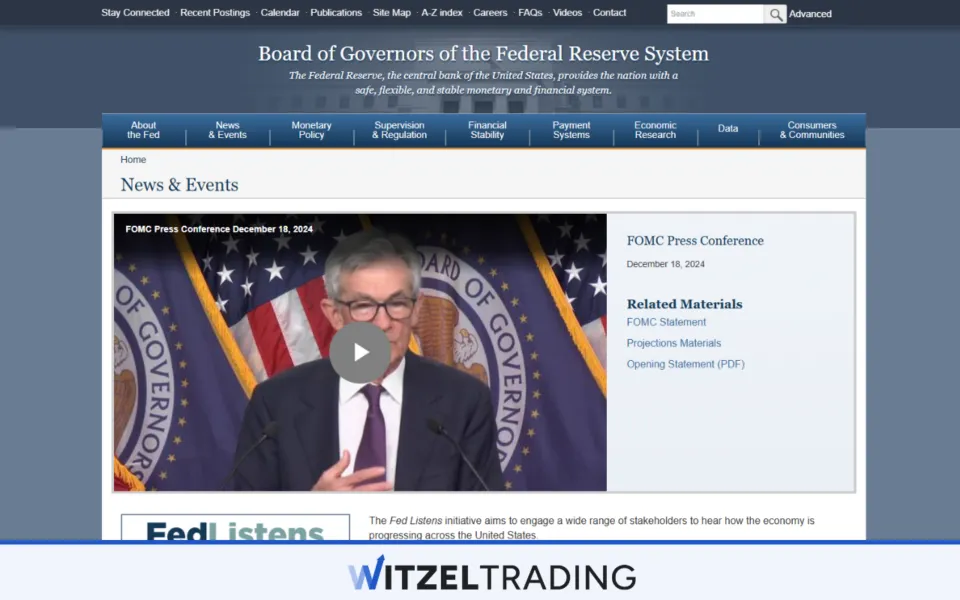
- Economic Events as Triggers: Major announcements, such as central bank interest rate decisions, employment data, or GDP releases, often increase volatility by suddenly changing how traders value a currency.
- Influence of Market Sessions: Different trading sessions tend to have their own volatility patterns. Overlapping sessions, like London and New York, can increase volatility as more traders enter the market simultaneously.
- Volatility and Liquidity Connection: Markets with high liquidity, where lots of buyers and sellers are active, generally see smaller jumps in price. Lower liquidity makes it easier for a single large trade or unexpected event to cause big price moves, increasing volatility.
(Never Trade In Uncertainty Again – Join The WR Trading Mentorship)
Which Factors Cause Volatility in the Forex Market?
Volatility in the forex market doesn’t appear out of thin air. Instead, it’s influenced by a range of underlying factors that shape how traders feel and react to changing conditions. By understanding these drivers, you’ll gain insight into why certain currencies can swing wildly while others remain relatively steady. Below are some of the key factors that contribute to fluctuations in exchange rates, each explained in detail.
1. Economic Indicators and Reports
Economic data like GDP figures, inflation rates, employment numbers, and manufacturing output can catch the market off-guard. When results differ significantly from forecasts, traders reevaluate their positions and the future outlook for interest rates or economic strength. This recalibration can translate into a sudden increase in volatility, especially if the surprise data implies a major policy change or signals that the economy’s trajectory is not what everyone assumed.
Although most indicators are released on predictable schedules, the magnitude of their impact varies. The more essential the data is to understanding a nation’s economic direction, the stronger the price reactions tend to be. Over time, consistent surprises (positive or negative) can reset market baselines, influencing how traders approach future data releases and ultimately shaping long-term volatility patterns.
2. Central Bank Monetary Policies
Central banks directly steer currency values through interest rates, asset purchases, and statements about future policy plans. Markets pay close attention to the timing and direction of these moves: a rate hike can strengthen a currency, while an unexpected cut can weaken it. Even subtle hints in speeches or policy minutes can create volatility if they suggest a deviation from the market’s prior expectations.
Uncertainty around central bank decisions intensifies this effect. If traders are unsure whether a central bank will act, speculation alone can drive price swings. Once the decision is announced, any surprise element leads to rapid position adjustments and potentially sharp, immediate fluctuations.
3. Political and Geopolitical Events
Political stability supports predictable economic environments, and when that stability is called into question, currencies tend to react volatile. Elections, sudden policy changes, trade disputes, and international conflicts can all create uncertainty. Traders may sell a currency if they believe political turmoil will affect economic performance or deter foreign investment.
Such events often trigger prolonged volatility as markets reassess the long-term implications of a leadership change or a new trade barrier. Sometimes, even the anticipation of a political shift, like a critical vote, rattles markets. The more uncertain the outcome or its effects, the stronger and more drawn-out the resulting price swings.
4. Market Sentiment and Investor Psychology
Beyond hard data, the collective mindset of traders influences volatility. Optimism can lead to buying frenzies, while fear sparks sell-offs. Sentiment can shift quickly in response to rumors, breaking news, or unexpected developments. This crowd behavior sometimes amplifies price moves beyond what fundamentals alone might justify.
Because sentiment is driven by perception, it can create feedback loops. A sudden drop in price may erode confidence further, causing more selling, and intensifying volatility. Conversely, a surprising piece of good news might spark over-enthusiasm, pushing prices too high and setting the stage for a big correction once reality sinks in.
5. Liquidity and Trading Sessions
Liquidity – how easily trades can be executed without large price moves – affects volatility directly. During active trading sessions, orders flow smoothly, and sudden swings are less common. However, in quieter periods, even moderate orders can move prices significantly, increasing the likelihood of abrupt spikes.
Moreover, unexpected liquidity shortfalls can magnify volatility. If there are fewer participants to absorb trades, sudden bursts of buying or selling have a bigger impact, causing sharp and rapid price adjustments.
6. Global Trade and Commodity Prices
Currencies represent economies, and economies rely on trade. Changes in export demand, commodity price fluctuations, or supply chain disruptions can cause traders to reprice currencies as they gauge how these shifts will affect a nation’s growth, inflation, and overall economic health. For example, a commodity-exporting country’s currency may rise and fall with shifts in the value of oil or metals.
These adjustments can be fast and substantial if markets perceive that the underlying economic balance is shifting. A sudden change in trade policy or a steep drop in a key commodity’s price may prompt traders to exit long-held positions or enter new ones, creating volatility until the market finds a new equilibrium.
(Never Trade In Uncertainty Again – Join The WR Trading Mentorship)
How Volatility Can Be Measured?
Volatility measurement in forex is about turning raw price fluctuations into meaningful insights. Since volatility represents how much and how quickly prices change, traders use various tools to see the market’s “mood.” Some methods focus on the statistical spread of past prices, while others look at current trading ranges or rely on indicators that adapt to shifting conditions.
Below is a simple, step-by-step guide on how to measure volatility using the standard deviation formula. We’ll break it down into small steps and then go through a clear example.
The Formula for Standard Deviation:
Standard Deviation =iN=1(ri-ravg)2N-1
ri = Each individual return (for example, a weekly return)
ravg= The average (mean) return of all the returns
N = The total number of returns you are using
How to Measure Volatility Step-by-Step (with Example):
- Find the average return ravg: Add up all your returns and divide by how many returns you have.
- Find each return’s difference from the average: For each return ri, subtract the average ravg. This shows how far that return is from the average.
- Square each difference: Multiply each difference by itself. This makes all differences positive and gives more weight to bigger differences.
- Add up all the squared differences: This gives you the total variation.
- Divide by (N-1): Take the total from step 4 and divide it by one less than the number of returns.
- Take the square root: Finally, take the square root of the number you got in step 5. The result is your volatility.
Let’s take a currency pair over a 5-week period that has experienced up to 4% in price changes during this time.
- Week 1: 2%
- Week 2: 4%
- Week 3: 1%
- Week 4: 3%
- Week 5: 2%
Step 1: Find the average (mean) return:
- Add them: 2% + 4% + 1% + 3% + 2% = 12%
Number of returns (N) = 5 - Divide by 5 (the number of weeks):
Average ravg = 12% ÷ 5 = 2.4% - Average ravg = 2.4%
Step 2: For each return, subtract the average:
- Week 1: 2% – 2.4% = -0.4%
- Week 2: 4% – 2.4% = 1.6%
- Week 3: 1% – 2.4% = -1.4%
- Week 4: 3% – 2.4% = 0.6%
- Week 5: 2% – 2.4% = -0.4%
Step 3: Square each difference:
- (-0.4%)² = 0.16%²
- (1.6%)² = 2.56%²
- (-1.4%)² = 1.96%²
- (0.6%)² = 0.36%²
- (-0.4%)² = 0.16%²
Step 4: Add the squared differences:
0.16%² + 2.56%² + 1.96%² + 0.36%² + 0.16%² = 5.2%² total
Step 5: Divide by (N-1):
N = 5, so N-1 = 4
5.2%² ÷ 4 = 1.3%²
Step 6: Take the square root:
Square root of 1.3%² ≈ 1.14%
After inputting the numbers into the formula and completing the calculations, you’ll receive the volatility figure. In our example, the calculated volatility would be 1.14%, giving you a clear sense of the market’s activity level.
(Never Trade In Uncertainty Again – Join The WR Trading Mentorship)
Why Volatility Can Be Risky for Forex Traders
Volatility might sound exciting because it creates opportunities, but it also brings challenges that can catch traders off guard. When price movements accelerate and become less predictable, it’s harder to manage risk and maintain a solid strategy. Below are some reasons volatility can increase the difficulties and dangers for forex traders.
- Unpredictable Price Swings: Fast and irregular price changes make it difficult to plan entries and exits. Even if you’ve done your research, a sudden and sharp shift in price can turn a potentially good trade into a losing one before you can react.
- Wider Bid-Ask Spreads: During highly active periods, the difference between the buying price and the selling price can grow bigger. This means you pay more just to open or close a trade, increasing your costs and cutting into potential profits.
- Frequent Price Gaps: Price gaps occur when a currency pair “jumps” from one price level to another without passing through the levels in between. These gaps can force you into a bad exit point if you have open positions, making it harder to protect your balance.
- Inconsistent Market Signals: Indicators and strategies that normally work well may give mixed or confusing messages during volatile times. Traders might follow a reliable pattern, only to see it fail when volatility spikes.
- Increased Emotional Stress: Fast-moving prices can put traders on edge, tempting them to make rash decisions. Acting out of fear or excitement rather than sticking to a trading plan often leads to poor results.
- Risk of Margin Calls: If trades move against you more quickly than expected, you may not have enough funds in your account to cover the losses. This could trigger a margin call, forcing you to close positions at bad prices just to meet your broker’s requirements.
- Shortened Reaction Times: Volatile markets rarely give you the comfort of careful thinking. You might need to respond faster, but rushing often leads to mistakes like entering a trade without checking all the details first.
- Difficulty Setting Stops and Targets: Placing stop-loss orders or profit targets becomes tricky. If they’re too tight, normal price noise might knock you out early. If they’re too loose, you might suffer bigger losses or miss out on profits.
How Do Liquidity and Volatility Influence Each Other?
Liquidity and volatility maintain a two-way relationship that can change market conditions for currency traders. Liquidity means having plenty of buyers and sellers active at any given time, allowing trades to happen smoothly and at prices close to what you’d expect. When forex markets are liquid, it’s harder for a single trade to push prices dramatically off course, which usually helps keep volatility lower. In other words, stable liquidity levels often keep sudden price jumps under control, giving traders more confidence in the predictability of price movements.
On the other hand, if liquidity dries up, it becomes more challenging for the market to handle trades without big price shifts. With fewer traders willing to take positions, a bigger-than-average order can trigger a noticeable move, and this can happen more frequently.
As volatility rises, some traders may decide to step back, reducing the number of buyers and sellers even more. This cycle can feed on itself, making the market feel more chaotic.
Which Indicators Can Be Used to Measure Forex Volatility
There are several well-known technical indicators that traders use to gauge how much a currency pair’s price is moving around its average levels. These tools can help you understand if the market is experiencing calm, steady movements or sudden, unpredictable shifts. Here are the main indicators:
Average True Range (ATR)
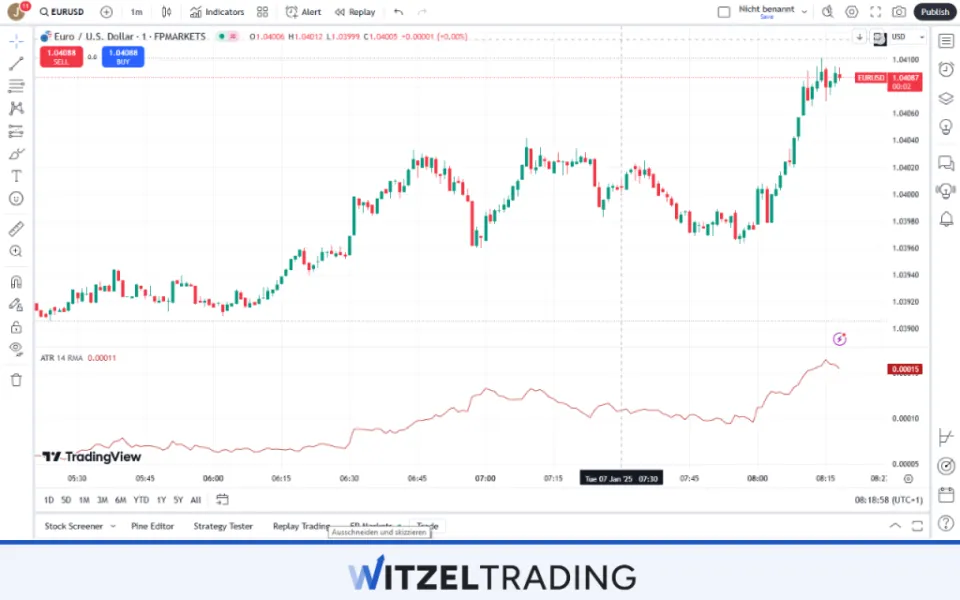
The Average True Range measures market volatility by looking at how much prices move between sessions. Instead of focusing on just the difference between daily highs and lows, ATR takes into account gaps and previous closing prices. This creates a more realistic picture of how far prices travel over a given period, which can be helpful when deciding where to place stop-loss orders or when to scale back trading during choppy times.
One reason traders like the ATR is that it adapts to different market environments. For example, if volatility starts picking up, the ATR will naturally increase to reflect that fact, showing you that conditions are changing. If price fluctuations quiet down, the ATR shrinks, signaling a calmer market. Because it’s based on actual price movements, ATR is straightforward and less likely to mislead you with false signals.
Bollinger Bands
Bollinger Bands consist of a moving average line in the center, with two bands placed above and below it. These bands expand and contract based on recent price changes. When volatility is high, the bands widen, and when the market grows quieter, they narrow. This visual representation makes it easy to see at a glance if conditions are shifting.
Bollinger Bands can also help you spot potential trading opportunities. If the bands suddenly tighten, it might signal that a big price move could be coming once the market breaks out of its tighter range. Similarly, when the bands expand, it can mean prices are swinging more widely, and traders might need to be more cautious with their entries and exits.
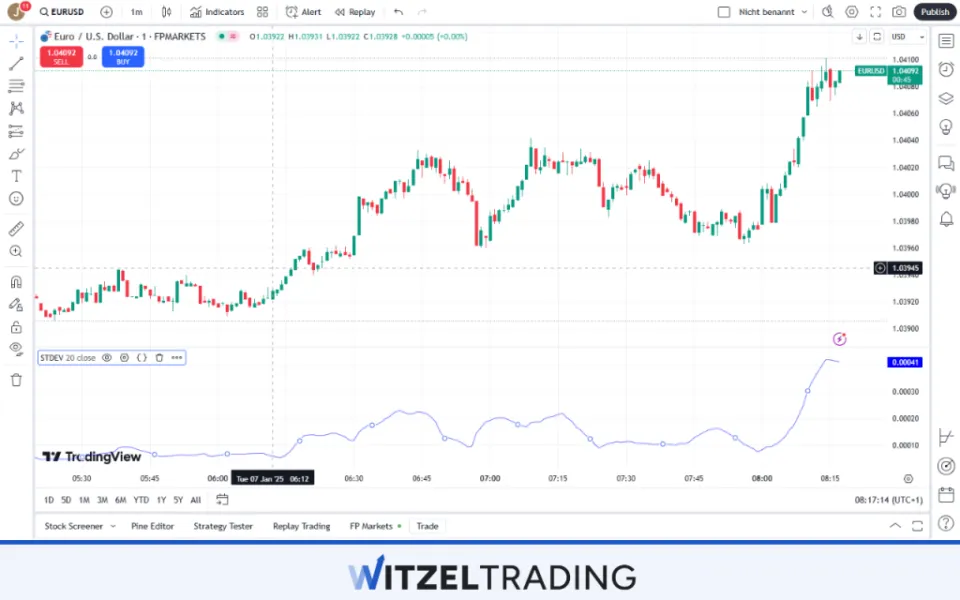
Standard Deviation
Standard Deviation measures how far prices stray from their average, making it a direct way to quantify volatility. If the market’s prices have been moving tightly around a mean value, the standard deviation will be low. But if prices are all over the place, this number will climb, indicating an unstable environment that can throw off many trading strategies.
This measure can be useful if you like to use statistical concepts in your trading. Some strategies rely on the idea that prices often revert to the mean. When the standard deviation runs high, it may hint that prices are stretched and could snap back. On the flip side, a low standard deviation suggests that prices aren’t drifting too far from their average, possibly indicating more predictable trading conditions.
Keltner Channels
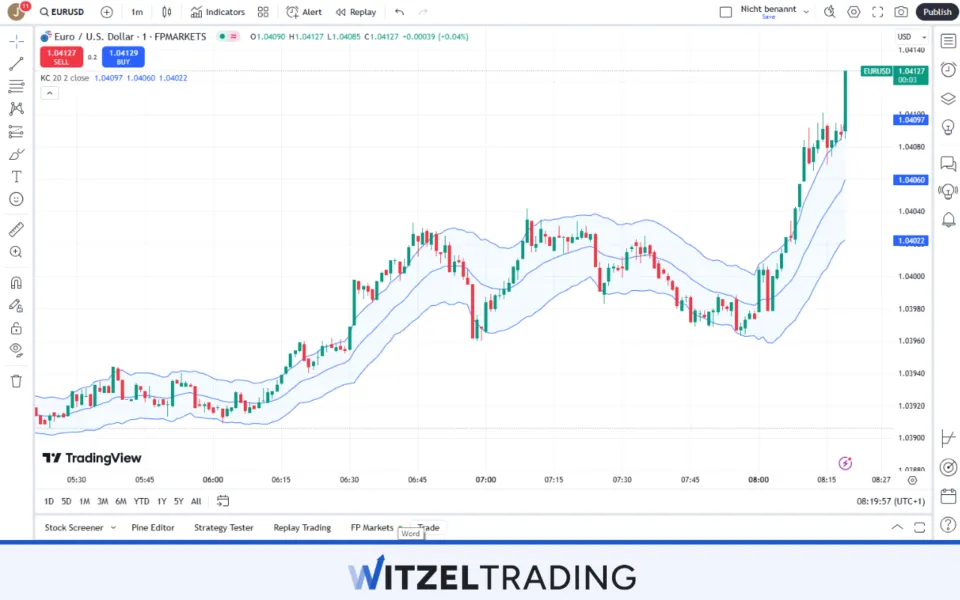
Keltner Channels are another volatility-based overlay placed on top of price charts. They use an exponential moving average as a base, then add and subtract a multiplier of the Average True Range to create the channel lines. As a result, these channels adjust as volatility changes, making it easier to identify when the market is becoming more active or settling down.
Traders like Keltner Channels because they can help highlight when a currency pair’s price is stepping outside its normal trading range. If the price moves above the upper channel or below the lower channel, it may suggest a momentum-driven trend is forming. By observing how often and how far price stretches beyond these boundaries, traders can gain insights into both short-term volatility shifts and longer-term market trends.
Volatility Indices and Composite Approaches
Some tools aggregate data from multiple currency pairs to provide a broader view of overall market conditions. These are called volatility indices. They summarize the average volatility of major currencies and help traders see the overall mood of the forex market – whether it’s relatively calm or experiencing widespread volatility.
- CBOE Volatility Index (VIX): Commonly known as the “fear gauge,” the VIX measures the market’s expectation of 30-day volatility for the S&P 500 Index. Although it’s for the equity market, the VIX is often used as a general indicator of market sentiment, which can indirectly influence forex markets.
Another method involves combining multiple volatility measures into a custom model. For example, traders might use the ATR, Bollinger Bands, and implied volatility together to gain a more comprehensive understanding of market conditions. This approach balances short-term price dynamics (via ATR), current market extremes (via Bollinger Bands), and future expectations (via implied volatility).
While advanced, these composite methods allow for a deeper analysis of volatility that a single measure may miss.
(Never Trade In Uncertainty Again – Join The WR Trading Mentorship)
What Are the Most Volatile Currency Pairs?
Some currency pairs are known for their bigger price swings. These volatile pairs tend to react strongly to news, economic data, and shifts in investor sentiment, creating highly volatile periods on which to capitalize.
GBP/JPY (British Pound/Japanese Yen)
The British Pound often represents an economy focused on growth, with investors watching interest rates and political developments to gauge its direction. The Japanese Yen is viewed as a safe haven, meaning traders turn to it during uncertain times because Japan’s financial system and economic policies are seen as more stable.
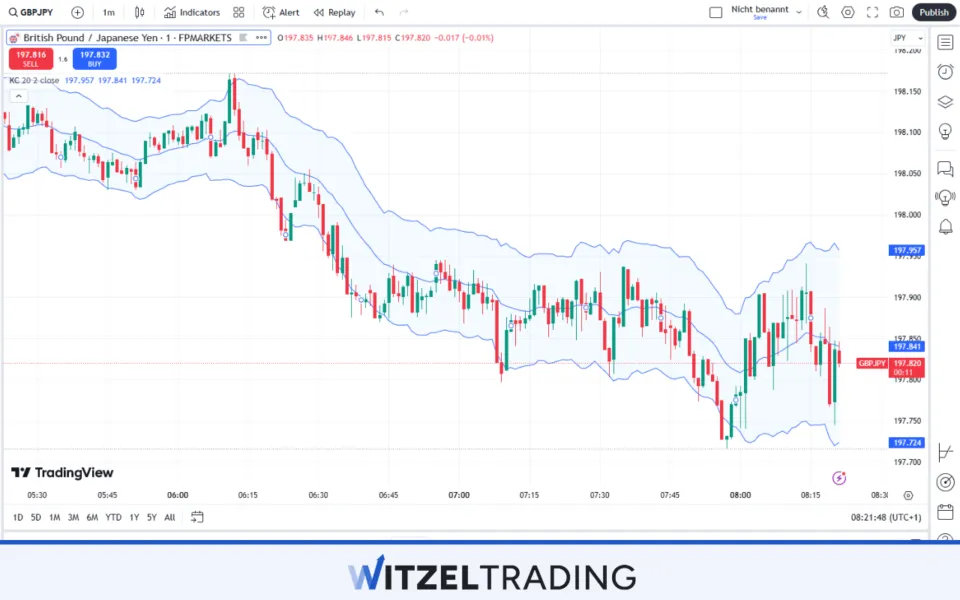
When global outlooks appear positive, the Pound gains favor as traders want higher returns, pushing GBP/JPY upward. If sentiment shifts and concerns emerge, traders may rush into the Yen for safety, sending the pair downward. This ongoing balance between growth-oriented expectations and safe-haven appeal makes GBP/JPY prone to rapid changes, and it becomes volatile when events raise doubts about the future direction of growth or stability in major economies.
USD/ZAR (US Dollar/South African Rand)
The US Dollar is backed by the largest economy in the world, the USA, and is often considered a benchmark of stability, while the South African Rand comes from a developing market where factors like commodities, regional policies, and shifts in global investor confidence play a more direct role in influencing value. Traders weigh the possibility of better returns in an emerging market against the reliability of holding Dollars.
When conditions favor higher-yielding assets, interest in the Rand increases. If that interest declines, the market pulls back toward the Dollar, causing abrupt changes in price. Volatility in USD/ZAR often becomes more extreme when global sentiment toward emerging markets changes without much warning. Traders adjust their positions rapidly if growth prospects alter, if commodity prices turn downward, or if policies in the region create uncertainty.
GBP/NZD (British Pound/New Zealand Dollar)
The British Pound connects to an economy with a broad range of sectors, while the New Zealand Dollar ties into a smaller, export-driven economy sensitive to global demand and trade conditions. Investors compare these differing economic profiles, looking at interest rates, growth forecasts, and signs of changing export markets.
When indications point toward stronger UK performance, traders lean toward the Pound. If conditions favor commodities and stable demand for New Zealand’s exports, the NZD gains value. This constant reassessment makes GBP/NZD capable of sudden changes when either economy’s outlook shifts.
USD/TRY (US Dollar/Turkish Lira)
The US Dollar is regarded as more stable, while the Turkish Lira is linked to an economy that can experience periods of changing investor confidence. Changes in inflation expectations, monetary policy decisions, or perceived economic stability affect whether traders favor the Lira or retreat to the Dollar.
Therefore, as conditions in Turkey’s markets appear uncertain, the pair can swing widely as traders leave positions in the Lira and reallocate to Dollars. On the other hand, if sentiment improves, the pair can move sharply the other way.
Conclusion: Volatility Is a Key Factor in Forex Trading
Volatility is a key factor in Forex Trading, rapidly influencing currency prices. Although we’ve shown how volatility can be calculated step-by-step through methods like standard deviation, using specialized volatility indicators often proves more efficient. Indicators provide a quick, visual snapshot of current market conditions, allowing you to adapt your approach on the fly.
However, if you’re unsure how to use indicators for forex trading, we offer a premium course on WR Trading that will guide you every step of the way. It comes with weekly webinars, proven strategies, and only requires a time commitment of only 1 to 2 hours per day.
(Never Trade In Uncertainty Again – Join The WR Trading Mentorship)
Frequently Asked Questions on Forex Market Volatility
What Is Market Volatility in Forex Trading?
Market volatility in forex refers to the size and speed of changes in currency prices over a certain period. It shows how much a pair’s exchange rate fluctuates around its average level. Higher volatility means prices can jump more rapidly, making the market feel more unpredictable.
Why Does Volatility Matter to Traders?
Volatility matters because it affects both the potential for profit and the likelihood of losses. Traders who understand volatility can plan their entries, exits, and risk management strategies more effectively. Without considering volatility, it’s harder to maintain control when prices swing unexpectedly.
How Can Traders Measure Volatility?
Traders use tools like the Average True Range, Bollinger Bands, or standard deviation calculations to understand how far prices move. These indicators transform raw price data into visual, easy-to-read signals.
What Causes Volatility to Increase in the Forex Market?
Big announcements, changing interest rate expectations, and economic data often create more significant price movements. When the market faces surprises or uncertainty, traders rush to alter positions, creating faster swings.
Does High Volatility Mean More Profit Opportunities?
High volatility can offer more chances to catch larger price moves, but it also carries added risk. Rapid swings mean profits can be made quickly, yet losses can accumulate just as fast. Successful traders learn to handle both outcomes and adjust their strategies accordingly.