The Advance Block candlestick pattern is a three-candle bearish reversal formation that typically appears during an uptrend.
At first glance, it may appear bullish – three consecutive green candles – but a closer look reveals a gradual loss of bullish momentum with each candle. The pattern’s defining feature is not in the color of the candles, but in their diminishing size, rising upper shadows, and a stalling advance – all pointing to a market that’s running out of steam.
When identified correctly, the Advance Block gives traders early warning of a potential trend reversal and a chance to position ahead of a possible shift from bullish to bearish conditions.
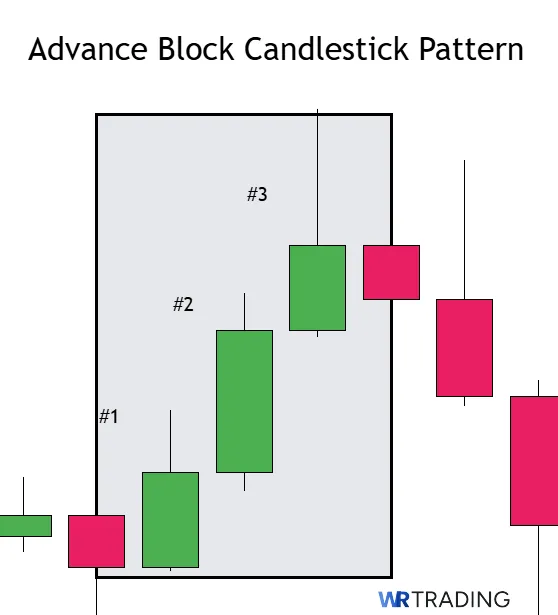
It consists of three consecutive bullish candles, each with progressively smaller real bodies and longer upper shadows, indicating a weakening of the bullish momentum, and a potential reversal to a downtrend.
Its Key Facts Comprise:
- Type of pattern: Bearish reversal
- Construction characteristics:
- First candle: Long bullish candle with little or no upper shadow.
- Second candle: Bullish candle opening within the real body of the first candle, closing higher but with a smaller real body and a longer upper shadow.
- Third candle: Bullish candle opening within the real body of the second candle, closing higher but with an even smaller real body and a longer upper shadow.
- Trend prior to pattern: Uptrend
- Trade forecast: Potential reversal to a downtrend
- Interpretation: Indicates weakening bullish momentum and increasing selling pressure.
- Stop-loss placement: Above the high of the third candle.
- Opposite pattern: Three Advancing White Soldiers (bullish continuation).
- lSuccess rate: Approximately 36% for predicting reversals
(Learn To Trade And Read Candlestick Patterns Like A Pro)
How is the Advance Block Candlestick Pattern Formed?
The Advance Block pattern forms during an uptrend and consists of three consecutive bullish candles. Each candle opens within the real body of the previous candle and closes higher, but the real bodies become progressively smaller, and the upper shadows become longer.
This formation suggests that while the price is still rising, the bullish momentum is weakening, and sellers are starting to exert more influence.
Is the Advance Block Candlestick Pattern Bullish or Bearish?
The Advance Block is considered a bearish reversal pattern. Despite consisting of bullish candles, the pattern indicates a potential shift from an uptrend to a downtrend due to weakening bullish momentum and increasing selling pressure.
What does the Advance Block Candlestick Pattern Mean?
The Advance Block pattern reflects a gradual shift in market sentiment from bullish to bearish.
The first candle shows strong buying pressure, but the subsequent candles reveal diminishing bullish strength and increasing resistance from sellers.
This pattern suggests that the uptrend may be losing steam, and a reversal could be imminent.
Where does the Name of the Advance Block Candlestick Pattern come from?
The term “Advance Block” refers to the pattern’s depiction of a slowing advance in price, where each bullish candle faces increasing resistance, effectively “blocking” the upward momentum.
An Example of the Advance Block Candlestick Pattern
Consider the EUR/GBP currency pair trading in an uptrend:
- Day 1: The pair opens at 0.8280 and closes at 0.8295, forming a long bullish candle.
- Day 2: It opens at 0.8295and closes at 0.8307, but with a smaller real body and a longer upper shadow.
- Day 3: It opens at 0.8307 and closes at 0.8314, with an even smaller real body and a longer upper shadow.
This sequence of candles forms the Advance Block pattern, indicating a potential reversal.
How to Identify the Advance Block Candlestick Pattern?
To identify the Advance Block pattern:
- Trend: Look for an existing uptrend.
- First candle: A long bullish (green) candle with little or no upper shadow.
- Second candle: A bullish candle opening within the real body of the first candle, closing higher but with a smaller real body and a longer upper shadow.
- Third candle: A bullish candle opening within the real body of the second candle, closing higher but with an even smaller real body and a longer upper shadow.
The progressively smaller real bodies and longer upper shadows indicate weakening bullish momentum.
(Learn To Trade And Read Candlestick Patterns Like A Pro)
How to Trade the Advance Block Candlestick Pattern?
Trading the Advance Block pattern involves several steps:
1. Find the Right Setup for the Advance Block Candlestick Pattern
Identify the pattern during an uptrend, preferably near resistance levels or after a significant price rally. This context increases the pattern’s reliability as a potential reversal signal.
2. Wait for the Appearance of the Advance Block Candlestick Pattern
Confirm the presence of the three-candle formation with the characteristics described earlier.
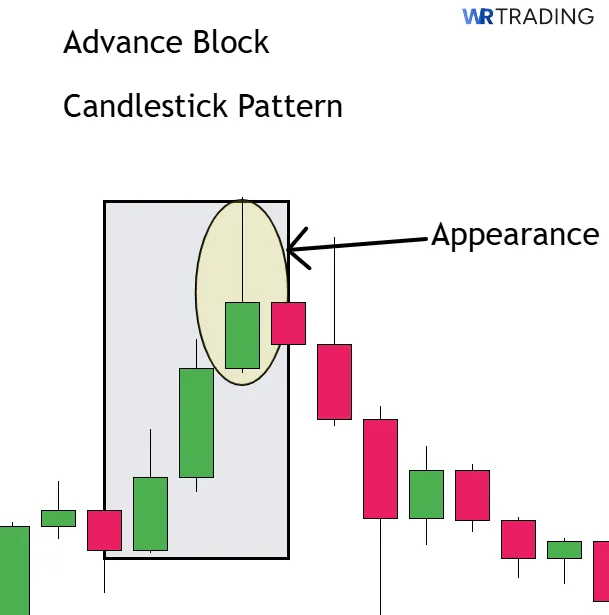
Ensure that each candle meets the criteria for the pattern.
3. Open Your Trade – Entry Point
After the pattern is confirmed, consider entering a short position.
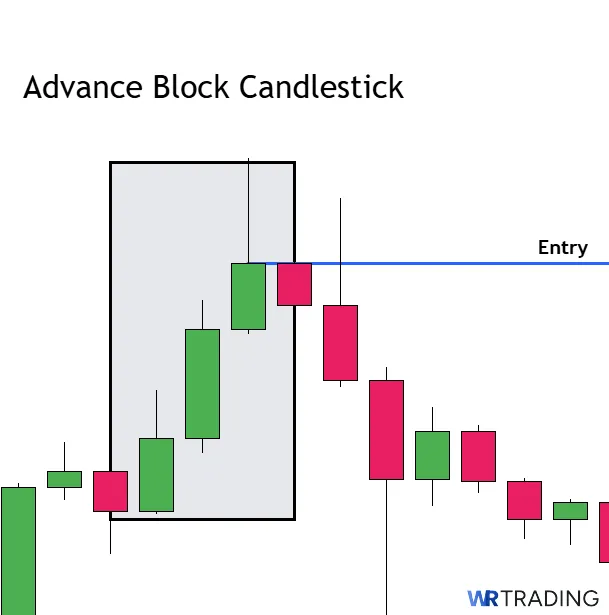
Place a stop-loss order at a point above the high of the third candle. Determine your position size based on your risk tolerance and trading plan.
4. Wait for a Confirmation or Not
Some traders wait for additional confirmation, such as a bearish candle following the pattern or a break below a support level, before entering a trade. Others may enter immediately after the pattern forms, depending on their strategy.
5. Choose your Trading Take Profit
Set your take-profit level based on key support levels, a predefined risk-reward ratio, or technical indicators such as Fibonacci retracement levels. Adjust your exit strategy as the trade progresses.
(Learn To Trade And Read Candlestick Patterns Like A Pro)
Which Strategies can be Used for the Advance Block Candlestick Pattern?
Several strategies can best be applied when looking to effectively trade the Advance Block pattern:
- Volume-based Strategy: Monitor trading volume during the pattern formation. Increasing volume with diminishing bullish candles may confirm weakening momentum.
- Breakout Strategy: Wait for a break below a key support level following the pattern to confirm a bearish reversal.
- Indicator-based Strategy: Use technical indicators like RSI or MACD to identify overbought conditions or bearish crossovers that align with the pattern.
- Support/Resistance Strategy: Identify the pattern near known resistance levels to increase the likelihood of a reversal.
- News-Based Strategy: Be aware of economic news or events that could impact market sentiment and validate the pattern’s signal.
What is the Success Rate of the Advance Block Candlestick Pattern?
The Advance Block pattern has a relatively low success rate in predicting reversals. According to research, it acts as a bearish reversal only 36% of the time, making it more likely to result in a continuation of the uptrend.
Therefore, it’s crucial to use this pattern in conjunction with other technical analysis tools and confirmation signals to improve its accuracy-indeed, this pattern cannot stand alone and inform your trade entries.
Is the Advance Block Candlestick Pattern Suitable for Beginners?
Yes, but with lots of caution, as it can be a useful tool for beginners to learn about candlestick patterns and market psychology. However, due to its low standalone reliability, beginners should use it alongside other indicators and confirmation methods to make well informed trading decisions.
What are the Pros and Cons of the Advance Block Candlestick Pattern?
Here are the detailled Pros and Cons of the Advance Block Pattern:
Pros
- Provides early warning of a potential trend reversal
- Helps in identifying weakening bullish momentum
- Can be used to set target and exit points
Cons
- Low success rate when used alone
- Requires confirmation from other indicators
- May often lead to false signals, especially in volatile markets
What are the Advantages of the Advance Block Candlestick Pattern?
The Advance Block pattern offers several advantages:
- Early warning: It signals a potential reversal before a significant price decline, allowing traders to adjust their positions accordingly.
- Risk management: By identifying weakening momentum, traders can set stop-loss orders and manage their risk more effectively.
- Improved decision-making: When combined with other indicators, the pattern can enhance the accuracy of trading decisions.
What are the Disadvantages of the Advance Block Candlestick Pattern?
Despite its benefits, the Advance Block pattern has limitations you need to be aware of:
- Low reliability: It has a low success rate in predicting reversals, especially when used in isolation.
- Requires confirmation: You’ll definitely need to use additional indicators or analysis to confirm the pattern’s signal.
- Complexity: Identifying the pattern accurately requires experience and understanding of candlestick formations.
Can the Advance Block Candlestick Pattern have Failure Signals?
Yes, the Advance Block pattern can produce false signals, more so than other patterns, in fact. Sometimes, the pattern may appear clear as day, but the price continues to rise, invalidating the reversal signal.
It’s thus essential to use alternative confirmation methods and similar patterns to validate the signal before making trading decisions.
Which Indicators can be Combined with the Advance Block Candlestick Pattern to Increase its Success?
Enhancing the reliability of the Advance Block candlestick pattern involves integrating it with other technical indicators. This combination aids in confirming potential bearish reversals and filtering out false signals.
Below are some indicators that, when combined with the Advance Block pattern, can improve trading outcomes:
- Relative Strength Index (RSI): The RSI measures the speed and change of price movements, indicating overbought or oversold conditions. When the Advance Block pattern forms and the RSI is above 70 (overbought), it strengthens the bearish reversal signal.
- Moving Averages (MA): Utilizing moving averages, such as the 50-day or 200-day MA, can help identify the overall trend. If the Advance Block pattern forms below a declining MA, it reinforces the bearish outlook.
- Volume Analysis: Observing volume can provide insights into the strength of a price move. A decreasing volume during the formation of the Advance Block pattern suggests weakening bullish momentum, supporting the potential for a reversal.
- Stochastic Oscillator: This momentum indicator compares a particular closing price to a range of its prices over a certain period. A stochastic value above 80 indicates overbought conditions. If the Advance Block pattern forms under such conditions, it may signal an impending bearish reversal.
- Bollinger Bands: These bands measure market volatility. If the Advance Block pattern forms near the upper Bollinger Band, it may indicate that the asset is overbought, aligning with the bearish reversal implication of the pattern.
By combining the Advance Block pattern with these indicators, traders can enhance the pattern’s effectiveness and make more informed trading decisions.
(Learn To Trade And Read Candlestick Patterns Like A Pro)
What are Similar Patterns to the Advance Block Candlestick Pattern?
Several candlestick patterns share similarities with the Advance Block pattern, primarily in signaling potential bearish reversals. By understanding these patterns, you gain additional tools for market analysis.
| Pattern Name | Description |
|---|---|
| Deliberation Pattern | Consists of three consecutive bullish candles with diminishing body sizes, indicating weakening bullish momentum. |
| Three Black Crows | Features three consecutive long bearish candles, each closing lower than the previous, signaling strong bearish reversal. |
| Evening Star | A three-candle pattern with a large bullish candle, a small-bodied candle, and a large bearish candle, indicating a reversal. |
| Dark Cloud Cover | A two-candle pattern where a bearish candle opens above the previous bullish candle’s close and closes below its midpoint. |
| Shooting Star | A single candle with a small body and long upper wick, appearing after an uptrend, suggesting a potential reversal. |
These patterns, like the Advance Block, are used to identify potential trend reversals and can be integrated into your trading strategies for better market timing. More patterns can be found in our advanced cheat sheet Candlestick Patterns PDF.
What is the Opposite Pattern of the Advance Block Candlestick Pattern?
The opposite of the Advance Block pattern is the Three White Soldiers pattern. While the Advance Block indicates a potential bearish reversal during an uptrend, the Three White Soldiers pattern signals a bullish reversal during a downtrend.
It consists of three consecutive long bullish candles, each closing higher than the previous, suggesting strong buying pressure and the potential start of an uptrend.
What is the Difference Between the Advance Block Candlestick Pattern and the Deliberation Candlestick Pattern?
Both the Advance Block and Deliberation patterns are three-candle formations that can signal potential bearish reversals. However, they have distinct characteristics:
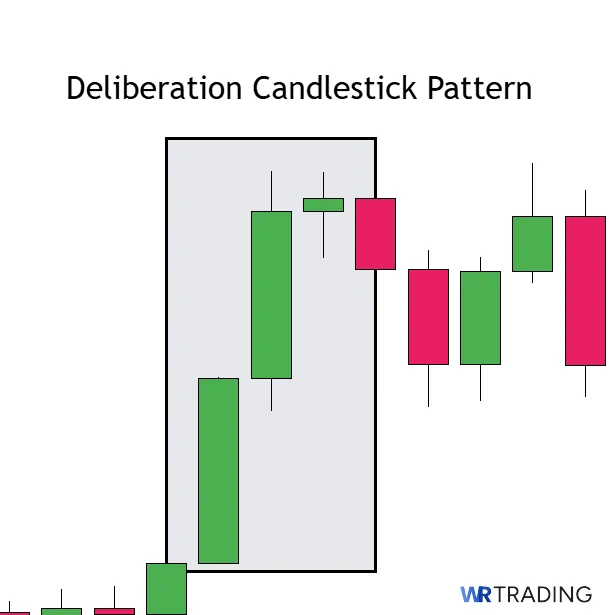
Advance Block Pattern: Features three consecutive bullish candles with progressively smaller bodies and longer upper wicks. This formation indicates that the bullish momentum is weakening, and a bearish reversal may be imminent.
Deliberation Pattern: Also consists of three bullish candles, but the first two have long bodies, and the third has a noticeably smaller body, often resembling a spinning top. This pattern suggests that the uptrend is losing strength, and a reversal could occur.
Here’s a comparison table:
| Feature | Advance Block | Deliberation |
|---|---|---|
| Number of Candles | 3 | 3 |
| Candle Bodies | Decreasing in size. | First two large, third small. |
| Upper Wicks | Increasing in length. | Not a defining characteristic. |
| Signal Strength | Moderate bearish reversal. | Moderate bearish reversal. |
| Market Context | Occurs during an uptrend. | Occurs during an uptrend. |
Understanding these differences can help you to interpret market signals more accurately and choose appropriate strategies based on the specific pattern observed.
What is the Difference Between the Advance Block and the Breakaway Candlestick Pattern?
While both the Advance Block and Breakaway candlestick patterns are used in technical analysis to identify potential market reversals, they differ in structure, formation, and implications.
The Advance Block pattern is a bearish reversal pattern that appears during an uptrend, consisting of three consecutive bullish candles, each with a progressively smaller body and longer upper wicks.
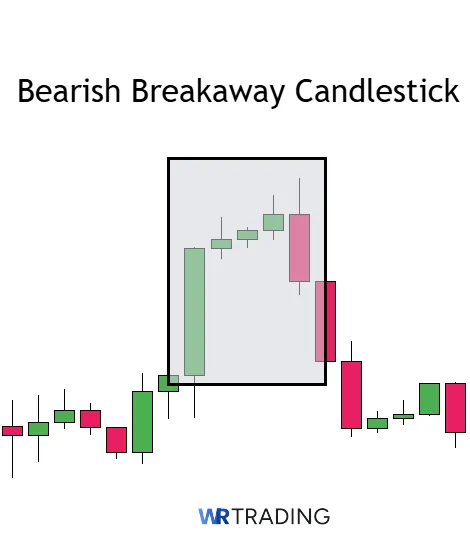
This formation suggests weakening bullish momentum and a potential shift to bearish sentiment (the pattern shows buyers are losing control, and sellers may begin to dominate, leading to a possible price decline).
In contrast, the Breakaway pattern can be either bullish or bearish, and typically marks the beginning of a new trend.
A bullish Breakaway pattern starts with a long bearish candle, followed by three small-bodied candles that move upward, and concludes with a long bullish candle that closes above the first candle’s open.
This sequence signifies a transition from a downtrend to an uptrend, while a bearish Breakaway pattern begins with a long bullish candle, followed by three small-bodied candles that move downward, and ends with a long bearish candle that closes below the first candle’s open, indicating a shift from an uptrend to a downtrend.
Here’s a comparison table highlighting the key differences:
| Feature | Advance Block | Breakaway |
|---|---|---|
| Trend direction | Occurs during an uptrend. | Marks the beginning of a new trend. |
| Number of Candles | Three | Five |
| Candle Characteristics | Three bullish candles with decreasing body size and increasing upper wicks. | First candle is long (bullish or bearish), followed by three small-bodied candles, and a final long candle in the opposite direction. |
| Implication | Bearish reversal | Trend reversal (bullish or bearish). |
| Reliability | Moderate, requires confirmation. | Higher, clearer indication of trend change. |
Understanding these distinctions helps traders interpret market signals more accurately and make informed trading decisions based on the specific pattern observed.
(Learn To Trade And Read Candlestick Patterns Like A Pro)
What are the Limitations of the Advance Block Candlestick Pattern?
While the Advance Block pattern can be a useful tool in technical analysis, it has several limitations that you must remain aware of:
- Subjectivity in identification: The pattern’s recognition can be subjective, as it requires interpreting the size and position of candlestick bodies and wicks, which may vary between traders.
- False signals: The pattern may produce false signals, especially in volatile markets, leading to potential losses if relied upon without additional confirmation.
- Requires confirmation: The Advance Block pattern often necessitates confirmation from subsequent price action or other technical indicators to validate the anticipated reversal.
- Limited predictive power: The pattern’s predictive power is not absolute; it may not always result in a trend reversal, particularly in strong bullish markets.
- l Not suitable for all timeframes: The effectiveness of the pattern may diminish on shorter timeframes due to market noise, making it more reliable on daily or weekly charts.
You need to consider these limitations and use the Advance Block pattern in conjunction with other analysis methods to enhance your trading accuracy.
Learn Pattern Trading with WR Trading Mentoring
Mastering candlestick patterns like the Advance Block requires more than just theoretical knowledge; it demands practical experience and expert guidance.
At WR Trading, we offer comprehensive mentoring programs designed to elevate your trading skills.
Our mentoring includes:
- In-depth pattern analysis: Learn to identify and interpret various candlestick patterns, including the Advance Block, within different market contexts.
- Strategic application: Understand how to integrate candlestick patterns into broader trading strategies, considering factors like trend analysis, support and resistance levels, and volume.
- Risk management techniques: Develop robust risk management plans to protect your capital while maximizing potential returns.
- Personalized coaching: Receive one-on-one coaching tailored to your trading style and goals, ensuring a personalized learning experience.
Join WR Trading Mentoring today and take the next step in your trading journey.
(Learn To Trade And Read Candlestick Patterns Like A Pro)
Conclusion: Navigating the Advance Block Pattern in Trading
The Advance Block candlestick pattern serves as a potential indicator of bearish reversals during uptrends, characterized by three consecutive bullish candles with diminishing body sizes and increasing upper wicks. Its formation suggests waning bullish momentum and a possible shift towards bearish sentiment.
However, the pattern’s reliability is not absolute-its effectiveness can vary based on market conditions-and it often requires confirmation through additional technical indicators or price action.
You should be cautious of false signals and consider the pattern as part of a broader analytical framework rather than a standalone indicator. From our experience at WR Trading, incorporating the Advance Block pattern into a comprehensive trading strategy—one that includes trend analysis, volume assessment, and risk management—can enhance decision-making and improve trading outcomes.
That said, continuous learning and practical application are key to mastering such patterns and achieving genuine long-term success in trading.