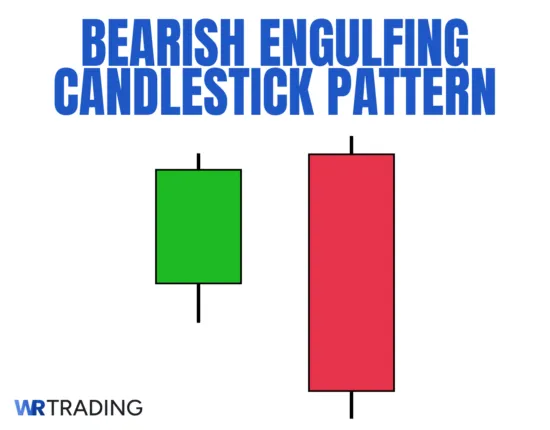
The Bearish Engulfing is a two-candle reversal pattern that forms during an uptrend. It begins with a small green candle that shows ongoing buying, followed by a large red candle that fully engulfs the first one. The red candle opens above the previous close and closes well below the green body, showing a complete rejection of the prior candlestick’s gains.
The pattern signals that selling pressure has returned with force and that the uptrend may be ending. The first candle indicates buyers still trying to push forward, but the second red candle completely overwhelms them, leaving no doubt about the new direction. Many traders use it to enter short positions or as a signal to exit long trades when the buying energy begins to break down.
Some of the advantages of using the Bearish Engulfing are: It’s easy to recognize on the chart due to its clear two-candle structure, works well near resistance zones to spot failed bullish breakouts, and helps confirm a momentum shift without relying on indicators.
Our detailed guide will show you how to find high-quality setups, interpret the signal correctly, and apply the pattern across different market types. We’ll also break down its failure signals and the best indicators to use.
Key Facts of The Bearish Engulfing Candlestick Pattern:
- Type of Pattern: Two-candle bearish reversal pattern.
- Construction Characteristics:
- Candle 1: A small green candle that closes higher than it opens, showing moderate buying pressure.
- Candle 2: A large red candle that opens above the previous close and completely engulfs the green candle’s body, closing below its low.
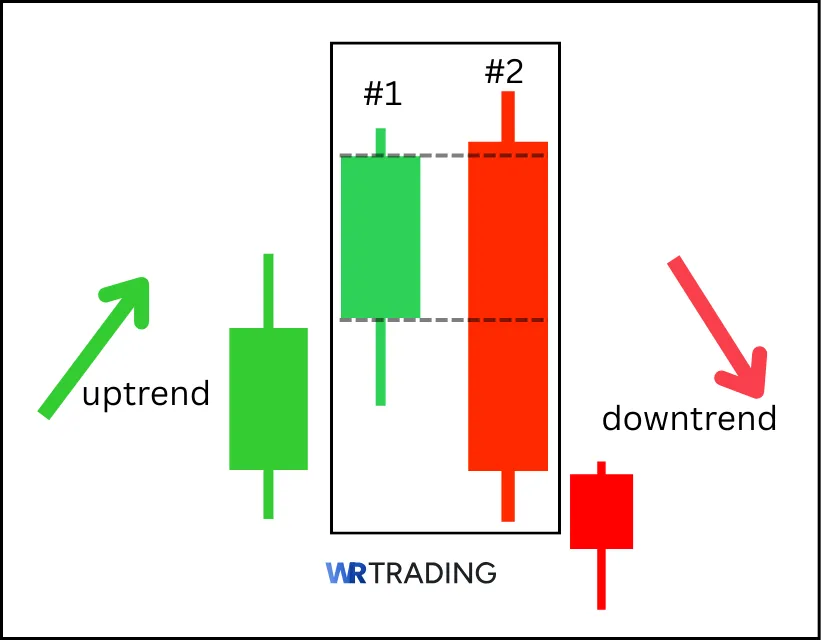
- Trend Prior to Pattern: Forms during an established uptrend or a short-term bullish rally, often near recent highs or resistance levels, where momentum starts to slow down.
- Trade Forecast: The pattern suggests that bullish momentum has been overrun by sellers, often forecasting the beginning of a short-term or full trend reversal to the downside.
- Interpretation: The Bearish Engulfing pattern shows a sharp change in sentiment where buyers are overwhelmed by strong selling. It reflects rejection of higher prices and marks the point where the uptrend begins to unwind.
- Stop-Loss Placement: Stops are placed just above the high of the engulfing red candle. If the price breaks above that level, the Bearish Engulfing is considered invalid.
- Opposite Pattern: Bullish Engulfing.
- Success Rate: 67% to 79%
(Learn To Trade And Read Candlestick Patterns Like A Pro)
How Does a Bearish Engulfing Candlestick Pattern Form?
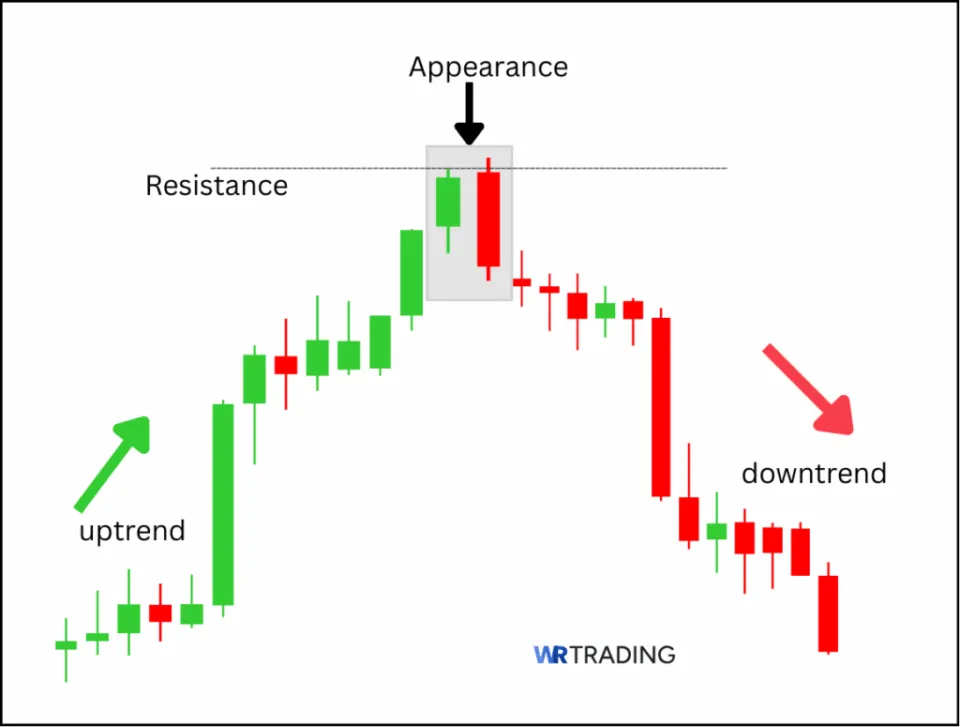
The Bearish Engulfing pattern forms over two candles during a bullish move or minor uptrend, after several green candles have pushed the price higher. Also, it can develop during a temporary pullback in a downtrend, where short-term buying runs into renewed selling. It appears when traders try to continue buying momentum, but selling pressure steps in with force.
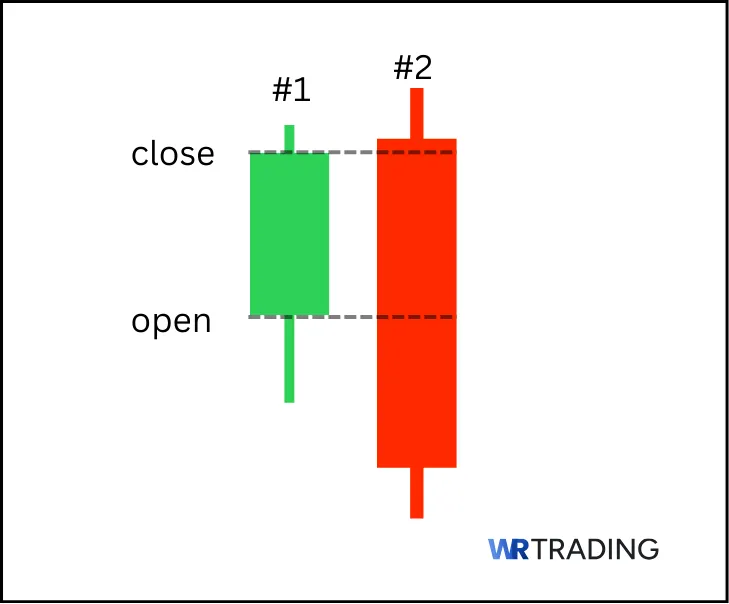
The first green candle is a small green body that reflects ongoing buyer interest. The second candle opens slightly above the previous close, creating the impression of strength, but that strength fades quickly as sellers take control and push the price below the first green candle’s open.
In order for the pattern to qualify, the body of the red candle must completely engulf the green candle’s body. This means it opens above the prior close and finishes below the previous open. The wick size is less important than the body structure, but excessive lower wicks can add noise. The timeframe does not affect the pattern’s validity, as it works on anything from the 15-minute chart to the daily chart, but reliability increases on higher timeframes.
What Does the Bearish Engulfing Candlestick Pattern Mean?
The Bearish Engulfing shows a complete momentum shift from buyers to sellers. The first candle shows that buyers are still participating and trying to extend the trend. However, the second candle erases all those gains and replaces them with a strong bearish close, which signals that sellers have stepped in and overpowered the earlier momentum. Also, it can appear when buyers begin to exit their positions leading to lots of selling pressure.
This pattern tells traders that the buyers no longer have control and that recent bullish activity has been rejected. From a psychological perspective, many buyers who entered on the previous candles are now sitting in losing positions. This often creates added selling pressure as they rush to exit, which can cause a wave of downside movement. The larger and more aggressive the engulfing candle, the more likely the reversal will follow through with strength.
Where does the name of the Pattern Bearish Engulfing Come From?
The name “Bullish Engulfing” comes from the way the second red candle fully covers or “engulfs” the body of the first green candle, showing that sellers have taken control. It indicates the shift in pressure by visually overpowering the previous bullish candle, leaving no part of it uncovered within the body range. This clear takeover is why the pattern is described as an engulfing move, and the direction of the engulfing candle gives it the “bearish” label.
(Learn To Trade And Read Candlestick Patterns Like A Pro)
How to Identify a Bearish Engulfing Candle in the Chart?
To find a Bearish Engulfing setup, begin by looking for rising price action. You need to see a clear green candle followed immediately by a red candle that fully covers the previous candle’s body. The red candle should open above the green candle’s close and close below its open. Without this engulfing structure, the signal is not valid.
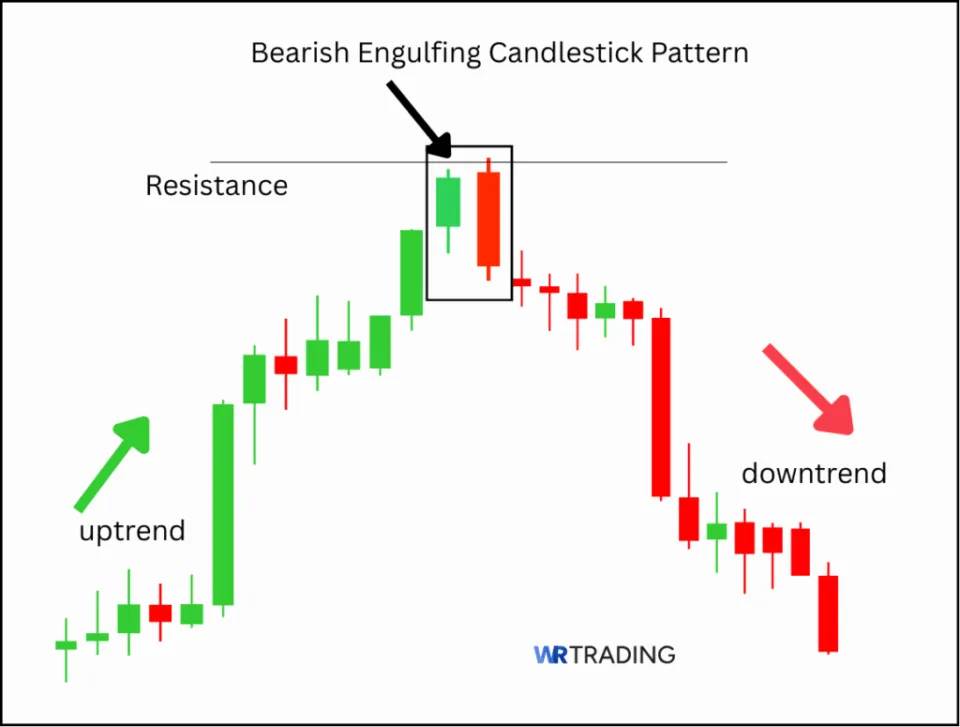
The best place to look for this pattern is near resistance, after a steady climb or in overbought conditions. The price should show signs of fatigue before the pattern appears. You can also look for it during bullish retracements in a larger downtrend. When the Bearish Engulfing appears in these zones, it becomes a useful signal that the temporary strength is fading and the dominant sellers may return. Always confirm the pattern with surrounding price context and, if possible, with volume or other indicators that point toward a rejection.
How to Trade the Bearish Engulfing Candlestick Pattern
The Bearish Engulfing pattern works best when combined with clear technical context, structure, and tools that confirm what the price is trying to say. The goal is to spot a genuine loss of buying power, then enter only once the evidence supports the idea of a real trend reversal or strong correction.
This section walks you through a structured, step-by-step approach to trading the Bearish Engulfing pattern. You’ll learn how to:
- Find the Right Bearish Engulfing Candlestick Pattern Setup
- Wait for the Appearance of the Bearish Engulfing Candle
- Open Your Trade – Entry Point
- Wait For A Confirmation Or Not
- Choose Your Trading Take Profit
(Learn To Trade And Read Candlestick Patterns Like A Pro)
1. Find the Right Bearish Engulfing Candlestick Pattern Setup
The Bearish Engulfing pattern needs to appear in a context that supports the possibility of a reversal. It should not appear randomly in a flat market or form against strong momentum. The price action leading up to the pattern must show signs of buying strength losing control. You should focus on the following situations:
- At or near a key resistance level: These zones mark the end of a move. If the pattern forms here, it could confirm that the level is being defended and that buyers are failing.
- At the top of a recent rally or sharp swing high: After a fast push higher, signs of exhaustion become more meaningful and reversals are more probable. A Bearish Engulfing here signals that buyers ran out of momentum.
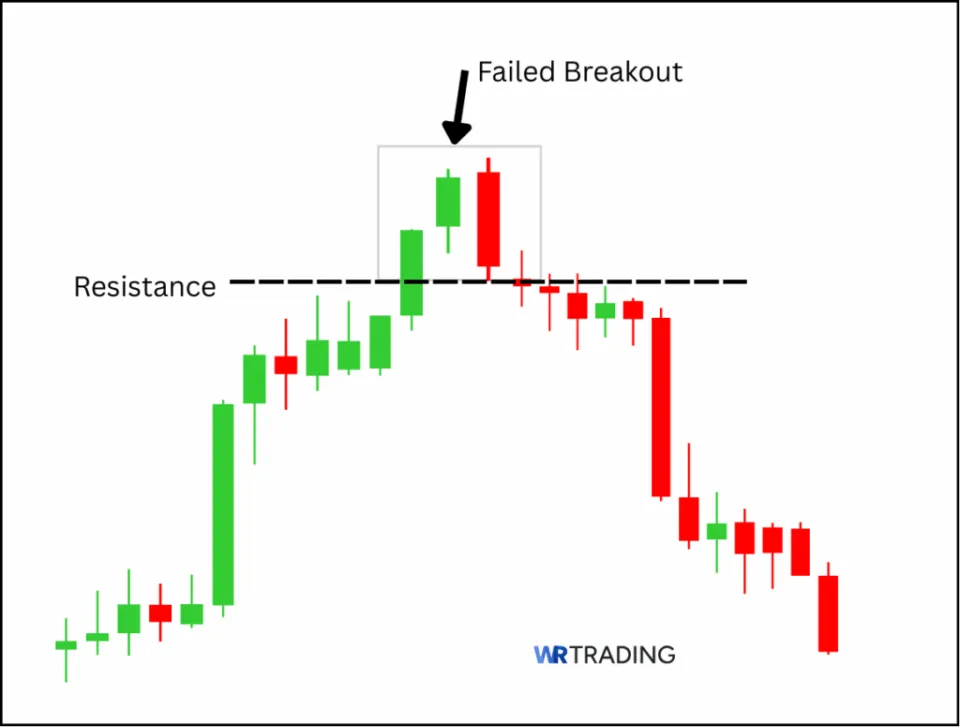
- During a final upward test of structure: If the price makes one last push above a previous high, then gets engulfed, it often confirms a failed breakout or stop hunt before a reversal begins.
- After a weak green candle or a gap up: When a small bullish candle forms with little conviction, followed by a strong red engulfing bar, it shows momentum has shifted hard.
2. Wait for the Appearance of the Bearish Engulfing Candle
Once the price reaches your area of interest, watch how the candles behave and wait for the Bearish Engulfing to form. You want to see a small green candle, followed by a large red candle that completely swallows it from open to close. The red candle should close well below the midpoint of the green candle, as that shows serious selling pressure.
The engulfing candle needs to look dominant, and if it’s weak or barely closes below the green candle, the pattern loses strength. If the wick of the green candle is long, make sure the body of the red candle still covers the full candle, not just the open and close. That’s the signal that buyers got completely overwhelmed.
3. Open Your Trade – Entry Point
Once the Bearish Engulfing pattern has fully formed and all structural conditions are met, the trade becomes actionable as soon as the price begins to confirm the pattern’s bearish intent. The most reliable entry point is just below the low of the engulfing red candle. This entry approach ensures that you are reacting to confirmed weakness rather than trying to anticipate it too early.
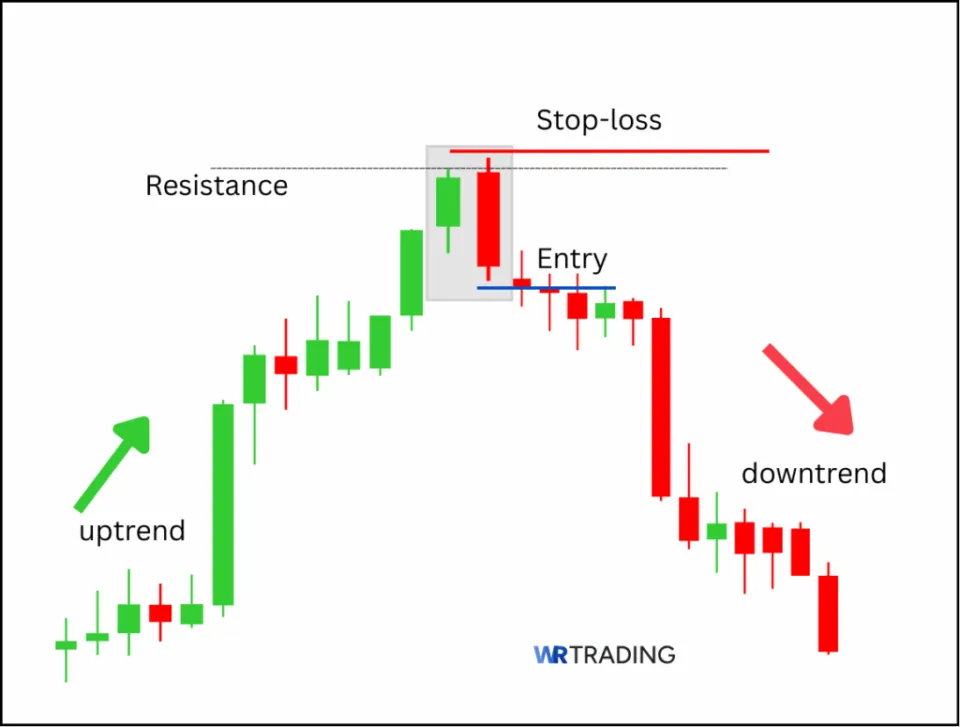
You should only enter the trade once the market breaks that low with a clean candle close or a strong push, not on the first small tick below the level. This helps filter out fake breaks or small retracements that may occur before the real move begins.
The stop-loss should always be placed above the high of the red engulfing candle. This placement respects the logic of the pattern and makes it clear where the trade is invalidated. If the price closes above that high, the entire signal loses validity, and you should be out of the position without hesitation.
4. Wait For A Confirmation Or Not
Confirmation is not always required, but it often makes the difference between a forced trade and one supported by real market activity. When the Bearish Engulfing appears during active hours, near a structural resistance level, or alongside clear momentum loss, immediate execution may work well. However, in more uncertain situations where the trend is still intact or the candle forms in isolation, confirmation gives added confidence that the reversal is genuine.
Some of the most effective confirmation methods include a strong break below the low of the engulfing red candle, as this shows that selling momentum has continued into the next candlestick. However, this increases the distance to your stop-loss and can reduce your reward-to-risk ratio.
A spike in volume during or just after the second candle also confirms that the market is reacting with conviction rather than hesitation. You can also use moving averages to see if the pattern forms under the 20- or 50-period line, which strengthens the reversal logic.
What Are Confirmation Signals For The Bearish Engulfing Pattern?
Confirmation signals give you the extra information needed to act on the pattern with more confidence. These signals help you separate strong setups from weak ones and avoid trading based only on appearance.
- Break of the engulfing candle’s low: The most straightforward signal is when the price breaks below the low of the second red candle. This shift confirms that sellers remained in control after the candle formed and that the rejection of prior gains is now turning into downside continuation.
- Rising volume on the red candle: When volume increases significantly during the second red candle, it indicates participation behind the selloff. It shows that the rejection was not a random fluctuation but a response from larger players or active traders exiting long positions.
- Bearish divergence on RSI or MACD: If the price creates a new high, but indicators like RSI or MACD fail to confirm that strength, it reveals weakening momentum under the surface. When this divergence occurs just before or during the Bearish Engulfing, it supports the idea that buyers are losing control and that a reversal is more likely to follow.
- Rejection at a moving average or trendline: The pattern gains strength when it forms near key dynamic resistance levels like the 20- or 50-period moving average or a downward sloping trendline. These levels often attract sellers, and the engulfing candle becomes the trigger that activates a broader rejection from those zones.
- Failure to hold above previous highs: If the green candle breaks a prior high, but the engulfing red candle immediately reverses and closes back below that level, the breakout attempt has failed. This sequence often traps late buyers and confirms that the market is shifting into a sell-biased phase.
(Learn To Trade And Read Candlestick Patterns Like A Pro)
5. Choose Your Trading Take Profit
A good take-profit plan should be based on structure and reward-to-risk logic, not a fixed number of points or percentages. The first option is to use the nearest support zone, such as a prior swing low or a horizontal level that acted as resistance in the past. These areas are natural reaction points where the price may stall, making them a good location to secure profits or scale out.
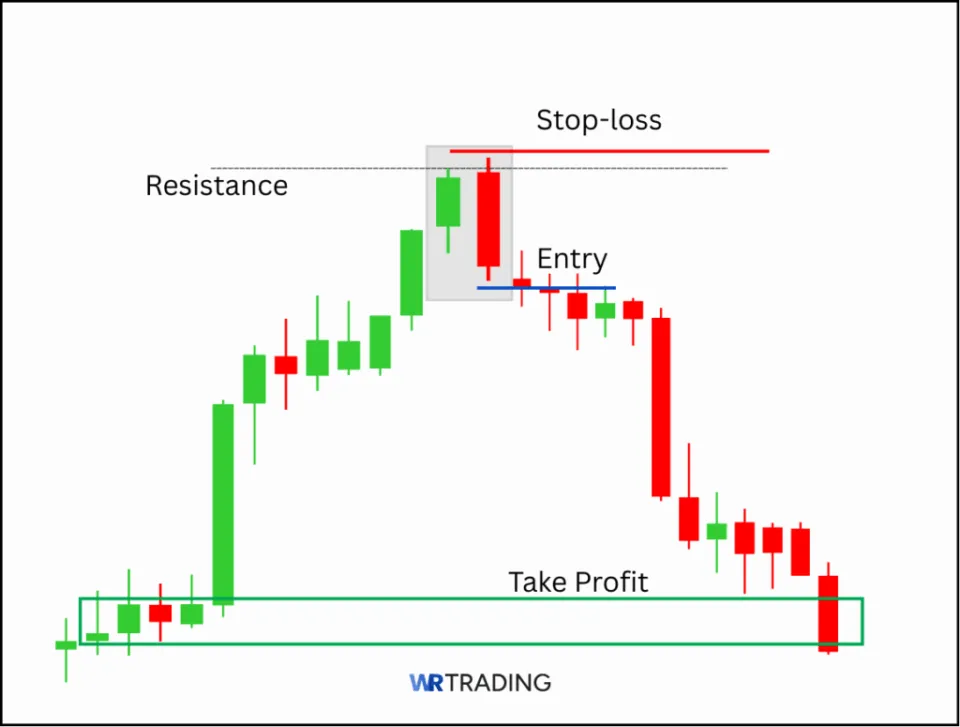
If no obvious level is nearby, use tools like Fibonacci retracements, ATR-based targets, or trendlines that define previous corrective waves. These tools help frame the likely extent of the move without requiring you to predict a top or bottom. Always aim for at least a 1:2 risk-to-reward ratio, meaning your profit target is twice as far from the entry as your stop. This ensures that even if only half of your trades work out, you remain profitable over time.
Which Strategies Can Be Used For The Bearish Engulfing Candlestick Pattern?
There are many ways to trade the Bearish Engulfing pattern, but not all of them offer the same level of reliability. Some setups depend entirely on price structure, while others use indicators or confirmation layers to filter out noise and false signals. Regardless of your preferred strategy, the pattern should be viewed as part of a complete decision-making process. It works best when the price action, context, and supporting tools all point in the same direction.
The entry and stop-loss is consistent across all our strategies. You should enter after the price breaks below the low of the engulfing candle. This confirms that sellers are continuing to apply pressure. The stop-loss is placed just above the high of the engulfing candle, which protects the trade in case the market turns and invalidates the setup.
- Bearish Engulfing Pattern with Volume Spike at Resistance
- Support-Resistance Flip at a Recent Breakout Level
- Trendline Rejection with Engulfing Reversal
- MACD Weakness Before and During the Pattern
1. Bearish Engulfing Pattern with Volume Spike at Resistance
One of the most effective strategies combines the pattern with an increase in volume at a known resistance level. If the second red candle in the Bearish Engulfing pattern forms just under a previous high or tested ceiling, and volume increases sharply, it confirms that the price was rejected with force. This shows that buyers are losing momentum and sellers are stepping in with conviction.
You can use basic horizontal levels drawn from previous swing highs, and observe volume using standard volume bars or a moving average overlay. The pattern is most powerful when the red candle’s close happens near the bottom of its range, and volume expands on that same bar. This combination adds strong evidence that the reversal is genuine and not just a temporary pullback.
2. Support-Resistance Flip at a Recent Breakout Level
Another powerful strategy is when the pattern forms after price breaks above a key level, then comes back down and retests that zone from above. If the Bearish Engulfing candle appears just as the price revisits the broken level, it often signals that the breakout failed and sellers are regaining control. This rejection adds weight to the pattern and aligns it with broader market structure.
Draw horizontal levels at recent breakout points and wait for the retest. When the price touches this level and the Bearish Engulfing forms, it means the support-resistance flip is being confirmed by price action. Entry happens once the candle’s low breaks, and the stop goes above the pattern’s high.
3. Trendline Rejection with Engulfing Reversal
Using a downward trendline as part of the setup allows you to catch rejections with clearer structure. If the market rallies into a well-defined trendline and prints a Bearish Engulfing pattern just below it, this signals that the trend is intact and the bounce has ended. It confirms that buyers failed to take control and were rejected at a known supply area.
Draw your trendline by connecting at least two lower highs and extend it forward. Wait for the price to touch or slightly break the trendline before forming the engulfing candle. The pattern works best when it forms right on or near the line.
4. MACD Weakness Before and During the Pattern
MACD is useful for spotting momentum changes and confirming that a trend is running out of energy. When MACD lines flatten or start to cross down before the engulfing pattern forms, it shows that the rally is no longer supported by strength. If the histogram also contracts or turns negative during the second candle, it aligns with the shift in direction.
Use MACD settings of 12, 26, 9, and track the behavior of both the histogram and signal lines. When MACD begins showing weakness while the Bearish Engulfing forms, it suggests the price is no longer rising on strength. This gives you a more complete view of market behavior and helps avoid setups where the price looks right but momentum still favors the bulls.
(Learn To Trade And Read Candlestick Patterns Like A Pro)
What Is The Success Rate Of The Bearish Engulfing Candlestick Pattern?
In the Encyclopedia of Candlestick Charts, Thomas Bulkowski tested the pattern and recorded a 79% success rate for downward breakouts when the setup appears in the right context. This number shows high-probability trades that follow a clean uptrend, end at resistance, and get confirmed by structure or volume.
From what we’ve seen in our own testing, that 67% to 79% range holds up when the pattern is used properly. If you just take every engulfing candle without looking at the trend or price levels, the success rate drops fast. When you focus on setups with momentum loss, rejection at resistance, or supporting indicators like MACD and RSI, the pattern delivers strong follow-through and becomes a reliable tool for timing entries.
Is the Bearish Engulfing A Reliable Candlestick Pattern?
Yes, the Bearish Engulfing is reliable because it combines multiple elements of market structure, momentum, and timing into one clear signal. It forms after a sustained uptrend, and the engulfing red candle confirms that buying pressure has collapsed in a single move.
When it aligns with resistance levels, volume expansion, or momentum loss on tools like RSI or MACD, the pattern often marks the exact turning point before a reversal begins. It also sets clear entry and stop-loss levels, making it easy to plan trades without relying on subjective interpretation.
Is the Bearish Engulfing Candlestick Pattern Suitable For Beginners?
Yes, the Bearish Engulfing pattern is suitable for beginners because of its clear visual structure and simple identification rules. It only involves two candles, with the second red candle fully covering the previous green one, making it easy to recognize without complicated tools. As long as new traders focus on proper chart context, such as trend direction and resistance zones, this pattern can offer a straightforward entry into trading.
What Are the Pros and Cons of Trading the Bearish Engulfing Candle Pattern?
Understanding any candlestick pattern completely means looking at both its strengths and its weaknesses. The Bearish Engulfing pattern offers clear signals, making it a valuable tool for anticipating price movements. However, like all patterns, it also comes with situations where it might not perform as expected. Knowing these pros and cons can help you improve your trading decisions.
Pros
- Marks a clear change in control between buyers and sellers
- Works well when paired with resistance levels
- Often signals strong follow-through when confirmed
- Easy to identify on the chart without special tools
- Can act as an early warning to exit long positions
Cons
- Fails during strong bullish trends
- Does not project a price target on its own
- Not all engulfing candles carry the same value
- Needs to be at the right place in the chart to matter
- The size of the second candle can be misleading
Pros of the Bearish Engulfing Pattern:
- Marks a clear change in control between buyers and sellers: The Bearish Engulfing forms when a strong red candle overtakes a smaller green one, showing that bulls have lost momentum and sellers have taken over. This shift in price action offers a clean, visual cue that the uptrend may be reversing. It simplifies decision-making and gives you a defined signal that something has changed in the market structure.
- Works well when paired with resistance levels: Bearish Engulfing patterns gain strength when they appear near horizontal resistance, supply zones, or key technical barriers. The rejection becomes easier to validate when the engulfing candle forms after a test of a well-established ceiling. This helps filter out weaker signals and gives the trader more confidence in the reversal.
- Often signals strong follow-through when confirmed: When confirmation follows the engulfing candle, such as a break of the low or an increase in volume, the move tends to continue. This follow-through is useful for planning trades with momentum and avoiding traps that fade out.
- Easy to identify on the chart without special tools: You don’t need advanced software to spot the Bearish Engulfing pattern. A simple price chart is enough, making it accessible for traders who prefer visual setups. This also helps reduce clutter and keeps the focus on pure price behavior.
- Can act as an early warning to exit long positions: Even if you don’t plan to go short, seeing this pattern can signal that an uptrend is losing momentum. It provides a strong reason to consider closing longs or tightening stops. This can protect gains before a deeper reversal takes hold.
Cons of the Bearish Engulfing Pattern:
- Fails during strong bullish trends: When the broader trend remains aggressively bullish, a single engulfing pattern is not enough to reverse the market. The price may briefly dip but quickly recover, trapping short sellers who entered too early. Without confirmation or structure, the pattern loses its edge.
- Does not project a price target on its own: The Bearish Engulfing gives no information on where the market may go next, so you’ll need to use tools like support levels, Fibonacci zones, or volatility-based indicators to set your exits. This adds complexity and demands good trade planning.
- Not all engulfing candles carry the same value: Some engulfing patterns form on low volume or after erratic moves, making them less reliable. Others may technically fit the pattern rules but lack follow-through due to market conditions. You’ll need filters to avoid chasing every visually valid pattern that appears.
- Needs to be at the right place in the chart to matter: If the Bearish Engulfing forms in the middle of a trend or after a pullback, it may not carry much meaning. It needs to form near the top of a move or under resistance to work properly. Without the right context, it becomes just another red candle.
- The size of the second candle can be misleading: If the red candle is huge compared to the previous one, it might look strong, but it can also signal exhaustion. Sharp moves often retrace quickly, trapping sellers. This makes it hard to judge whether the size means strength or just volatility.
(Learn To Trade And Read Candlestick Patterns Like A Pro)
Can The Bearish Engulfing Have Failure Signals??
Yes, the Bearish Engulfing pattern can produce failed signals when the context is weak or the price structure does not support a true reversal. A visually valid pattern is not always enough, and several specific conditions increase the likelihood of failure.
- Forms during a strong uptrend without exhaustion: If the bullish trend remains strong and shows no signs of weakening, a single Bearish Engulfing is rarely enough to reverse the market. Buyers may step back temporarily, but the underlying trend can easily resume. The pattern fails when used against sustained momentum with no clear reason for reversal.
- Volume remains low during the engulfing candle: A large red candle with weak or declining volume suggests there is no real commitment behind the move. The price may drop, but without participation from many traders, there’s little chance of strong follow-through. These low-volume engulfings tend to stall quickly or reverse.
- The green candle has a long lower wick: If the first candle in the pattern has a large lower wick, that wick must also be engulfed by the red candle. When it isn’t, the signal loses a lot of meaning, as the sellers haven’t truly erased all of the prior buying. This partial coverage reduces the pattern’s effectiveness and opens the door to rebound.
- The red candle closes near the middle of the green candle: An engulfing setup is only strong when the red candle closes decisively below the green body. If the close happens too high or near the midpoint, the rejection is not significant. These weak closes give mixed signals and rarely produce strong moves.
- No follow-through in the next candle: The Bearish Engulfing relies heavily on what happens next. If the following candle fails to break the low or even opens higher, it shows hesitation rather than commitment. This often leads to reversal or sideways action rather than continuation.
What Are The Limitations Of The Bearish Engulfing?
The Bearish Engulfing pattern can be a powerful signal, but it’s important to understand its limitations. If you rely on it without considering the full market picture, you might run into false signals and losing trades. Knowing these drawbacks will help you use the pattern.
- Can lead to wider stop-loss placements: If the red engulfing candle is very large, you might need to place your protective stop far away. This can mean risking a bigger amount of money on a single trade, which might not fit your trading plan or desired risk-to-reward ratio.
- Requires a clear uptrend to be meaningful: The Bearish Engulfing pattern is a reversal signal, so it needs a trend to reverse. If the market is just moving sideways or without a clear trend, the pattern often doesn’t have much meaning and can give false signals.
- Doesn’t give a specific price target: The pattern tells you that sellers are likely taking control, but it doesn’t tell you how far the price might fall. You’ll need other tools or analysis to figure out where to take your profits, adding another layer to your trading decision.
- May signal only a temporary pause, not a full reversal: Sometimes, after the Bearish Engulfing forms, the price might dip for a short time but then quickly go back to its original upward trend. This can trap traders who expected a longer-lasting reversal.
- Less reliable in thin or low-volume markets: In markets where not many trades are happening (low liquidity), the pattern might appear but not truly reflect strong market sentiment. These signals can be unreliable and lead to sudden, unexpected movements against your trade.
- Momentum of the broader trend can overpower it: Even if the pattern looks perfect, a very strong bullish trend on a higher timeframe can easily override a smaller Bearish Engulfing signal. The larger trend often wins out, making the pattern less effective if it goes against the bigger trend.
Which Indicators Can Be Combined With The Bearish Engulfing Pattern?
Combining the Bearish Engulfing pattern with the right technical indicators can significantly boost its reliability and give you more confidence in your trades. These tools help confirm the shift in momentum and filter out weaker signals. Here are some popular indicators that work well with the Bearish Engulfing:
- Relative Strength Index (RSI): The RSI is a fantastic momentum oscillator that helps identify overbought conditions. If the Bearish Engulfing forms when the RSI, using its standard 14-period setting, is above 70, it signals that the market is stretched and ready for a pullback. A bearish divergence, where the price makes higher highs but RSI makes lower highs, further strengthens the reversal signal from the engulfing pattern.
- Moving Average Convergence Divergence (MACD): The MACD is a versatile indicator for spotting momentum changes. When the MACD lines, using settings of 12, 26, and 9, flatten or start to cross downward before or during the engulfing pattern’s formation, it indicates that the bullish rally is losing momentum. A bearish crossover of the MACD line below the signal line, especially with the histogram turning negative, provides strong confirmation for a short entry.
- Volume Analysis: A big increase in trading volume during the formation of the second red engulfing candle shows that strong selling pressure is behind the reversal. This increased volume confirms that the market is reacting with conviction, not just hesitation, and that institutional traders might be exiting long positions.
- 20-Period Exponential Moving Average (EMA): Short-term exponential moving averages like the 20 EMA, with a 20-period setting, can act as dynamic support during uptrends. If the Bearish Engulfing candle’s close breaks below this EMA, it strongly suggests that the uptrend is breaking down. This breakdown provides additional validation for the bearish direction, guiding potential entry and exit points.
- Bollinger Bands: Bollinger Bands, with default settings of 20-period moving average and 2 standard deviations, can help identify potential tops and increased volatility. When the Bearish Engulfing pattern forms and the red engulfing candle closes deep inside the bands, it often signals a strong reversal back towards the mean. This indicates price exhaustion and a return to the average.
What Are Similar Patterns To The Bearish Engulfing Pattern?
The Bearish Engulfing pattern is a powerful reversal signal, but many other candlestick patterns can also indicate a shift from bullish to bearish momentum. Some of these patterns are similar in length, while others indicate a similar signal through different structures.
| Pattern Name | Main Characteristics | Best Use Case |
|---|---|---|
| Evening Star | First candle is bullish, second is small-bodied (indecision), third is a strong bearish close erasing much of the first candle’s gains. | Confirms major reversals at tops of trends. |
| Three Black Crows | Three consecutive red candles, each opening within the previous one’s body and closing progressively lower. | Signals that sellers are in control and bullish pressure is fading. |
| Shooting Star | Small body near the low, long upper wick, minimal lower wick. | Helps identify exhaustion after strong bullish moves or rallies. |
| Bearish Harami | Small red candle entirely inside the previous green candle’s body. | Warns that bullish momentum is fading before a reversal. |
| Tweezer Top | Two candles print similar highs, with rejection and closing lower. | Spots failed attempts to break new highs, highlighting seller presence at resistance. |
More similar patterns can be learned in our free Candlestick Bible PDF on WR Trading.
What Is The Opposite Pattern Of The Bearish Engulfing?
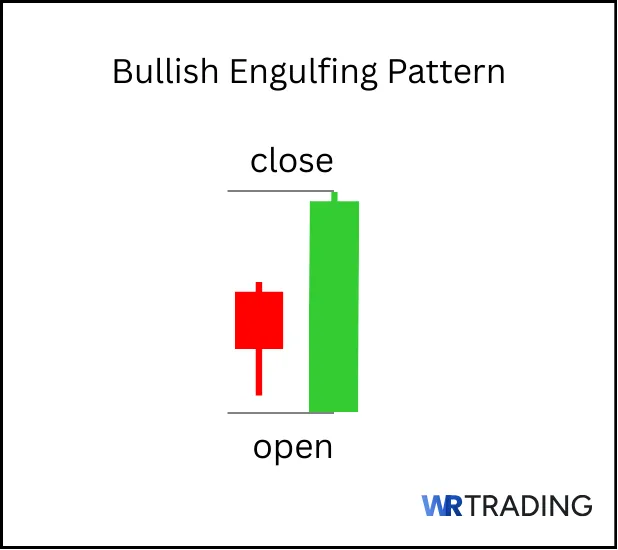
The opposite of the Bearish Engulfing pattern is the Bullish Engulfing pattern. It’s a two-candle bullish reversal setup that forms after a downtrend. The Bullish Engulfing begins with a small red candle, followed by a large green candle that fully engulfs the first, signaling that buyers have taken control.
What Is The Difference Between The Bearish Engulfing And Bullish Engulfing Candle patterns?
While the Bearish Engulfing and Bullish Engulfing patterns are two-candle reversal signals, they predict movements in completely opposite directions. The Bearish Engulfing signals a change from an uptrend to a downtrend, with a large red candle opening above the prior close and completely engulfing a smaller preceding green candle.
In contrast, the Bullish Engulfing appears after a downtrend, where a large green candle completely covers a smaller preceding red candle, opening lower but closing above the red candle’s high. The Bearish Engulfing shows sellers overpowering buyers after an advance, while the Bullish Engulfing shows buyers overpowering sellers after a decline.
| Section | Bearish Engulfing | Bullish Engulfing |
|---|---|---|
| Type of Pattern | Two-candle bearish reversal pattern | Two-candle bullish reversal pattern |
| Construction | First: A small green candle. Second: A large red candle completely engulfing the first. | First: A strong red candle. Second: A large green candle completely engulfing the first. |
| Forecast | Suggests a shift to bearish momentum and potential downside reversal. | Signals a change to bullish sentiment and potential upside reversal. |
| Trend Prior to Pattern | Forms after an uptrend or strong bullish swing. | Forms after a downtrend or strong selling pressure. |
| Best Use Case | Effective near resistance zones to spot failed bullish breakouts. | Useful for catching early reversal signs after a bearish swing, often at support zones. |
(Learn To Trade And Read Candlestick Patterns Like A Pro)
What Is The Difference Between The Bearish Engulfing And Bearish Harami Candle Pattern?
The Bearish Engulfing and Bearish Harami patterns are signals hinting at a potential shift to bearish momentum, but their difference is in the aggression and decisiveness of that signal.
The Bearish Engulfing indicates a powerful and immediate takeover by sellers, where a large red candle completely covers the body of the preceding smaller green candle. This literally “swallows” the bullish gains of the prior candle, showing a strong, outright rejection of higher prices and a clear change in control.
The Bearish Harami shows a much more subtle warning. Instead of engulfing, its small red candle forms entirely within the body of the preceding large green candle, suggesting hesitation or a pause in the bullish momentum rather than a complete reversal.
| Section | Bearish Engulfing | Bearish Harami |
|---|---|---|
| Type of Pattern | Two-candle bearish reversal pattern | Two-candle bearish reversal pattern |
| Construction | First: A small green candle. Second: A large red candle completely engulfing the first. | First: A large green candle. Second: A small red candle entirely within the first. |
| Forecast | Signals a stronger reversal with full rejection of the previous candle’s price action. | Warns that bullish momentum is fading before a reversal. |
| Trend Prior to Pattern | Appears after an uptrend or strong bullish swing. | Forms after a steady decline or structured pullback, often showing early momentum pauses. |
| Key Characteristic | The second red candle completely engulfs the previous green candle’s body, signaling a full rejection. | A small red candle fits inside the previous green candle’s real body, showing hesitation. |
Learn Pattern Trading With the WR Trading Mentoring
Learning to identify candlestick formations like the Bearish Engulfing is a great start, but becoming consistently profitable in trading requires much more than just spotting patterns on a chart. It’s about understanding the deeper market context, mastering your entry and exit timing, and managing risk like a professional. That’s exactly what the WR Trading Mentoring program is designed to teach you.
Our mentorship goes beyond simple pattern recognition as you’ll learn to interpret what the market is truly telling you through price action, combining the Bearish Engulfing with factors like support and resistance zones, volume dynamics, and momentum shifts. We’ll help you develop a disciplined approach, so you can confidently identify high-probability setups and avoid common pitfalls like false signals or emotional reactions to strong candles.
Through live training sessions, personalized feedback, and hands-on chart work, you’ll build the real-world skills needed to apply these patterns effectively in any market condition. Stop second-guessing yourself and start trading with a clear, logical edge by applying for WR Trading.
(Learn To Trade And Read Candlestick Patterns Like A Pro)
Conclusion: The Bearish Engulfing is A High-Probability Reversal Signal
To summarize, the Bearish Engulfing pattern is a visually clear and high hit-rate two-candle bearish reversal signal. It clearly shows a significant shift in control, with a large red candle aggressively overpowering and swallowing the previous smaller green one. This visual confirmation tells traders that bullish momentum has collapsed and sellers are now firmly in charge, signaling a potential change in market direction.
From our experience, this pattern is incredibly valuable when it appears in the right places, such as at the top of an uptrend or near strong resistance levels. It acts as an early warning for those holding long positions to consider exiting or tightening their stops, and it offers a defined opportunity for short entries.
However, we always recommend combining it with other confirmation tools like increased volume or indicators to boost its reliability and avoid false signals. While it’s easy to spot due to its clear structure, it’s not meant to be traded in isolation, choppy, or strong underlying trends, where its strength diminishes. When used correctly, the Bearish Engulfing pattern delivers strong follow-through and can be a reliable tool for timing entries, as proven by its high success rate of 79%.
Frequently Asked Questions on Bearish Engulfing Candlestick Patterns
What Does the Bearish Engulfing Pattern Indicate?
The Bearish Engulfing pattern signals a strong shift from buying to selling pressure. It shows that buyers have lost control, and a potential downtrend or significant correction is beginning. Traders use it as a signal to exit long positions or consider short entries.
How Many Candles Make Up the Bearish Engulfing?
The Bearish Engulfing is a two-candle reversal pattern, starting with a smaller green candle, followed by a larger red candle that completely covers the first one. This two-candle sequence is needed for its formation and validity.
Where Does the Bearish Engulfing Pattern Usually Form?
The Bearish Engulfing forms at the top of an uptrend or during a strong bullish rally. It’s significant and more meaningful when it appears near key resistance levels or recent swing highs. The location provides important context for its reliability.
Is the Bearish Engulfing Pattern Reliable Enough to Add to a Trading Strategy?
Yes, the Bearish Engulfing pattern is considered reliable when confirmed by other technical factors. Its success rate can be as high as 79% when it forms in the right context, such as after a clean uptrend and at resistance. This makes it worth implementing into any trading strategy.
How Deep Should the Red Candle of the Engulfing Pattern Close for the Pattern to Be Valid?
The red candle should close decisively below the green candle’s open, fully engulfing its body, for the Bearish Engulfing pattern to be considered strong. Ideally, it should close well below the midpoint of the green candle. A shallow close weakens the signal and indicates less conviction from sellers.