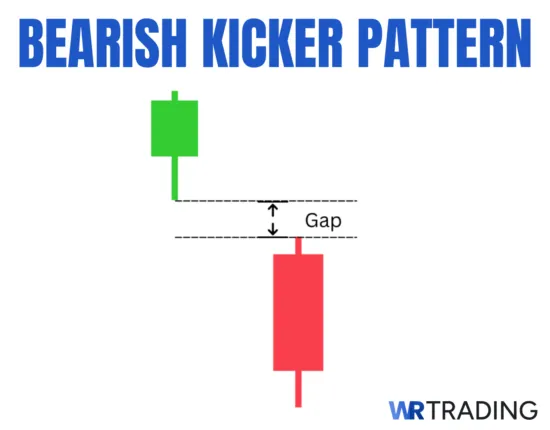
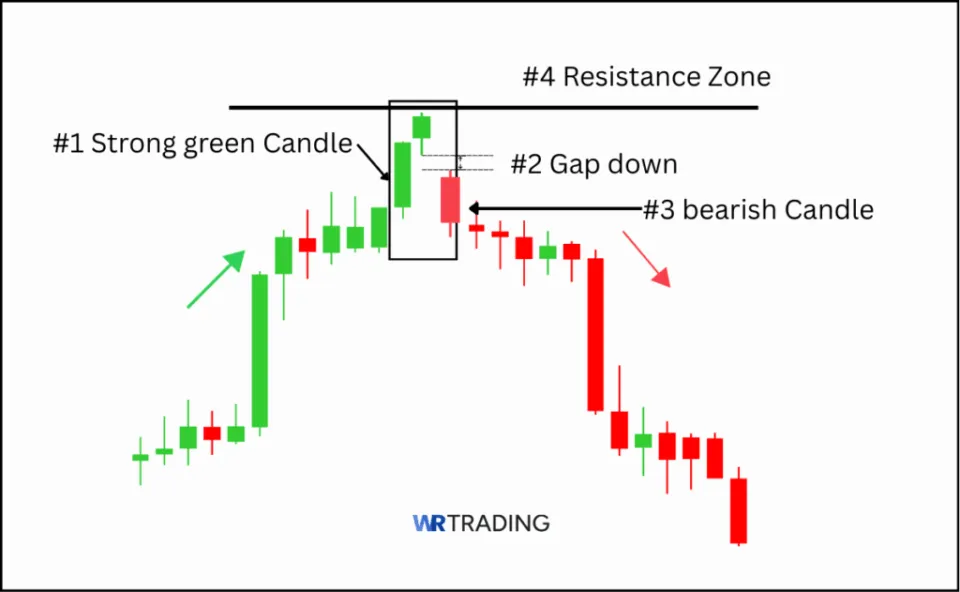
The Bearish Kicker is a two-candle bearish reversal pattern that consists of a strong bullish candle and a bearish candle that opens with a gap down and closes lower. This bearish candle forms a way that there is no body overlap. The Bearish kicker pattern typically appears at the end of an uptrend and signals a sharp shift in market psychology, indicating that sellers have taken control of the market from buyers.
To trade the bearish kicker, enter a short position a few pips below the close of the bearish candle. Set your stop-loss a bit above the high of the bullish candle and your take profit at the next support level. Below are a few facts for identifying a typical bearish kicker pattern:
Key Facts of The Bearish Kicker Candlestick Pattern:
- Construction: The pattern is constructed with two candles.
- First Candle: A strong green candle, showing continued bullish pressure in an existing uptrend.
- Second Candle: Opens below the first candle’s open, forms a large red body, and closes lower, without touching the body of the first candle.
- Forecast: Expect prices to move lower, especially with confirmation.
- Type of Pattern: Bearish reversal.
- Trend prior to the Pattern: Uptrend.
- Opposite Pattern: Bullish Kicker.
- Stop-loss placement: Above the high of the kicker pattern’s first candle.
In this guide, we will walk you through the structure, formation, and interpretation of this pattern. We’ll also show how to enhance your edge using key technical tools within market contexts.
(Learn To Trade And Read Candlestick Patterns Like A Pro)
How Is The Bearish Kicker Pattern Formed?
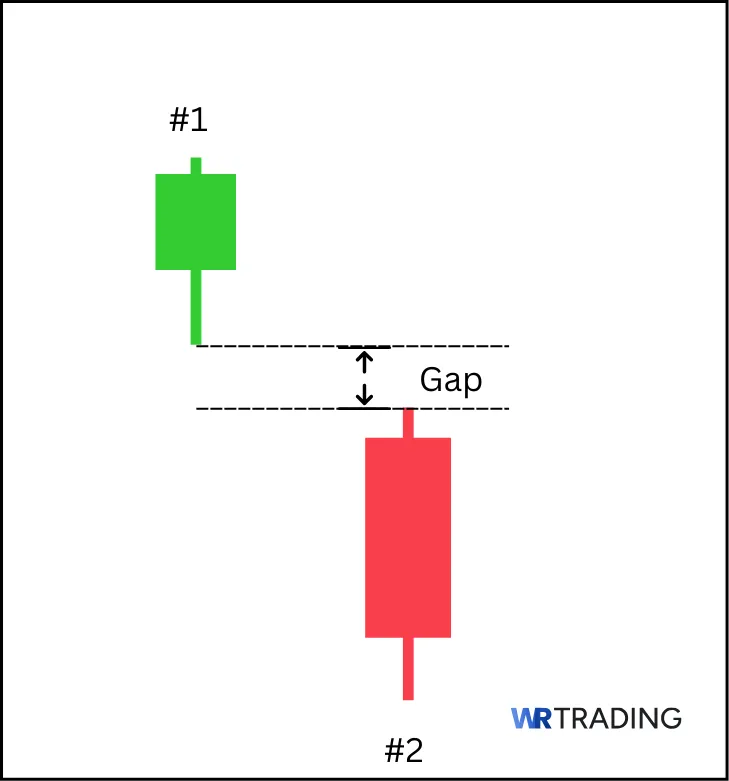
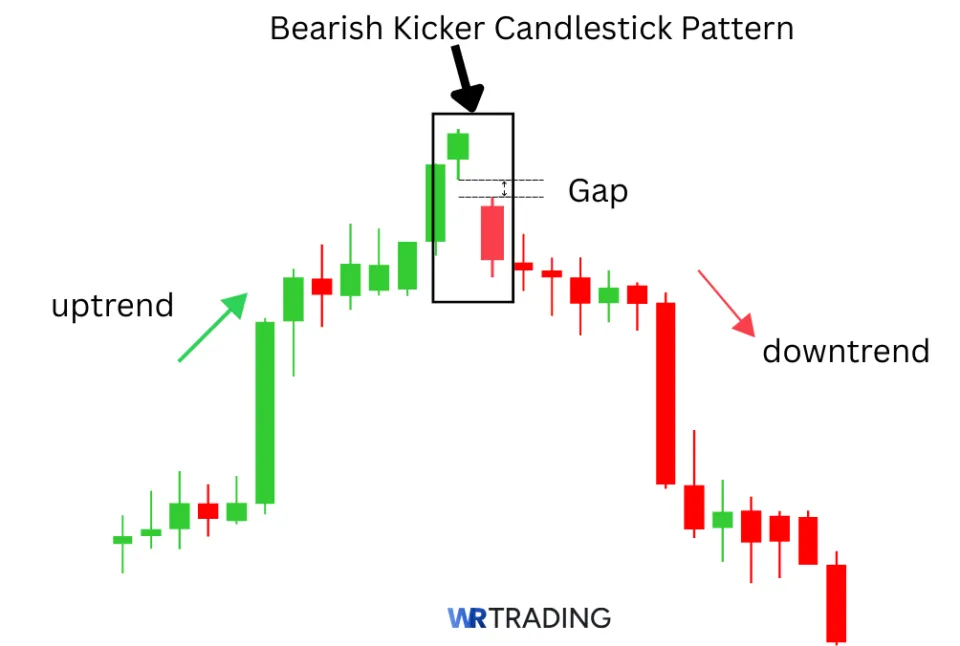
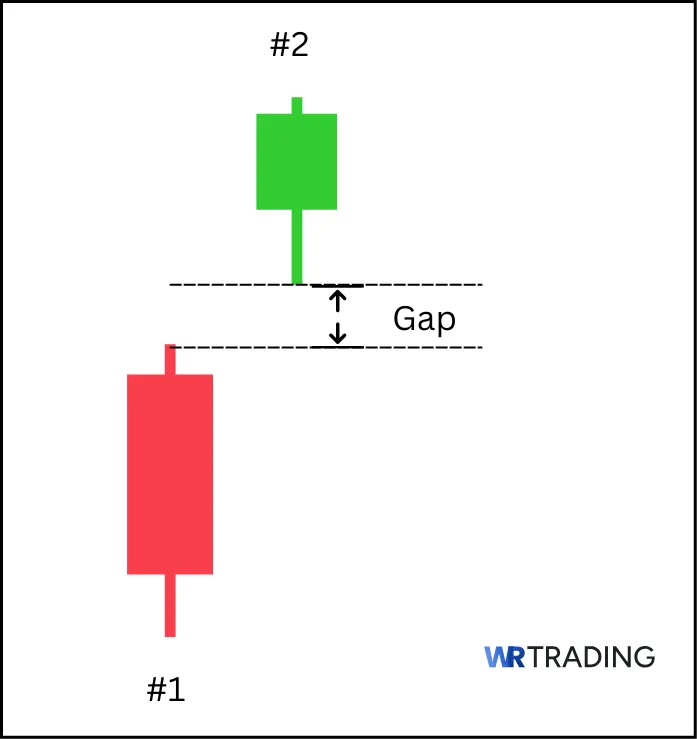
The Bearish Kicker forms during a clear uptrend and consists of two candles that signal a complete shift in market control, from buyers to sellers. The first candle is bullish, showing strong momentum. The second candle opens with a gap down and immediately reverses, forming a solid bearish candle.
This structure does not require any specific number of candles before it forms. What matters is that it appears during bullish conditions; usually after a series of green candles or upward momentum. The first candle should confirm that the trend is intact. Then, the kicker should appear without warning.
There is no fixed time setting for this pattern. It can form on any timeframe: 1H, 4H, or daily, though it may be better to spot it on higher timeframes for clarity. The key characteristic is that the second candle opens significantly lower, shows no hesitation, and finishes with conviction.
The gap between the two candle bodies is crucial. Without it, the pattern loses meaning. What follows the kicker matters too; a confirmation candle helps validate that sellers are in full control. When this setup forms near resistance zones, it gains even more weight.
What Does The Bearish Kicker Candlestick Pattern Mean?
The Bearish Kicker represents a sudden rejection of bullish momentum. It tells us that market sentiment flipped aggressively, often without warning. Buyers were in full control, but the next session opened with a sharp gap down and heavy selling pressure, wiping out prior gains.
This pattern signals one thing; conviction from sellers. We interpret the kicker as a message that institutional players or large-volume traders stepped in to offload positions. There’s no hesitation, only an aggressive shift in control.
Psychologically, this move traps late buyers who entered during the final push upward. As their positions turn red, they’re forced to exit. This exit adds to the selling momentum, which is why the Bearish Kicker often leads to sharp declines if confirmed.
It’s not just a reversal signal, it’s a momentum pivot. The cleaner the gap, the stronger the conviction. This is why we don’t treat it as a soft warning. We treat it as a loud signal that trend exhaustion has turned into active rejection.
(Learn To Trade And Read Candlestick Patterns Like A Pro)
What Is An Example Of The Bearish Kicker Pattern?
A clear example of the Bearish Kicker pattern appeared on the APPL 4H chart on September 06, 2023.
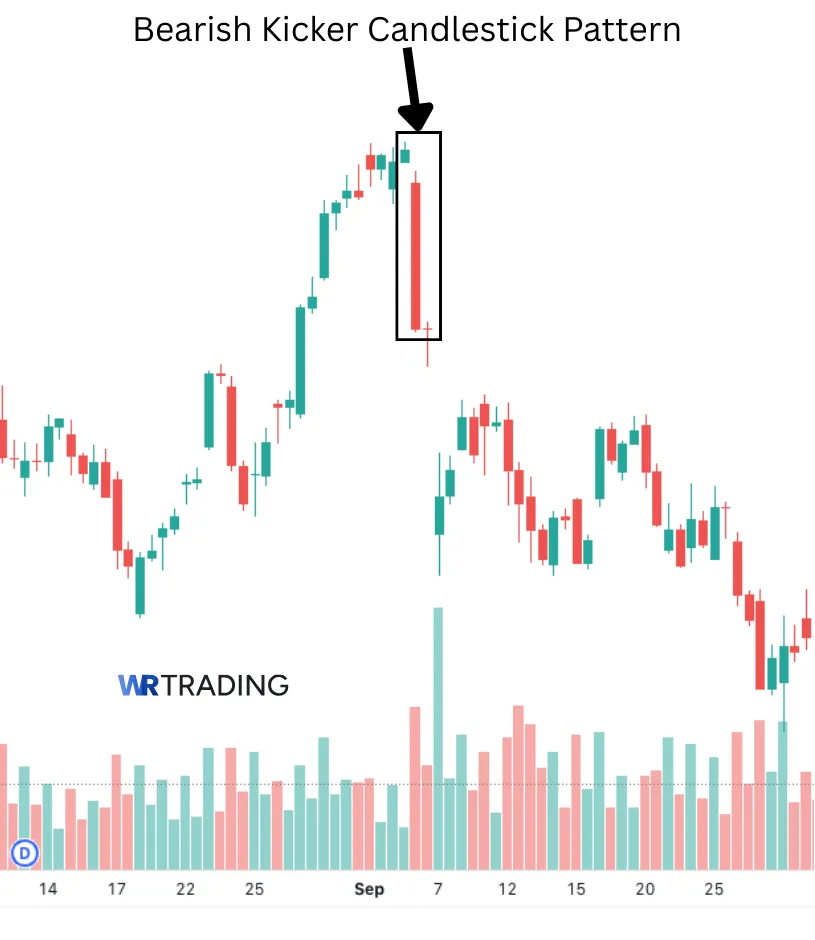
- First Candle (Bullish):
APPL was in a short-term uptrend. The stock closed at 189.71, forming a clean green candle with little upper wick. - Second Candle (Bearish Kicker):
The next 4H candle opened with a gap down at 188.43; well below the previous candle’s open at 189.23. Price dropped aggressively and closed at 182.91, forming a large red candle. There was no overlap between the candle bodies.
This move showed a sudden shift in sentiment. Buyers were in control, but the market flipped fast. The gap down and full-bodied bearish close confirmed that sellers stepped in heavily; classic Bearish Kicker behavior.
We view setups like this as high-value signals, especially when they appear near previous resistance zones or after extended bullish runs.
How To Identify The Bearish Kicker Pattern?
To identify the Bearish Kicker, start by scanning charts in a clear uptrend. You’re looking for strength; multiple bullish candles, higher highs, or price pushing into resistance. The kicker only matters when it interrupts strong bullish momentum.
Here’s how to look for a Bearish Kicker:
- Step 1: Spot a strong green candle in an uptrend. It should have a decent-sized body and a close, very near its high.
- Step 2: The next candle must open below the open of the first candle, creating a clean gap down.
- Step 3: The second candle should be strongly bearish with a large red body, and it should not overlap the first candle’s body.
- Step 4: Check the context. Is it near a resistance level or a prior supply zone? That adds weight to the pattern.
The Bearish Kicker should stand out clearly. It’s not a subtle signal.
(Learn To Trade And Read Candlestick Patterns Like A Pro)
How To Trade The Bearish Kicker Pattern?
Trading the Bearish Kicker requires more than just spotting two candles; it needs structure, context, confirmation, and a defined plan. We encourage traders to execute this pattern using a step-by-step approach that is rooted in technical analysis and market psychology. You can follow these steps:
- Find an ideal setup.
- Wait till you see the bearish kicker pattern.
- Enter the trade.
- Set your take-profit level.
Bear in mind that this is a reversal setup, not a trend-following signal. So timing and location are everything. The goal isn’t just to enter trades, it is to enter high-probability trades with proper risk control and profit logic. Follow the tutorial below to spot and enter these kinds of trades.
#1 Find the Right Setup for the Bearish Kicker
We only consider the Bearish Kicker valid when it forms during a bullish trend, specifically when the price is pushing into a major resistance zone. This could be a previous swing high, a key Fibonacci retracement (like 0.618 or 0.786) on a financial instrument like EUR/USD.
Look for the price to be in a stretched uptrend, where recent candles show sustained buying pressure. This increases the chance that the pattern triggers a reversal, not just a minor pullback.
The pattern should not occur in a downtrend. In such a case, it’s not a kicker, just a continuation candle. Also, it is best to avoid setups in low-volume sessions.
For structure, we scan the 1H, 4H, and daily charts. Higher timeframes reduce noise and give a cleaner context. Once the uptrend and resistance zone are established, we are ready for the next step.
#2 Wait for the Appearance of the Bearish Kicker Candlestick Pattern
A valid Bearish Kicker starts with a green candle showing strong bullish momentum. Then, the second candle gaps down and forms a large red body that closes well below the prior candle’s open. There must be no overlap between the candle bodies.
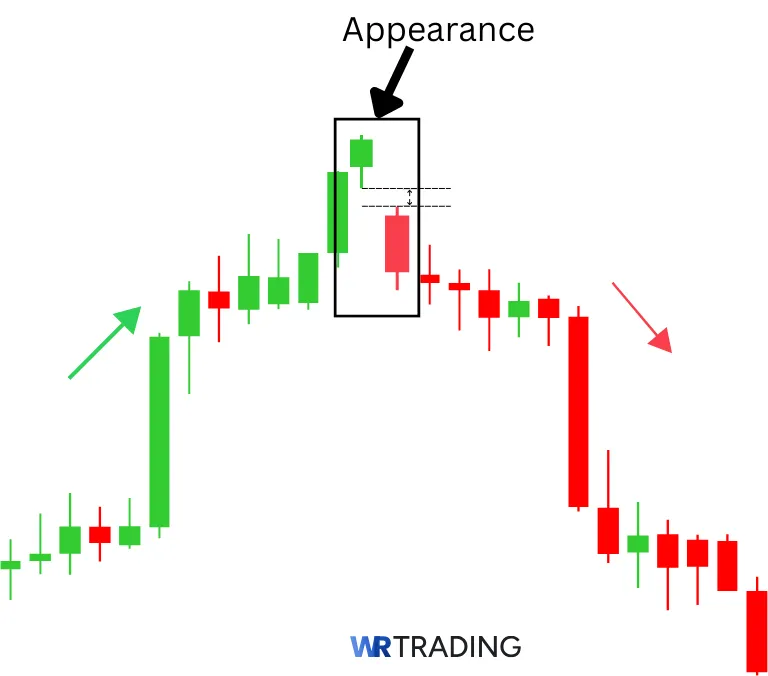
Confirmation comes from the structure of the second candle and its close. Weak closes invalidate the setup. Wait for the full candle to form. Do not enter mid-candle. The close is critical in validating the pattern’s strength.
#3 Open Your Trade – Entry Point
Once the Bearish Kicker is confirmed, we enter. Our entry method is precise. We wait for the confirmation candle to fully close, then enter with a stop or limit entry at 1–2 pips below the kicker candle’s low, depending on whether the market is trading above or below that level when we are entering. This ensures we avoid false signals and premature entries.
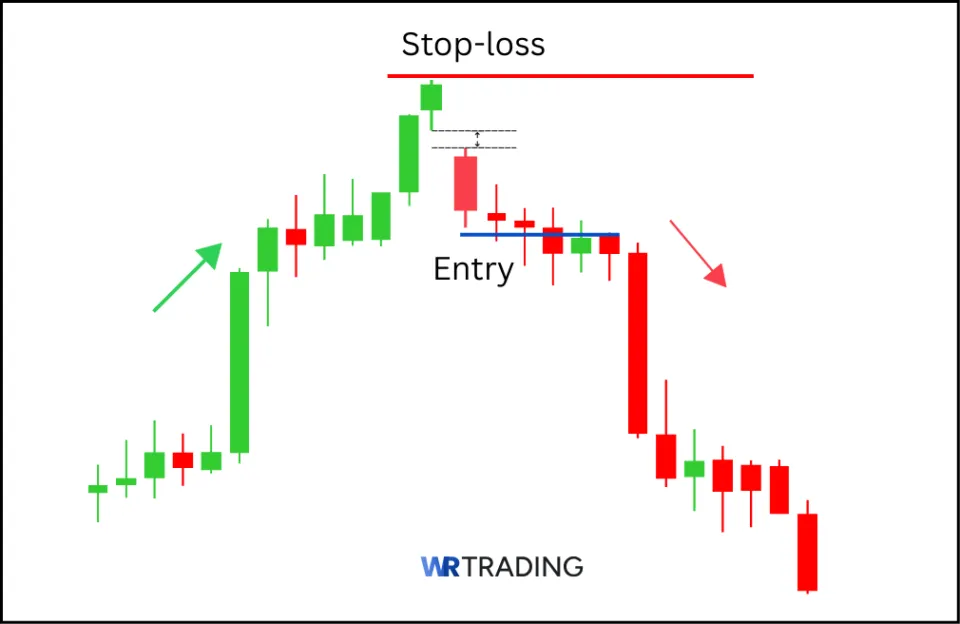
Place your stop loss above the high of the kicker setup. This gives the trade room to breathe while protecting against invalidation. Calculate your lot size based on the distance between your entry and stop-loss. Use a fixed-risk model (ideally 1–2% of your account) per trade. You can use a trusted position calculator to save time.
For stronger setups, combine the pattern with:
- RSI (14) divergence: Price making higher highs while RSI fails
- MACD histogram weakening or bearish crossover
- Volume drop on the final bullish candle
- Bearish engulfing or follow-through candles after the kicker
These combinations increase the hit rate and reduce false signals. According to research by Thomas Bulkowski, candlestick patterns like the kicker show higher accuracy when paired with resistance and confirmation signals.
#4 Choose Your Trading Take Profit
We base our exits on market logic and risk-reward alignment. Profit targets must be structured, not emotional.
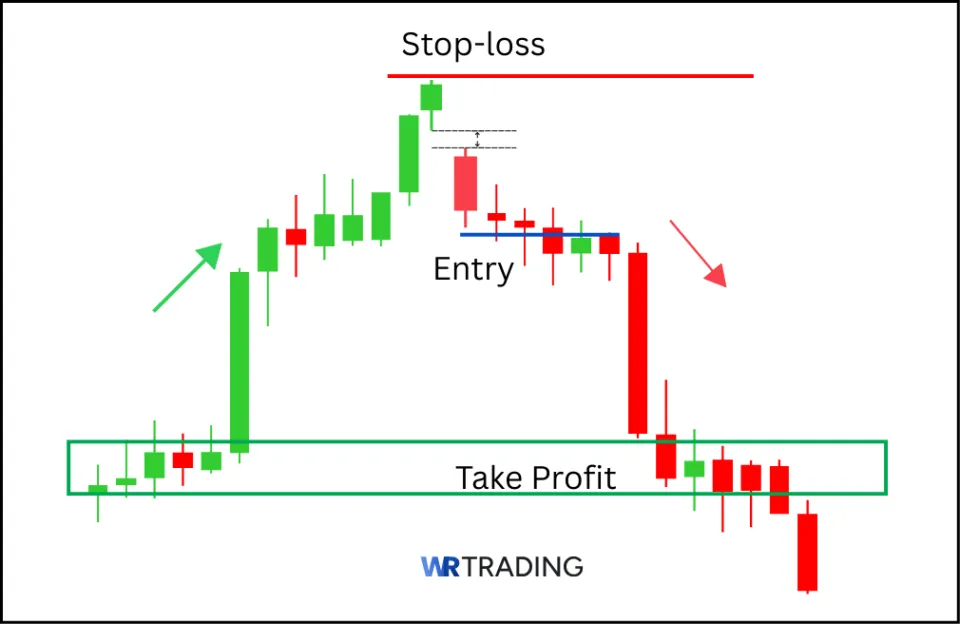
Here’s how we define the target:
- Use support zones or previous swing lows as realistic profit areas
- Calculate a 1:2 or 1:3 risk-to-reward ratio. For example, risking 20 pips to gain 40 or 60.
- Consider using trailing stops if the price breaks support and momentum continues
No trade is complete without a defined exit. The Bearish Kicker offers strong entry signals, but it is the structured exit plan that turns it into a sustainable edge.
(Learn To Trade And Read Candlestick Patterns Like A Pro)
What Is The Success Rate Of The Bearish Kicker Candlestick Pattern?
Based on stats presented by one researcher, Thomas Bulkowski, the Bearish Kicker has a tested success rate of 54%. Other researchers put the success rate of the bearish kicker pattern at 47%. Ideally, the success rate of the pattern ranges between 47% – 54% from trader to trader.
While its theoretical role is to mark a shift from bullish to bearish sentiment, actual test data shows that it performs at nearly random levels when traded without strong confirmation. Even in ideal conditions (bull market, down breakout), the pattern hit its price target only 51% of the time. So, it is advisable for traders to test this pattern first in simulated trading conditions to see how well it works for them before trading the pattern with real funds
How Accurate Is The Bearish Kicker Pattern?
After testing the bearish kicker signal extensively, we found that the pattern leads to bearish conditions 50% – 54% of the time. As such, we do not rely on this pattern in isolation. We reinforce it with technical confirmation like RSI divergence, MACD crossovers, or volume profile rejection. When the Bearish Kicker forms at a significant resistance zone and is supported by additional reversal signals, its accuracy increases.
What Are The Pros And Cons Of the Bearish Kicker Pattern?
Pros
- Effectiveness at resistance zones
- Signal/pattern clarity
- Multi-market utility
Cons
- Ineffectiveness in a downtrend
- Poor recognizability
What Are The Advantages Of The Bearish Kicker Pattern?
The biggest advantage of the Bearish Kicker is its clarity. The structure is simple; one green candle followed by a red one that gaps down with no overlap. This makes it easy to identify visually, even for newer traders. Here are some more advantages:
- Clear Reversal Signal: The Bearish Kicker delivers a fast and visible shift from bullish to bearish momentum, and it is ideal for spotting sudden reversals.
- Effective at Resistance Zones: Resistance levels by themselves have a decent probability of success. Therefore, combining the bearish kicker pattern with key resistance levels increases the overall probability of success of a trade.
- Multi-Market Versatility: It works reliably across alternative asset classes; including forex, stocks, and crypto on intraday or swing timeframes.
- Compatible with Indicators: Its accuracy improves when combined with tools like RSI, MACD, volume, or Fibonacci levels for technical confirmation.
What Are The Disadvantages Of The Bearish Kicker Pattern?
One key disadvantage is that the Bearish Kicker isn’t frequent. It forms under specific conditions, and that limits how often it can be used. It also requires proper confirmation. Without a supporting signal like bearish follow-through or confluence with resistance, the pattern can fail. Below are some other disadvantages:
- Rare Pattern Formation: The Bearish Kicker is uncommon due to its strict gap and candle requirements, making it hard to spot frequently.
- Weak in Low-Volume Markets: The pattern loses reliability in thin or choppy markets where price action lacks momentum.
- Ineffective in Downtrends: When used during a bearish trend, it loses its reversal context and may mislead traders.
- Prone to Misidentification: Without a clear gap and strong follow-through, the other two-candle patterns can be mistaken for a kicker.
Can The Bearish Kicker Fail?
Yes, and to a significant degree. The Bearish Kicker can fail when traders ignore context. If it appears without a clear uptrend, proximity to a support region, or during low-volume hours, it often breaks down. Lack of confirmation is the most common cause of failure. Price may gap down but reverse back up, creating a bull trap instead of a reversal. We treat the kicker as a signal, not a trigger, until the market proves sellers are truly in control.
Which Indicators Can Be Combined With The Bearish Kicker?
These tools help confirm that the Bearish Kicker pattern isn’t forming randomly, and that real bearish momentum is building behind the signal. Here are our top combinations:
| Indicator | Settings | Purpose |
|---|---|---|
| RSI | 14-period | Look for divergence or overbought readings (70+) near the kicker |
| MACD | 12, 26, 2009 | Spot a momentum shift or bearish crossover after the pattern forms |
| Volume Profile | Visible Range / Session | Detect areas where institutions may be offloading long positions |
| Bollinger Bands | 20-period, 2 std dev | Check for kicker forming at upper band rejection (mean reversal setup) |
| Fibonacci Retrace | 0.618 / 0.786 zones | Use to find strong resistance levels where the kicker is more effective |
| ATR (Average True Range) | 14-period | Measure volatility to define realistic stop-loss and profit target zones |
These combinations help filter out weak setups. For example, a kicker pattern that forms with RSI divergence, at a Fibonacci resistance, and on declining volume from buyers is far more likely to succeed than one that forms in isolation.
(Learn To Trade And Read Candlestick Patterns Like A Pro)
What Are Similar Patterns To The Bearish Kicker Pattern?
While the Bearish Kicker is unique in its gap-down structure, there are several other bearish reversal patterns that traders use in similar market conditions:
| Pattern | Type | Description |
|---|---|---|
| Bearish Engulfing | 2-candle reversal | A large red candle completely engulfs a prior green candle’s body |
| Evening Star | 3-candle reversal | Green candle, small-bodied candle. Then, a large red candle shows a slowdown and drop |
| Dark Cloud Cover | 2-candle reversal | Red candle opens above and closes below the midpoint of a strong green candle |
| Shooting Star | 1-candle reversal | Single red candle with long upper wick. It appears after an uptrend |
| Gravestone Doji | 1-candle indecision | Candle with long upper shadow and close near open/low, often near resistance |
All of these patterns appear in similar zones (resistance, overbought, extended moves) and signal a potential reversal. However, only the Bearish Kicker includes a gap, making it one of the strongest immediate rejection setups when confirmed properly. See more alternative patterns in our WR Trading Candlestick Pattern PDF.
What Is The Opposite Pattern Of The Bearish Kicker?
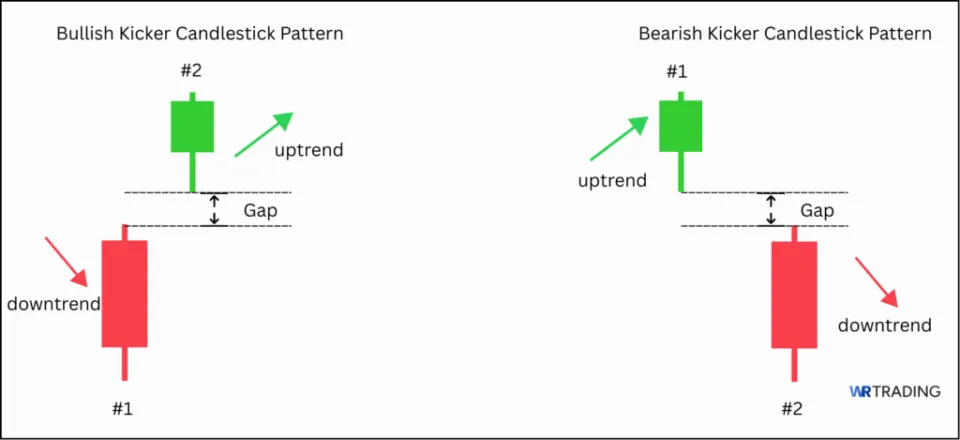
The opposite of the Bearish Kicker is the Bullish Kicker. It appears in a downtrend and signals a sudden, high-conviction reversal to the upside. It starts with a strong red candle followed by a gap-up green candle that opens above the first candle’s open and closes higher, without any overlap between the candle bodies.
What Is The Difference Between The Bearish Kicker And The Bullish Kicker Pattern?
The main difference lies in direction and trend context. The Bearish Kicker appears in an uptrend and signals a shift to bearish momentum. The Bullish Kicker appears in a downtrend and signals a bullish reversal. Structurally, both require a gap and two full-bodied candles in opposite directions, but the sentiment and outcome are reversed.
What Is The Difference Between The Bearish Kicker And Bearish Engulfing Pattern?
To clearly understand their differences, we will consider the following:
- Structure: The Bearish Engulfing pattern does not involve a gap. The red candle simply engulfs the body of the previous green candle.
- Overlap: Engulfing patterns have body overlap. The Bearish Kicker has no body overlap due to the gap.
- Psychology: The Kicker shows a more aggressive sentiment shift with a clean rejection via gap. Engulfing is slower but still a strong reversal signal.
- Use Case: We use engulfing patterns more frequently, but give higher weight to a confirmed Kicker when it occurs.
What Is The Difference Between The Bearish Kicker And Bearish Harami Pattern?
To fully understand their differences, let us consider:
- Structure: The Bearish Harami is a 2-candlestick inside bar pattern consisting of an initial long green/bullish candle, followed by a second small red/bearish candle whose open, high, low, and close, are all contained within the range of the initial bullish candle.
The bearish kicker pattern, on the other hand, consists of an initial long bullish candle, followed by a second bearish candle which gaps down from the open of the bullish candle. In other words, the open of the bearish candle occurs some pips below the open of the bullish candle, creating a price gap.
- Pattern implication: The Bearish Harami signifies a gradual shift in momentum from buyers to sellers, but the bearish kicker pattern signifies a sharp change in market sentiment.
- Candlestick Overlap: The bearish Harami requires the body of the second candle to be contained within the range of the first. Unlike the Harami pattern, the bearish kicker requires the second candle to open below the open of the first (bullish) candle, creating a gap downwards and zero containment.
What Are The Limitations Of The Bearish Kicker?
Among the many limitations of this signal, these are perhaps the most pressing:
- Appears less frequently compared to other patterns
- It is ineffective in choppy markets.
- Not suitable for scalpers and some other intraday traders
- Offers little warning, so reactive traders may miss the window without alerts.
Learn Pattern Trading With The WR Trading Mentoring
Our mentoring program is built to help traders master candlestick patterns like the Bearish Kicker inside real-world trading conditions. We show you how to identify, confirm, and execute these setups using structured strategies backed by data, psychology, and risk control.
Whether you’re trading forex, stocks, or crypto, our goal is to build your skillset so you don’t just trade patterns, but trade them with precision.
Our mentoring students get access to:
- Weekly live trading feedbacks and mentorship sessions
- Strategy breakdowns across multiple markets
- Trade reviews and feedback using WR Trading systems
- Custom tools and templates for candlestick-based entries and exits
If you’re interested in becoming a structured trader, not just a signal follower, this is where you sharpen your edge.
(Learn To Trade And Read Candlestick Patterns Like A Pro)
Conclusion: Mastering the Bearish Kicker Pattern with Structure and Confirmation
The Bearish Kicker is a powerful, two-candle reversal pattern that reveals a sharp sentiment shift from bullish to bearish. It works best in uptrends, near resistance, and when supported by tools like RSI, MACD, or volume analysis. While the pattern is rare, its clarity and intent make it one of the most reliable bearish formations when traded right.
We at WR Trading teach traders how to use patterns like this inside a structured system. Everything follows a plan, from identifying the setup to managing the entry, stop loss, and target. Join us today and make mastery of candlestick patterns a part of your trading toolkit.