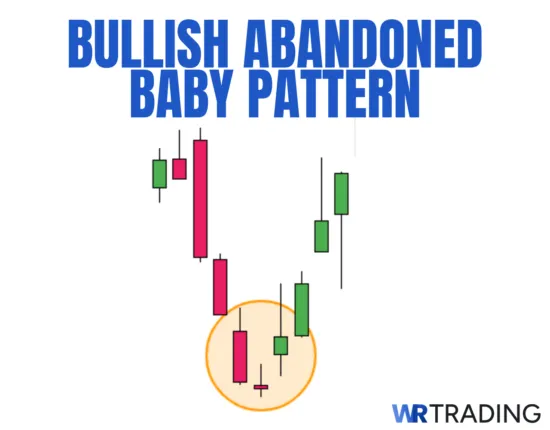
The Bullish Abandoned Baby is a rare three-candle reversal pattern that signals a shift from strong selling to aggressive buying.
It starts with a long red bearish candle, followed by a small doji or narrow-bodied candle that gaps down, and finishes with a strong green bullish candle that gaps back up, creating a clear separation on both sides of the middle candle. This gap isolation forms the “abandoned” structure that gives the pattern its name.
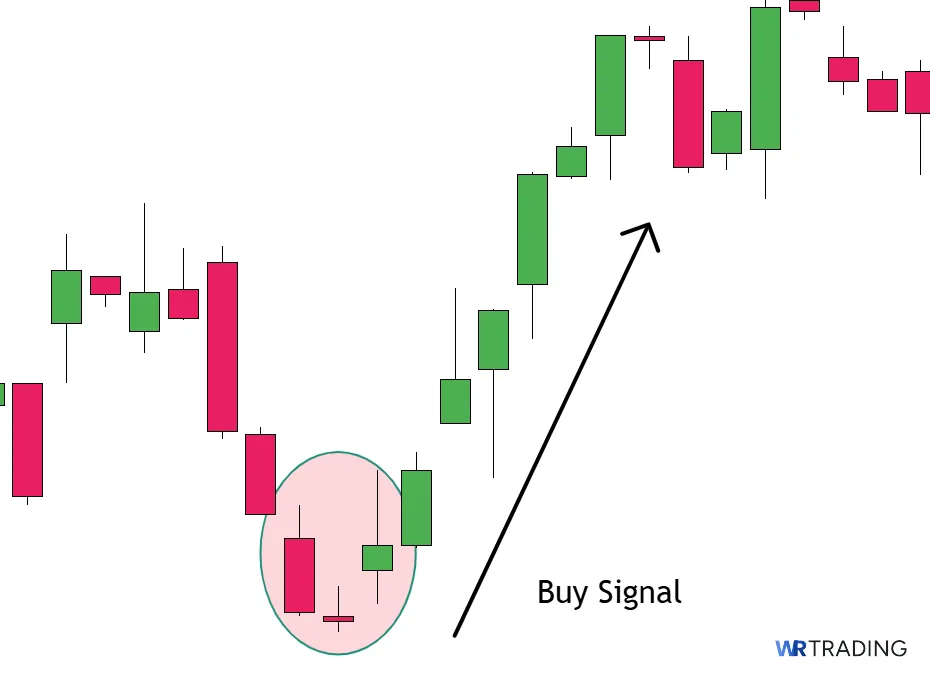
The pattern usually forms after a sharp decline and reflects a major change in sentiment. Sellers lose control as the second candle shows hesitation, and buyers return with conviction on the third, often triggering a short-term bullish reversal. Traders use it as a buy signal near support levels, swing lows, or after oversold readings when backed by confirmation tools.
Read on to learn everything you need to know about the Bullish Abandoned Baby candlestick pattern.
How Is The Bullish Abandoned Baby Candle Structured:
- Construction – First Candle: A large bearish candle that extends the existing downtrend. It closes near the low and reflects strong selling momentum still in control at that point in the move
- Second Candle: A small-bodied candle or doji that opens with a gap below the first candle’s close. It must be fully separated from both the first and third candles, with no overlap
- Third Candle: A strong bullish candle that gaps above the second candle and closes well into the upside
- Forecast: Signals a potential shift to buying pressure and an upward reversal if confirmed by follow-up candles
- Type of Pattern: Three-candle bullish reversal pattern
- Trend Prior to Pattern: Emerges after a downward price move, pointing to a possible bullish turnaround
- Opposite Pattern: Bearish Abandoned Baby
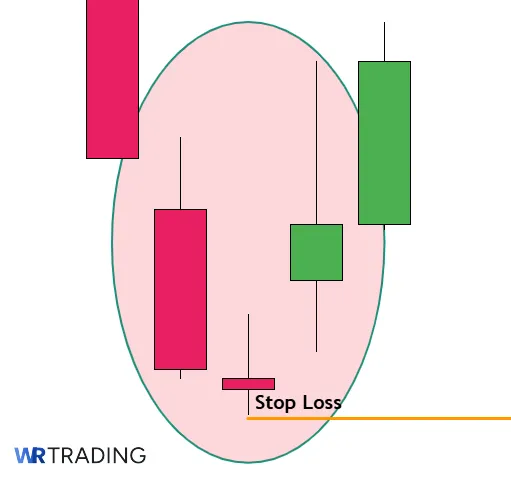
- Stop-Loss Placement: Commonly placed just below the second candle’s low (the “abandoned” candle), limiting risk on a reversal trade
(Learn To Trade And Read Candlestick Patterns Like A Pro)
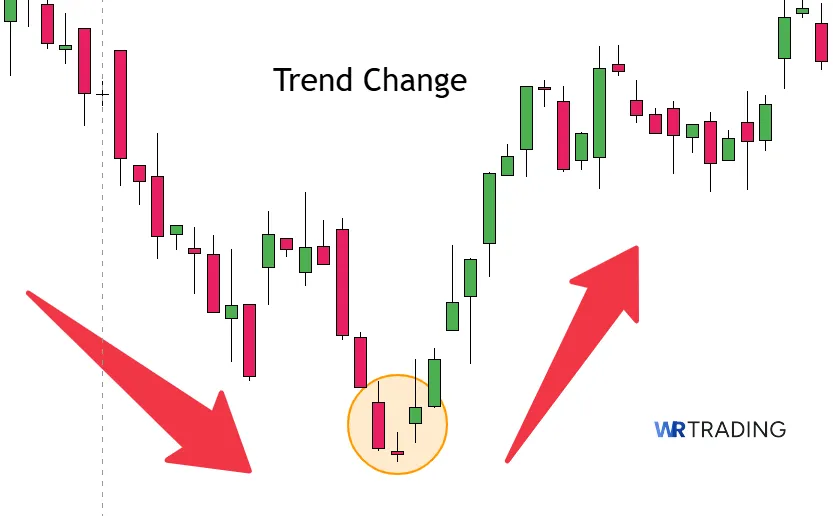
How Does a Bullish Abandoned Baby Candlestick Pattern Form in the Chart?
The Bullish Abandoned Baby candlestick pattern forms after a clear downward move when the selling pressure begins to lose strength. The first candle closes firmly bearish, continuing the trend. The next session opens with a gap below that closes and prints a small-bodied candle that shows indecision, often with very little range.
What follows is a strong shift in sentiment. The third candle opens above the second candle’s range and closes much higher, creating a clean separation. This price action signals that sellers have lost control and buyers are now stepping in with enough strength to push the market in the opposite direction.
What Does the Bullish Abandoned Baby Candlestick Pattern Indicate?
A Bullish Abandoned Baby pattern suggests that sellers might have exhausted their momentum at lower levels. By the time the second candle forms, the downward pressure loses strength, leaving a candle that barely moves from open to close. This candle often feels “isolated,” with a gap on either side, which can indicate the market is caught off-guard.
Following that isolation, a sharp bullish gap appears, starting the third candle with fresh upward momentum. Buyers step in with conviction, pushing the price higher and causing many traders who were still bearish to exit their positions. From a psychological angle, the market transitions from a moment of pessimism (first candle) to hesitation (second candle) and to strong optimism (third candle).
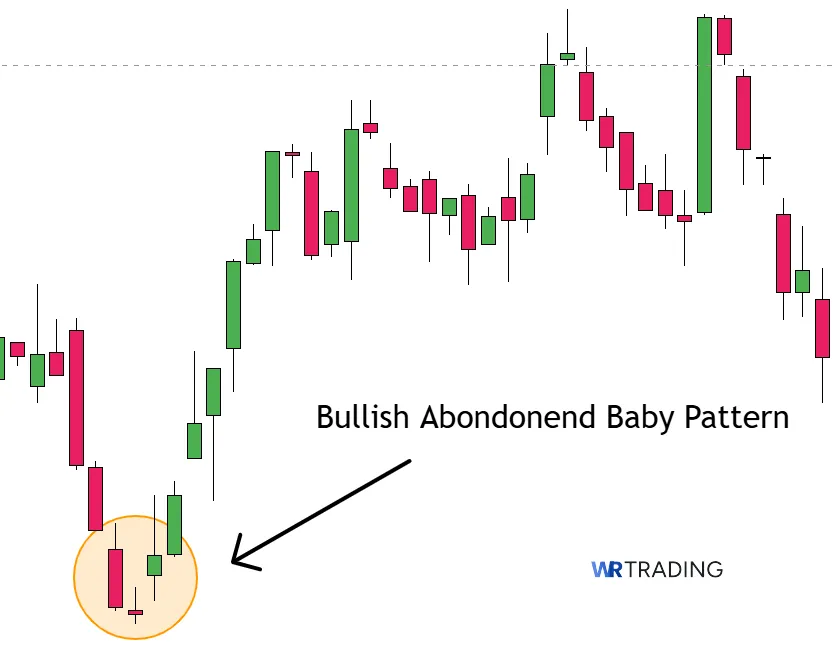
Example of the Bullish Abandoned Baby Pattern in the Chart
EUR/USD had been under steady pressure, trending downward into mid-January. On January 16, a small doji candle printed around 1.2670, gapping down slightly from the previous bearish candle. The following session gapped up and closed strong near 1.2790, fully completing the Bullish Abandoned Baby formation with clear separation on both sides of the middle candle.

This pattern shows a sharp change in momentum. The third candle not only filled the previous gap but also signaled the return of buying interest, with price continuing higher in the days that followed. It’s a solid example of how this pattern can reverse sentiment and trigger a new leg to the upside.
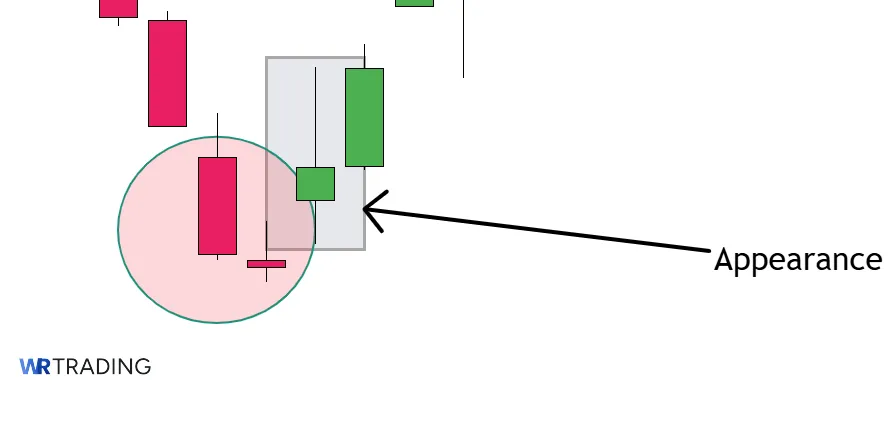
How to Identify a Bullish Abandoned Baby Candle in the Chart?
To find the Bullish Abandoned Baby, scan for a gap down followed by a small-bodied candle or doji that is completely isolated. This middle candle should not overlap the previous or the next candle in any way. After that, a strong green candle must gap up and close well above the small candle’s range, signaling that buyers have stepped in aggressively.

The Bullish Abandoned Baby forms after a clear downward move, often following a sharp selloff or a consistent string of red candles. The chart will usually show strong bearish momentum with little sign of support.
You’ll want to search for this setup near previous swing lows, strong support levels, or zones where price has reversed in the past. It stands out most after extended bearish moves or during emotionally driven drops where the price becomes oversold. These areas give the pattern more weight and make the reversal more likely to hold.
(Learn To Trade And Read Candlestick Patterns Like A Pro)
How to Trade the Bullish Abandoned Baby Candlestick Pattern
Spotting the Bullish Abandoned Baby can be rewarding when trading it, but success depends on how you interpret the overall market setting and manage risk. Here’s a quick guide on how to find the pattern, wait for its appearance, open the trade, and finish the trade goal:
- Find the Right Candlestick Pattern Setup
- Wait for the Appearance
- Open Your Trade
- Choose Take Profit
- Choose Stop Loss
1. Find the Right Bullish Abandoned Baby Candlestick Pattern Setup
You should only consider this pattern after a clear downtrend has developed. Look for a chart that shows consistent lower highs and lower lows. Avoid sideways markets where momentum is lacking.
Use indicators like the RSI or Stochastic Oscillator to check for oversold conditions before the pattern appears. A reading below 30 on RSI or under 20 on Stochastic supports the idea that the trend may be stretched. Volume can also be useful; if volume spikes on the third candle, it confirms real interest from buyers.

Furthermore, the pattern is more reliable when it forms near a strong support zone, a previous swing low, a Fibonacci retracement level like the 61.8 percent zone, or a round number such as 100 or 1500. These are areas where buyers react.
2. Wait for the Appearance of the Bullish Abandoned Baby Candle
Do not anticipate the pattern or guess that it will form. Wait for all three candles to close before doing anything. If there’s no clear gap between the first and second candle or the second and third, the setup isn’t valid.
Focus on higher timeframes like the 4-hour or daily chart. These offer cleaner setups with less noise and more follow-through. On these timeframes, a proper gap combined with a strong green candle on day three is a clear sign that momentum has shifted. Make sure the second candle has a small body and does not overlap the first or third. If the gaps aren’t obvious or the middle candle shows too much range, skip it.
3. Open Your Trade – Entry Point
There are two common ways to enter the setup of the Bullish Abandoned Baby: aggressive and conservative.
- Aggressive: The aggressive method involves entering at the close of the third candle. This gives you better price positioning, but there’s a higher risk of a pullback before the move continues. If you use this method, it’s smart to reduce your position size slightly to account for the lack of confirmation.
- Conservative: The conservative method waits for the next candle to break above the third candle’s high. This gives you added confirmation, but the trade-off is a slightly worse entry price. Either way, check if the breakout is supported by volume. If the breakout happens on weak volume, it might be a trap.
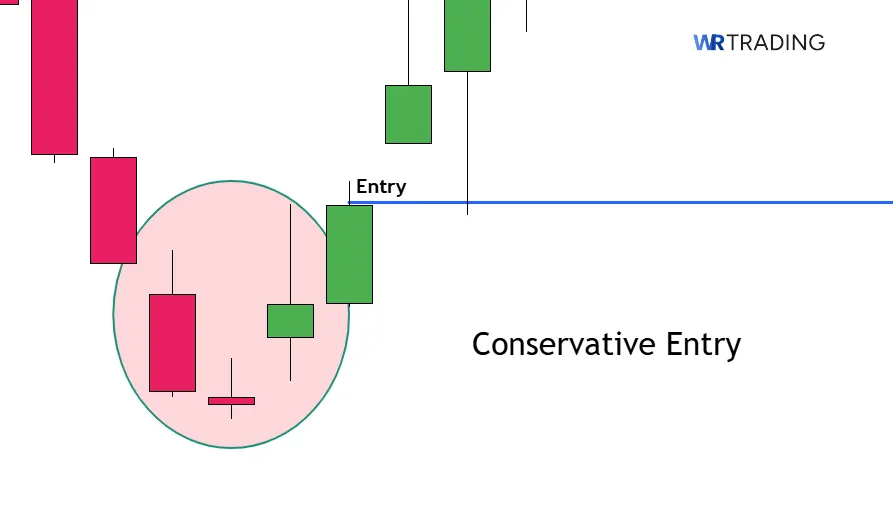
Some traders also wait for a retest of the gap zone before entering. This means waiting for the price to dip back toward the third candle’s opening level before it climbs again. This entry offers better risk-to-reward, but you risk missing the move entirely. Ensure you use all the mentioned confirmation tools to get the best entry.
4. Choose the right Stop Loss
The stop-loss of the Bullish Abandoned Baby should go below the low of the second candle. That low is a key point in the structure, as if the price breaks below it, the pattern has failed. Don’t place your stop too tight, or you’ll get knocked out by normal volatility.
Once your stop is defined, use a position size calculator to figure out how many units to trade. For example, if you’re risking 1 percent of your account and your stop is 30 points away, make sure the position size reflects that limit. This prevents overexposure and keeps your strategy consistent.
5. Choose Your Trading Take Profit
Your first target of the Bullish Abandoned Baby should be the nearest resistance level above the pattern. This could be a recent swing high or a price zone where sellers previously stepped in. If there’s no clear resistance nearby, use a measured move based on the size of the third candle. Many traders apply a fixed risk-to-reward ratio, such as 2:1 or 3:1.
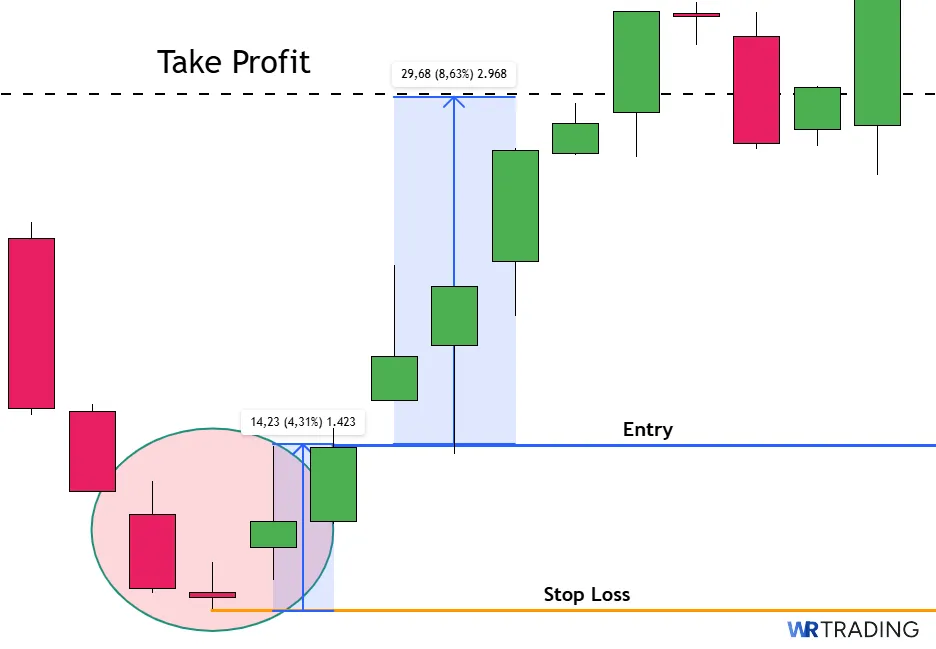
You can also scale out of the position. Take partial profits at the first resistance level and move your stop to breakeven for the remaining portion. This locks in gains while giving you room to benefit if momentum continues.
(Learn To Trade And Read Candlestick Patterns Like A Pro)
What Can Be a Confirmation for the Bullish Abandoned Baby Candlestick Pattern?
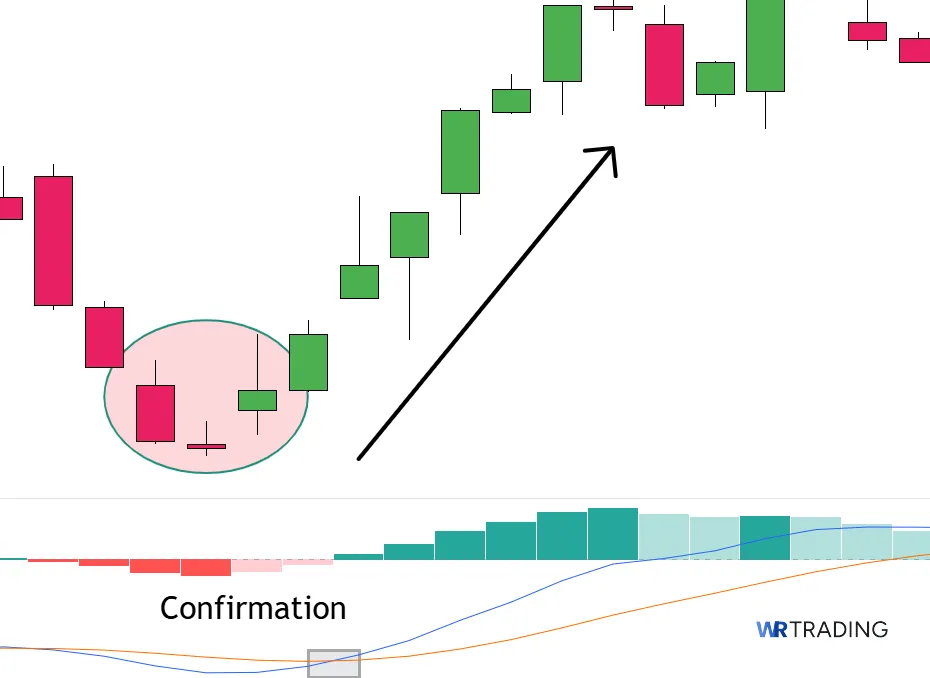
Confirmation is what separates a clean reversal signal from a failed bounce. Without it, the pattern might look valid but fade quickly. Here are real signals that traders use to confirm the Bullish Abandoned Baby before committing to a trade.
- A strong bullish candle closes above the third candle’s high: This is the most direct form of confirmation. If the candle following the Bullish Abandoned Baby pushes higher and closes well above the previous high, it shows buyers are in control. It also reduces the risk of a false breakout.
- Volume spikes during or after the third candle forms: Heavy volume signals buying interest. If volume increases sharply while the third candle is forming or right after, it shows institutional traders may be entering. Low volume can mean the move is weak and short-lived.
- RSI starts rising from an oversold level: A confirmed pattern combined with RSI pushing up from below 30 adds strength to the setup. It suggests that bearish momentum has faded and bullish pressure is building. The steeper the recovery in RSI, the better the follow-through tends to be.
- MACD crosses above the signal line: When the MACD line crosses above the signal line after the third candle forms, it suggests a momentum shift. This can work well for traders who prefer slightly delayed but more reliable entries. The MACD confirmation is stronger when the crossover happens near the zero line.
- Pattern forms at a known support zone or previous demand area: If the Bullish Abandoned Baby appears near a price level that has previously held as support, the setup has more weight. It shows that buyers are stepping in again at a proven level. Support zones can be horizontal levels, round numbers, or areas marked by previous lows.
- Breakout above a descending trendline: If the price breaks through a well-defined trendline shortly after the pattern forms, it can confirm a reversal. The breakout shows that the longer-term structure is shifting. This is especially useful when the pattern appears after several failed attempts to break lower.
- Stochastic indicator crosses upward below the 20 level: The Stochastic crossing up from oversold territory is a sign of price momentum reversing. When this lines up with the Bullish Abandoned Baby, it gives extra confidence in a bounce. You can also look for bullish divergence on Stochastic for added weight.
Does the Bullish Abandoned Baby Pattern Mean Buy or Sell?
The Bullish Abandoned Baby candlestick pattern is a buy signal. This pattern signals a possible reversal from a bearish trend into a bullish one. Once the structure completes with a clear gap between all three candles and a strong green close on the third, it suggests that buyers are stepping in with force. Traders treat this as a buying opportunity when it lines up with support zones, oversold readings, or confirmation signals.
What Is the Hit Rate of the Bullish Abandoned Baby Pattern?
According to Thomas Bulkowski’s Encyclopedia of Candlestick Charts, which is one of the most cited sources for pattern performance, patterns like this have shown success rates between 60% and 70% when confirmed by a breakout.
(Learn To Trade And Read Candlestick Patterns Like A Pro)
What Are Possible Strategies for the Bullish Abandoned Baby Candlestick Pattern?
The Bullish Abandoned Baby isn’t a pattern you just trade on sight. It needs to be backed by real structure and a method that fits your trading style. The strategies below are practical, built for different setups, and based on how actual traders use this formation on the chart.
You can mix these strategies with confirmation tools like RSI, MACD, or key price levels to increase your odds of success. The goal is to filter out weak versions of the pattern and only act when multiple factors line up:
- RSI Divergence
- Retest Gap
- Volume Breakout
RSI Divergence With the Pattern
Combine the Bullish Abandoned Baby with classic RSI divergence to confirm momentum exhaustion. Start by looking for the pattern to appear after a strong downtrend where the price is still making lower lows. If RSI begins to print higher lows while price continues dropping, this signals hidden buying pressure. Once the pattern appears, it acts as the final confirmation that the market is turning.
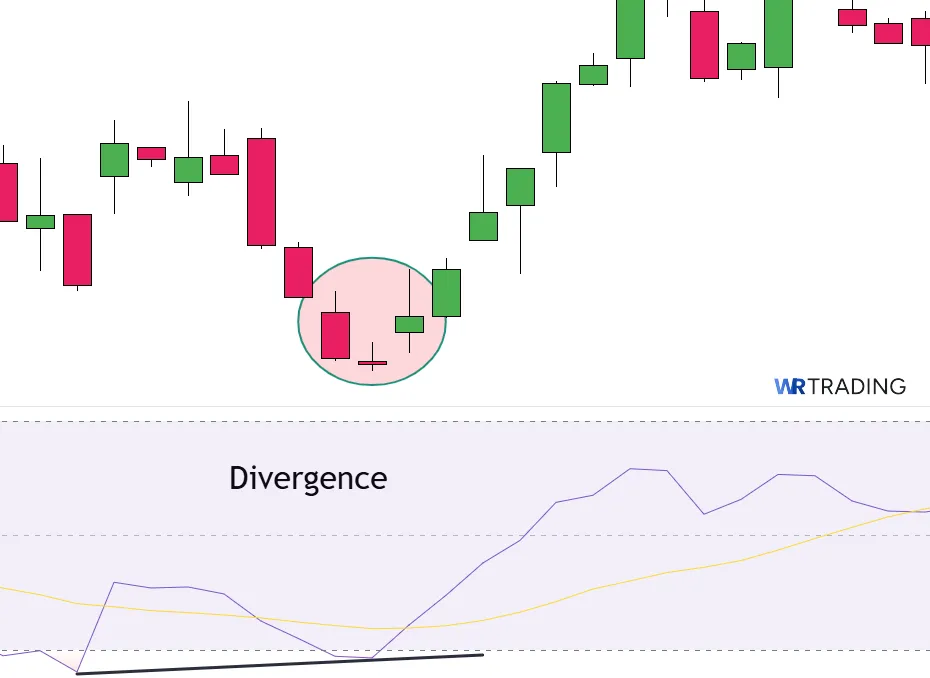
Enter when the third candle closes or on a break above its high. Your stop should be placed under the lowest point of the pattern. RSI should be rising out of oversold territory, preferably from under 30, at the same time the third candle confirms. This strategy is more selective but offers a cleaner entry with higher-quality setups that often lead to stronger follow-through.
Retest of the Gap Zone
Instead of entering right after the third candle, this strategy waits for the market to pull back into the space between the second and third candles. That gap often acts as short-term support, and if the price finds buyers again in that area, it offers a more favorable risk-to-reward ratio. You’ll need patience for this approach, but the payoff is a tighter stop and better entry.
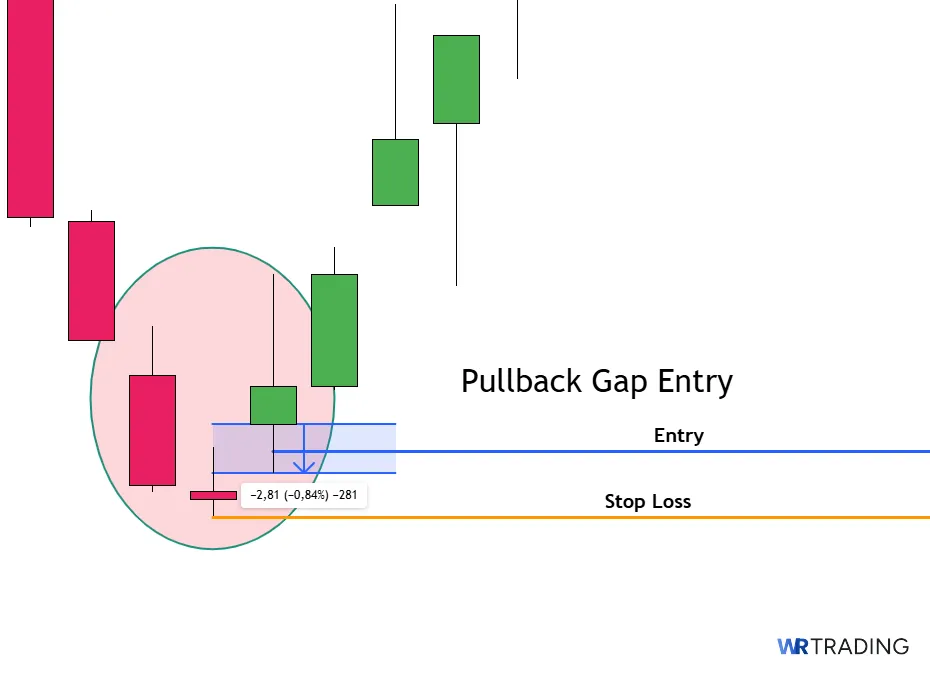
Use a horizontal line to mark the open of the third candle and watch how the price reacts if it returns to that level. Enter once a bullish rejection forms inside or just above that zone. Set your stop below the low of the gap or below the second candle’s low. Take profit near resistance or use a trailing stop once the price breaks above the recent high.
Volume-Based Breakout Entry
The volume-based strategy focuses on confirmation through mass buy orders. Once the Bullish Abandoned Baby pattern completes, check if volume increases noticeably on the third candle. That’s the first sign of real participation. If the next candle breaks above the third candle’s high and volume continues to build, it suggests momentum is picking up. These breakouts tend to attract more buyers and can move fast.
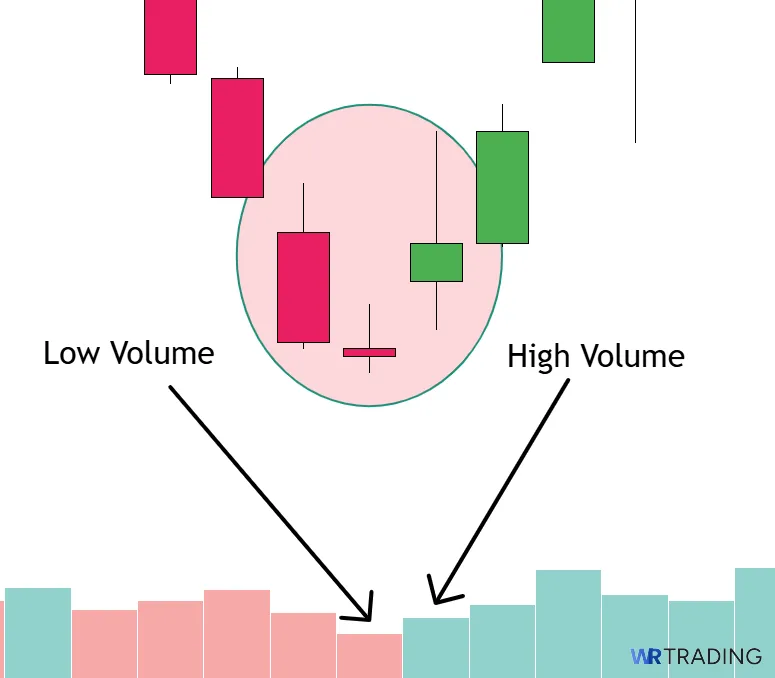
Enter after the breakout candle confirms the move. This means waiting for a strong bullish candle that clears the third candle’s high and closes near its top. Stop-loss goes just below the second candle’s low, and your target can be measured using a fixed ratio or by identifying the next structure level on the chart. It works well when news, earnings, or market catalysts trigger the reversal and bring in real volume.
What Are the Pros and Cons of Trading the Bullish Abandoned Baby Candle Pattern?
Like any reversal pattern, the Bullish Abandoned Baby has strengths that make it useful in the right conditions. However, it also comes with drawbacks that traders should know. The list below breaks down the main pros and cons to help you decide when the setup is worth acting on and when it might be better to wait.
Pros
- Clear visual structure with two price gaps
- Strong signal of momentum reversal
- Works well near major support zones
- Easy to set risk using the second candle’s low
- Can be used to catch bottoms early
Cons
- Rare pattern due to strict gap requirements
- Not suited for all market environments
- Easy to mislabel with incomplete gaps
- Relies heavily on confirmation
- Loses power during strong trends
What Are the Advantages of the Bullish Abandoned Baby Pattern?
The Bullish Abandoned Baby pattern gives traders a strong reversal setup that’s easy to spot when it forms cleanly. Its distinct structure makes it less subjective than many patterns, and when confirmed, it often signals the start of a sharp bullish reaction. These advantages explain why it remains a valuable tool despite its rarity.
- Clear visual structure with two price gaps: The Bullish Abandoned Baby includes a large red candle, a gapped-down doji or small-bodied candle, and a gapped-up bullish candle. That visual gap on both sides of the middle candle makes it easy to identify when scanning charts. Once you know the structure, spotting clean setups becomes more straightforward.
- Strong signal of momentum reversal: The shift from heavy selling to strong buying within three candles is a clear reversal message. It often shows up when sellers are exhausted, and buyers step in decisively. This momentum flip helps traders catch the start of a move rather than chasing later.
- Works well near major support zones: When the Bullish Abandoned Baby forms near previous swing lows or demand zones, it becomes even more reliable. These levels attract institutional buyers and offer natural price floors. Combining the structure with location increases the odds of success.
- Easy to set risk using the second candle’s low: The pattern gives a natural stop-loss level just below the low of the middle candle. This keeps the risk tight and objective. Traders can measure and control risk without needing extra indicators.
- Can be used to catch bottoms early: Because the Bullish Abandoned Baby often forms after extended selloffs, the pattern gives traders a chance to enter early before a larger reversal. This makes it attractive for swing traders who want to buy when others are fearful. Catching the start of a move allows for stronger risk-to-reward setups.
(Learn To Trade And Read Candlestick Patterns Like A Pro)
What Are the Disadvantages of the Bullish Abandoned Baby Pattern?
Although the Bullish Abandoned Baby can be effective, it also comes with a few practical limitations. Its setup conditions are strict, and it doesn’t appear often in many markets. Understanding these weaknesses can help you avoid low-quality setups or forced trades.
- Rare pattern due to strict gap requirements: Clean gaps on both sides of the middle candle don’t happen often. In forex or crypto, where price moves 24/7, this structure rarely forms. That means traders may go weeks without seeing a valid Bullish Abandoned Baby setup.
- Not suited for all market environments: The Bullish Abandoned Baby performs poorly in sideways or low-volatility markets. Without strong trend exhaustion or emotional price swings, it lacks the impact needed to reverse price. Traders trying to use it everywhere will likely be disappointed.
- Easy to mislabel with incomplete gaps: Some setups look close but don’t have full separation between candles. Traders new to the pattern often mistake similar structures for the real thing. Mislabeling leads to unreliable trades and poor entries.
- Relies heavily on confirmation: By itself, the Bullish Abandoned Baby isn’t enough to justify a trade. Without a volume spike, momentum shift, or indicator support, it’s often ignored by the market. That limits its usefulness unless paired with confluence.
- Loses power during strong trends: When the price is trending hard, one pattern may not be enough to reverse it. The third candle may print, but the larger downtrend can continue. This is why context matters more than just the candles alone.
Can the Bullish Abandoned Baby Pattern Have Failure Signals?
Yes, even when the structure of the pattern looks clean, the market doesn’t always follow through. Without confirmation or when the setup appears in the wrong context, the pattern can fail and lead to continued selling.
- The third candle forms against strong trend momentum: If the broader downtrend is still steep and supported by heavy volume, one pattern alone won’t reverse it. You may get a bounce, but the sellers often come back quickly and push the price lower. In this case, the pattern gets overwhelmed by the dominant trend.
- The gap between the second and third candle gets filled immediately: When the market retraces and fills the bullish gap right after it forms, it shows that buyers weren’t committed. The price quickly returns to the area around the abandoned candle, which erases the strength of the signal. This often leads to more downside.
- News or events contradict the signal: If negative news, earnings reports, or macro events occur just after the Bullish Abandoned Baby forms, technical setups can break down fast. Fundamentals still matter, especially around major headlines. When sentiment turns bearish again due to news, the pattern is often ignored.
- The pattern forms inside a consolidation range: If the Bullish Abandoned Baby shows up in the middle of a sideways market, it loses most of its meaning. Without a clear trend leading into it, there’s no momentum to reverse. Traders end up trapped when the price continues to chop without direction.
- Low volume during the third candle: A strong green candle without volume behind it is often just a technical move or short-term reaction. If there’s no interest from large players, the move lacks conviction. Low-volume reversals tend to fade quickly.
- Bearish candle forms right after the pattern completes: If the next candle after the setup is red and closes near the low, it shows buyers lost control right away. This is often a sign that the bounce was weak and short-lived. Patterns that reverse instantly tend to be unreliable.
- Pattern forms during low-liquidity periods: If the Bullish Abandoned Baby appears during quiet trading hours or in illiquid markets, gaps may be exaggerated. These setups often don’t reflect real supply or demand, and the moves tend to reverse once volume returns. This is common in after-hours equity markets or certain crypto pairs.
- No confirmation from indicators or structure: When the pattern forms without confluence from RSI, MACD, trendlines, or support zones, the odds of success drop. You’re relying on candles alone, which increases the chance of a false signal. Confluence adds weight to any reversal setup.
Which Indicators Can Be Combined With The Bullish Abandoned Baby?
The Bullish Abandoned Baby becomes more reliable when paired with confirmation from technical indicators. Below are the most commonly used tools and the settings traders apply when validating this pattern:
- Relative Strength Index (RSI – 14): Look for RSI falling below 30 before the Bullish Abandoned Baby forms, then turning back upward as the third candle confirms the Bullish Abandoned Baby. This shift suggests the market is recovering from an oversold condition, aligning well with the reversal.
- Moving Average Convergence Divergence (MACD – 12, 26, 9): A MACD crossover near or just after the pattern adds momentum confirmation. If the signal line crosses above the MACD line shortly after the third candle, it supports the idea that buyers are stepping in with strength.
- Volume (20-period SMA overlay): Watch for a volume spike on the third candle. A big increase in volume compared to the 20-period average often shows that real buying pressure is entering the market, confirming the reversal.
- Stochastic Oscillator (14, 3, 3): A bullish crossover in the oversold zone (below 20) that occurs during or right after the Bullish Abandoned Baby pattern gives early confirmation that momentum is shifting in favor of buyers.
- 50-period Simple Moving Average (SMA): If the pattern forms near or just below the 50-SMA, a close above it on the third candle suggests a stronger shift in sentiment. The moving average can also act as dynamic support after the reversal begins.
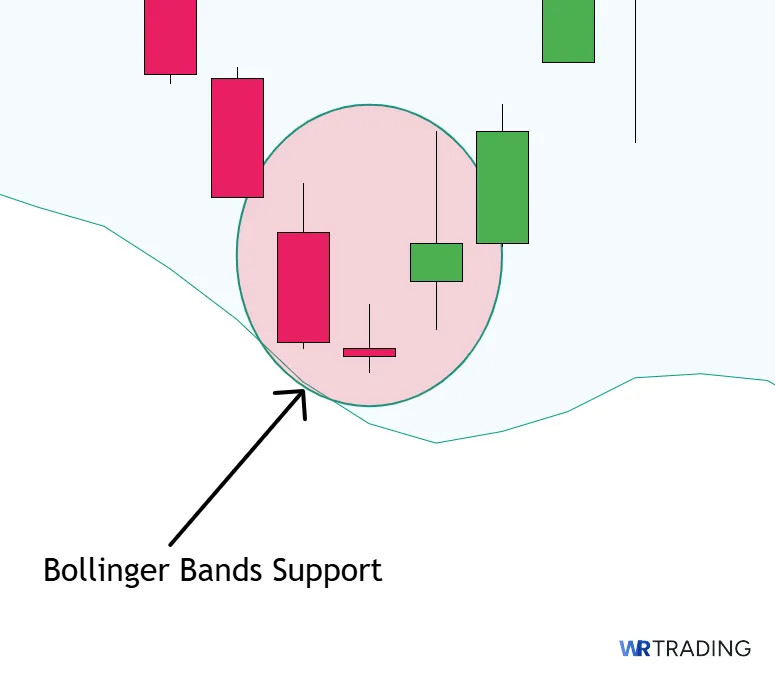
- Bollinger Bands (20, 2): The pattern is more reliable when the middle candle forms outside or near the lower Bollinger Band. A break back inside the bands on the third candle shows a potential mean reversion and a strong bounce setup.
Alternatives to the Bullish Abandoned Baby Pattern:
| Pattern | Type of Pattern | Best Use Case | Key Characteristic / Condition |
|---|---|---|---|
| Rising Three Methods | Bullish continuation pattern | Trending markets where the price pauses before continuing higher | A strong bullish candle, followed by three smaller candles holding the range, then another push upward |
| Bullish Separating Line | Two-candle bullish continuation | Spotting aggressive continuation after a short-term pullback | First candle is bearish, second opens at the same price and closes bullish, rejecting the dip |
| Stick Sandwich | Bullish reversal pattern | Appears near support when a bounce is expected | Two bullish candles surrounding a bearish one that closes at the same level as the first |
| Bullish Tri-Star | Three-candle bullish reversal | Extremely rare bottom signal in oversold conditions | Three consecutive doji candles, the second one gapped below the first and the third |
| On-Neck Pattern | Bullish continuation or short-term reversal | Appears after pullbacks in stronger trends | Bearish candle followed by a small bullish candle closing near the low of the previous bar |
To find more alternatives, check out our 50 Candlestick Patterns PDF Bible for free.
(Learn To Trade And Read Candlestick Patterns Like A Pro)
Bullish Abandoned Baby Pattern vs Bearish Abandoned Baby Pattern
The Bullish and Bearish Abandoned Baby patterns share the same structure but form in opposite market conditions. The bullish version appears after a decline and signals a possible shift from selling to buying, while the bearish version shows up after a rally and indicates that buyers are losing strength.
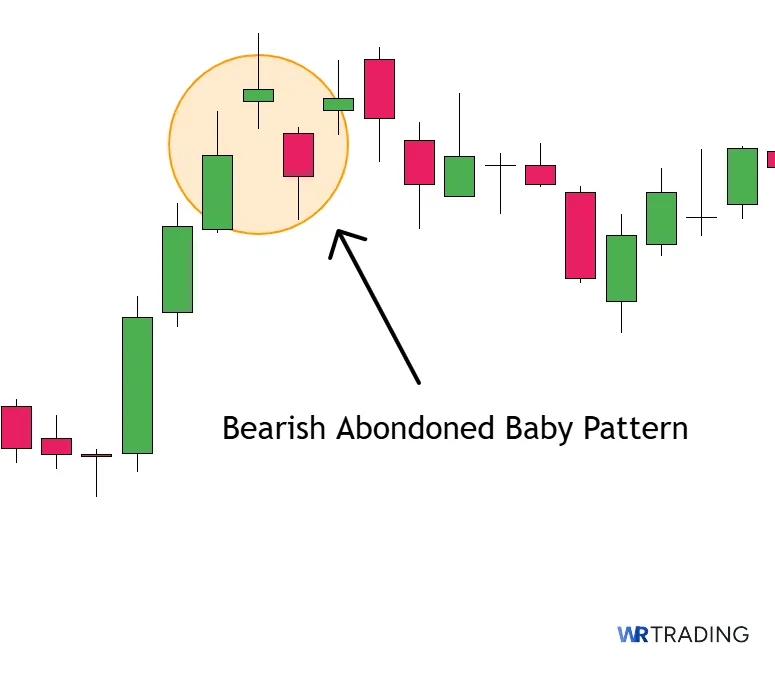
One starts with a red candle and ends with a green one; the other starts with green and ends with red. Their location on the chart, direction of momentum, and trading intent – long versus short – are all reversed.
| Section | Bullish Abandoned Baby Pattern | Bearish Abandoned Baby Pattern |
|---|---|---|
| Construction | First candle: bearish close in a downtrend. Second candle: gapped-down small-bodied or doji. Third candle: gapped-up strong bullish close. | First candle: bullish close in an uptrend. Second candle: gapped-up small-bodied or doji. Third candle: gapped-down strong bearish close. |
| Forecast | Suggests that selling momentum has faded and buyers are stepping in, often leading to a bullish reversal. | Indicates that buying momentum has stalled and sellers have regained control, often triggering a bearish reversal. |
| Type of Pattern | Three-candle bullish reversal pattern. | Three-candle bearish reversal pattern. |
| Trend Prior to Pattern | Appears after a decline or extended selloff. | Appears after a rally or extended upward move. |
| Opposite Pattern | Bearish Abandoned Baby. | Bullish Abandoned Baby. |
| Stop-Loss Placement | Often placed just below the low of the second candle to limit risk if the pattern fails. | Often placed just above the high of the second candle to control risk if price continues rising. |
What Are The Limitations Of The Bullish Abandoned Baby?
Even though the Bullish Abandoned Baby can be a strong reversal signal, it’s not perfect. Certain conditions can reduce its reliability, especially when the structure isn’t clean or the context doesn’t support a reversal.
- The pattern is rare and doesn’t appear often in most markets.
- Weak gaps or overlapping wicks reduce the strength of the setup.
- It becomes less reliable in sideways or low-volume markets.
- Without confirmation from indicators or support zones, false signals are common.
- Sudden news events can override the pattern and invalidate the signal completely.
Learn Pattern Trading With the WR Trading Mentoring
The WR Trading Mentoring program is designed to help traders move beyond recognizing patterns like the Bullish Abandoned Baby and start applying them in real strategies with structure and confidence. Through hands-on training, students learn how to read price action, identify high-probability zones, and build trade plans using confirmation tools like support levels, volume behavior, and momentum indicators.
The mentoring emphasizes context, teaching you when a pattern matters and when it should be ignored. Risk management is a core part of the process. You’ll learn how to size positions based on account risk, place stop-losses using chart structure instead of guesswork, and develop a repeatable method for handling trades from entry to exit. The goal is to build consistency, not just chase setups. If you want to understand how to trade patterns like this and avoid the typical trial-and-error mistakes, WR Trading offers the environment to learn that properly.
(Learn To Trade And Read Candlestick Patterns Like A Pro)
Conclusion: The Bullish Abandoned Baby Candlestick Pattern is a Powerful Rare Reversal Signal
The Bullish Abandoned Baby is a pattern that doesn’t show up often, but when it does, it displays a strong buy signal. Its clean three-candle formation with two gaps highlights a sharp shift in control, where sellers give up and buyers step in decisively. It works best in oversold markets, near support levels, or after emotional selloffs that leave traders off balance.
However, like any setup, it needs confirmation. Volume spikes, indicator support, and market context all help turn the pattern into a valid trade. Used on its own, it can produce false signals, but when filtered with proper analysis, it becomes a reliable tool for spotting short-term reversals.
FAQs: Most Frequently asked Questions on Bullish Abandoned Baby Candlestick
What Is Required for a Bullish Abandoned Baby to Be Valid?
You need three candles: a bearish candle, a small-bodied candle that gaps down, and a strong bullish candle that gaps up. The gaps on both sides of the middle candle are required. Without that separation, the pattern doesn’t meet the criteria.
Does the Pattern Need to Form on a Specific Timeframe?
It works best on higher timeframes like the 4-hour or daily chart. These reduce noise and give the gaps more significance. On lower timeframes, it’s more likely to produce false signals.
Is the Bullish Abandoned Baby a Beginner-Friendly Pattern?
It’s not the easiest pattern to learn because of its specific structure and rarity. However, once you understand what to look for, it becomes easier to spot. You still need confirmation and confluence to trade it effectively.
How Can I Increase the Pattern’s Success Rate?
Look for confluence with other tools like RSI, volume spikes, or support zones. Confirmation from the next candle breaking above the third candle’s high also helps. Avoid trading it in sideways or low-volume markets.
Is the Bullish Abandoned Baby Candlestick Pattern a Reversal or Continuation Signal?
It’s a reversal signal. The structure shows a shift from strong selling to strong buying. Traders use it to catch potential bottoms or early trend reversals.