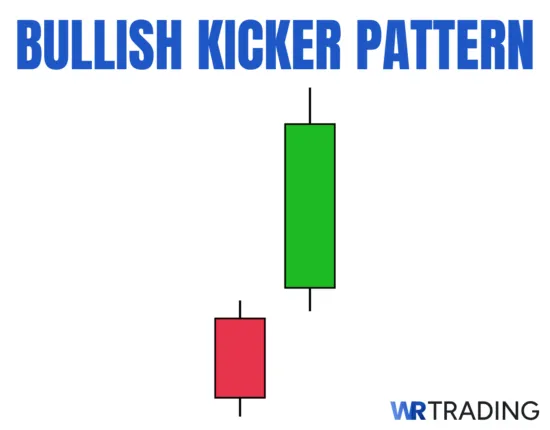
The Bullish Kicker is a two-candle reversal pattern that signals a sudden and aggressive shift from selling to buying pressure. It forms when a strong red candle is immediately followed by a green candle that opens at or above the previous open and continues rising with no overlap between the candle bodies.
The shift is sharp, clean, and clear with no hesitation or back-and-forth movement. It often appears after sharp declines, unexpected news, or periods of emotional selling, and shows the start of a strong bullish reversal.
Traders view it as a pattern of commitment, where the market opens with a complete change in sentiment and doesn’t look back. The stronger the green candle and the cleaner the separation between the two, the more reliable the pattern becomes.
Pros Of The Bulish Kicker:
- The pattern signals a sharp and confident shift in direction without hesitation
- Its clean structure makes it easy to recognize and act on quickly
- Performs best after emotional selloffs or sharp drops, where the market snaps back with conviction
Our guide will explain everything you need to know about trading the Bullish Kicker, its advantages, and limitations.
Key Facts of the Bullish Kicker
- Type of Pattern: Two-candle bullish reversal pattern.
- Construction:
- First Candle: A strong red candle closing near its low, showing aggressive selling pressure.
- Second Candle: A green candle that opens above the red candle’s open and moves higher with no overlap between bodies.
- Forecast: Signals a sharp and immediate shift in sentiment from bearish pressure to bullish control.
- Trend Prior to Pattern: Forms after a strong downtrend, panic selloff, or extended bearish session where sellers had full control.
- Opposite Pattern: Bearish Kicker.
- Stop-Loss Placement: Commonly placed just below the low of the green candle to define risk and invalidate the reversal if broken.
- Candlestick Success Rate: Historically, it performs with a success rate of around 53%.
(Learn To Trade And Read Candlestick Patterns Like A Pro)
How Does a Bullish Kicker Candlestick Pattern Form?
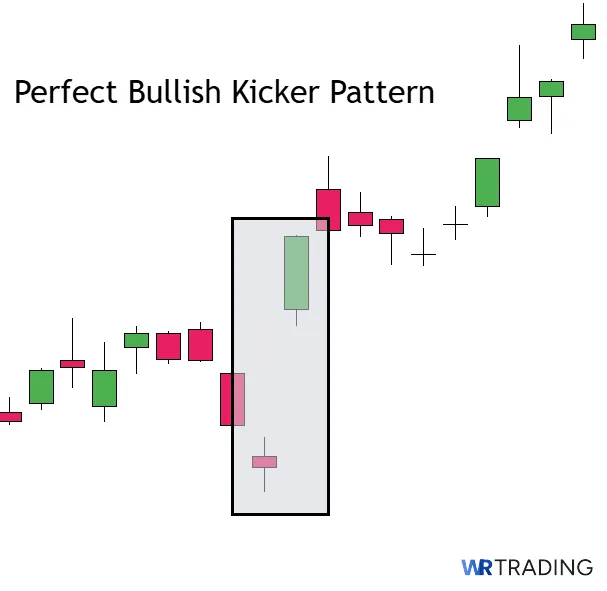
The Bullish Kicker always forms using only two candles, with the second one confirming the shift by opening with a strong green candle and continuing higher without trading back into the red body. It forms when the market turns sharply from strong selling to sudden buying in a single move.
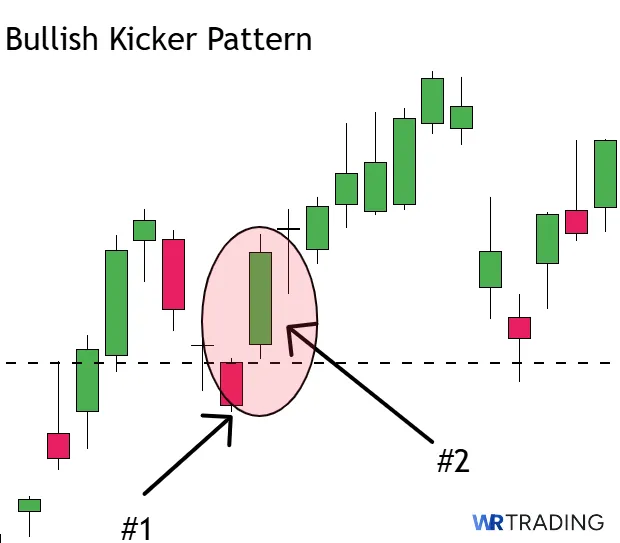
It begins with a clear red candle that closes near its low, often following a steep drop or wave of selling. The next session opens far above the previous open and moves in the opposite direction with strength, leaving a clear gap between the two candle bodies.
There is no slow transition or hesitation between sessions. The momentum shift is immediate and complete, often triggered by a sentiment reversal, unexpected news, or a technical rejection of support. On higher timeframes, this formation stands out clearly and usually leads to strong follow-through.
What Does the Bullish Kicker Candlestick Pattern Mean?
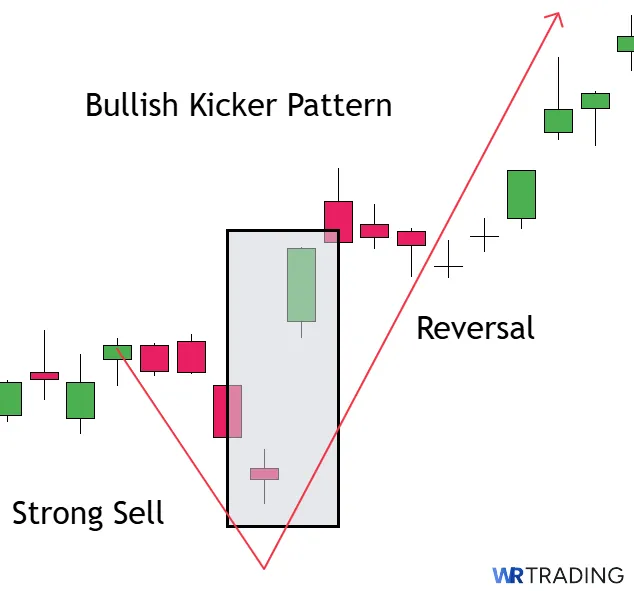
The Bullish Kicker signals an immediate rejection of bearish control and a complete shift in sentiment. After a period of aggressive selling, the market opens far higher than expected and drives upward without testing the previous range. This shows that buyers have stepped in with full conviction and that sellers are no longer in control of the price action.
From a psychological view, the gap between the red and green candles is what gives this pattern its strength. It reflects a total change in positioning, often driven by short covering, aggressive buying, or a sudden change in outlook. The absence of overlap shows that buyers are not easing in, instead, they are entering decisively and forcing a new direction. When the Bullish Kicker forms near support or after panic selling, it often leads to sharp and sustained rallies.
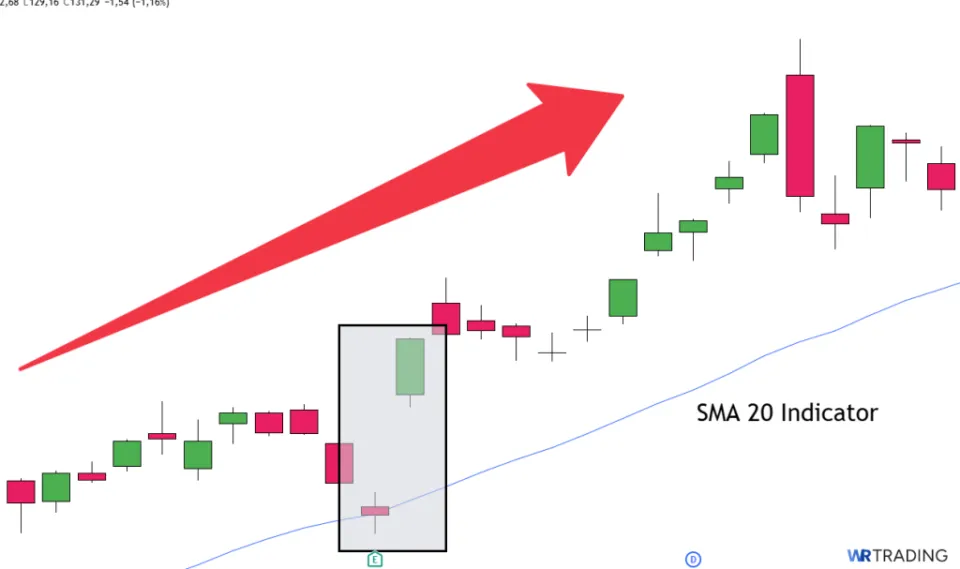
Example of the Bullish Kicker Pattern in the Chart
In the following section you can see an example of this candlestick pattern.
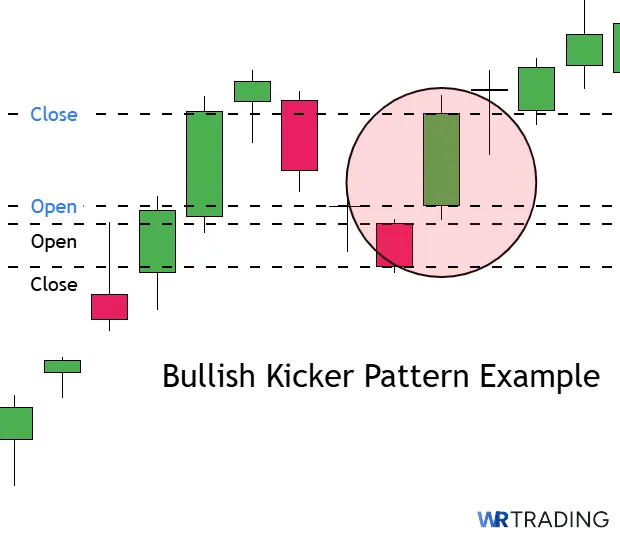
A stock falls from 16.88 USD to 16.52 USD on one day. The following day, the share price opens above the previous day’s opening price of 16.88 USD and continues to rise until the end of the day, closing near the daily high of 17.79 USD
How to Identify a Bullish Kicker Candle in the Chart?
To identify a Bullish Kicker, begin by looking for a strong red candle that indicates clear selling pressure and closes near its low. This first candle usually continues an existing downtrend or sharp move lower, creating a sense of control from sellers. The next candle must open above the red candle’s open and move higher without overlapping the previous body.
The separation between the candles is what defines the pattern. There should be no blending between the two sessions, only a clear break followed by strong upward movement. The green candle must show commitment and close with momentum.
This pattern is easiest to spot on daily charts, but it can also form clearly on the 4h timeframes when volatility is high. The cleaner the gap and the stronger the close, the more reliable the Bullish Kicker becomes.
(Learn To Trade And Read Candlestick Patterns Like A Pro)
How to Trade the Bullish Kicker Candlestick Pattern
The Bullish Kicker is one of the few patterns that does not build up slowly. It appears suddenly, flips the market without hesitation, and forces an immediate shift in positioning. Because of that, it requires a clean process for finding the right conditions, confirming the move, and executing the trade with discipline. Each step matters, and mistiming the entry or ignoring the structure can turn a strong setup into a false start.
Our quick guide will teach you the basics of how to:
- Find the Right Bullish Kicker Candlestick Pattern Setup
- Wait for the Appearance of the Bullish Kicker Candle
- Open Your Trade – Entry Point
- Choose Your Trading Take Profit
1. Find the Right Bullish Kicker Candlestick Pattern Setup
The Bullish Kicker is not common, and even when it appears, it must form in the right place to matter. A valid setup should follow clear selling pressure, not just random movement. The pattern becomes more reliable when the red candle extends a clean move lower and price is testing a known level.
Look for these conditions:
- A clean downtrend or series of strong red candles
- A sharp drop into a technical support or demand zone
- A failed breakdown where the price suddenly reverses upward
- Signs of emotional selling or panic from the prior session
The green candle must open with strength and never return into the red body. A small gap is acceptable, but the main requirement is full separation with no overlap. If the pattern forms inside a range or near resistance, it loses meaning. Strong setups have clear structure, clear momentum, and appear after sellers have already pushed the market to an extreme.
2. Wait for the Appearance of the Bullish Kicker Candle
Do not enter the trade early in anticipation of the pattern, as false signals can lead to losing trades. The Bullish Kicker only becomes valid after both candles are complete. The red candle must close weak, and the green candle must open higher, hold its strength, and close firmly in the opposite direction. Anything less than that is not the pattern.

The best versions show a clean green body with a strong close and minimal lower wick. Volume should increase or show signs of renewed demand. RSI turning from oversold or a clear bounce off support adds confidence to the pattern. Let the structure confirm the reversal before taking a position.
3. Open Your Trade – Entry Point
Once the pattern completes, the entry comes at the close of the green candle or on a break above its high. The close confirms the shift, and entering at that point means you are following momentum, not trying to predict it. This keeps you aligned with the market and avoids early entries that can fail if the second candle is incomplete or weak.
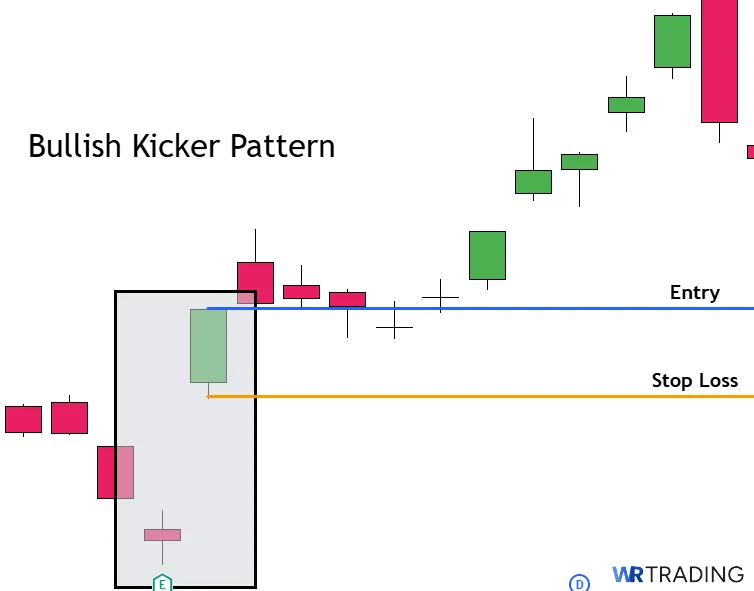
Place the stop-loss below the low of the green candle, which marks the point where the pattern becomes invalid. This level protects the trade if buyers lose control and the price returns to the prior sell-off range.
However, if you are looking for added confirmation, wait for the next candle to break above the green high before entering. That shows buyers are continuing the move without hesitation. Just be careful not to chase if the green candle is large and has already pushed far above the base. Always evaluate how far the price has moved and where nearby resistance could interfere.
4. Choose Your Trading Take Profit
Exit planning depends on the setup and the context around it. If the Bullish Kicker forms at a major low or near strong support, the move may continue for several sessions. You can use the size of the green candle and project it upward from the close as a simple price target. Another option is to mark the nearest resistance zone or prior swing high as a logical exit.
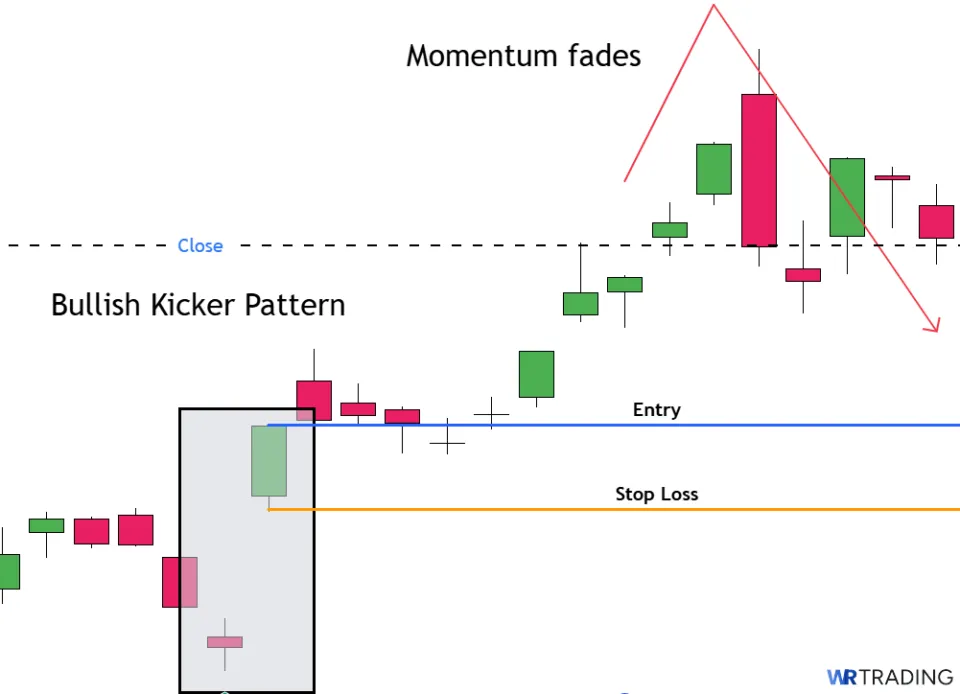
Scaling out at key levels and using a trailing stop gives you more flexibility. Move the stop just below the most recent higher low to protect gains without exiting too soon. If the rally is strong, the stop will hold. If momentum fades, you are already positioned to secure profit without guessing when to exit.
(Learn To Trade And Read Candlestick Patterns Like A Pro)
What Is The Success Rate Of The Bullish Kicker Candlestick Pattern?
The Bullish Kicker is one of the highest-conviction candlestick reversal patterns and has shown a strong historical success rate when it appears under the right conditions. Backtesting data from Thomas Bulkowski’s Encyclopedia of Candlestick Charts places its performance near the top of all reversal patterns, with a measured success rate ranging between 60% and 70% depending on the asset class and timeframe.
These results are based on patterns that formed after clear downtrends, with strong green candles and no overlap between sessions. That success rate increases when the pattern appears at key technical levels, such as horizontal support, psychological round numbers, or after heavy volume. It performs well in stocks and indices, where gaps between sessions are more common and easily visible.
What Are the Pros and Cons of Trading the Bullish Kicker Candle Pattern?
The Bullish Kicker works well when it forms cleanly, but it’s not always a reliable signal. Here’s what it does well and where it tends to fall short.
Pros
- It shows a full reversal with no delay
- It’s easy to spot on a chart
- Often forms after emotional moves have gone too far
- The momentum behind the move can carry forward strongly
- It works best when paired with clear support levels
Cons
- A weak structure ruins the entire setup
- Patterns that appear mid-range offer little value
- Clean separation is harder to find in nonstop markets
- The pattern becomes unreliable when there is no clear selling pressure before it
- Resistance directly above the pattern can shut it down
What Are The Advantages Of The Bullish Kicker Pattern?
The Bullish Kicker is a sharp two-candle reversal that does not rely on anticipation or subtle signs. When it appears with clean structure and proper context, it offers one of the most direct ways to catch a sudden shift in direction. These advantages explain why experienced traders treat it as a reliable entry signal when the market snaps back from a strong decline.
- It shows a full reversal with no delay: The pattern flips direction instantly after strong selling, giving no chance for sellers to regain control. There is no slow buildup or indecision before the move. That type of shift is clear and leaves little room for confusion on what the Bullish Kicker means.
- It’s easy to spot on a chart: Only two candles are needed, and the separation between them makes the pattern stand out immediately. There is no need for indicators or multi-step setups to confirm what price is showing. It allows for fast, confident decision-making.
- Often forms after emotional moves have gone too far: The strongest Bullish Kickers appear right after panic selling or news-driven drops. These are moments when price gets stretched and is ready to snap back. The Bullish Kicker tells you when that reversal has already started.
- The momentum behind the move can carry forward strongly: Once the shift happens, the price often continues to rise without hesitation. That follow-through helps traders stay with the move rather than getting shaken out early. It works well in both short-term and swing trade setups.
- It works best when paired with clear support levels: When the Bullish Kicker forms near a recent low or technical support, the signal becomes more reliable. Buyers are already interested in those areas, and this structure confirms their presence. It is a clean combination of context and price action.
What Are The Disadvantages Of The Bullish Kicker Pattern?
The Bullish Kicker is only effective when it forms under the right conditions. Without structure, context, or proper confirmation, the pattern can become unreliable and misleading. These disadvantages explain the risks that come with using the Bullish Kicker.
- A weak structure ruins the entire setup: If the green candle overlaps with the red or opens inside the previous range, the pattern loses all clarity. The shift becomes less convincing, and traders are left reacting to noise rather than a real reversal. Without the correct pattern structure, this setup breaks down quickly.
- Patterns that appear mid-range offer little value: A Bullish Kicker that forms without a strong trend before it is usually meaningless. There is no emotional selling to reverse or pressure to unwind. The setup works best when it follows real downside momentum.
- Clean separation is harder to find in nonstop markets: With instruments like forex or crypto, the price moves without daily opens, which makes this structure rare. That reduces the number of valid setups and often distorts the candles. Traders must filter carefully to avoid forcing trades that do not fit.
- The pattern becomes unreliable when there is no clear selling pressure before it: The strongest Bullish Kickers appear after fast, emotional drops. If there is no real momentum to reverse, the signal has no weight. Without pressure, there is nothing for buyers to reclaim.
- Resistance directly above the pattern can shut it down: Even if the reversal is strong, the price may stall as soon as it approaches a ceiling. If you do not check for nearby barriers, the trade may fail immediately.
Can the Bullish Kicker Pattern Have Failure Signals?
Yes, the Bullish Kicker can fail when the structure forms without real pressure behind it or the context is weak. Just because the candles look clean does not guarantee the reversal will hold. The following signals are common signs that the pattern may break down or reverse shortly after forming.
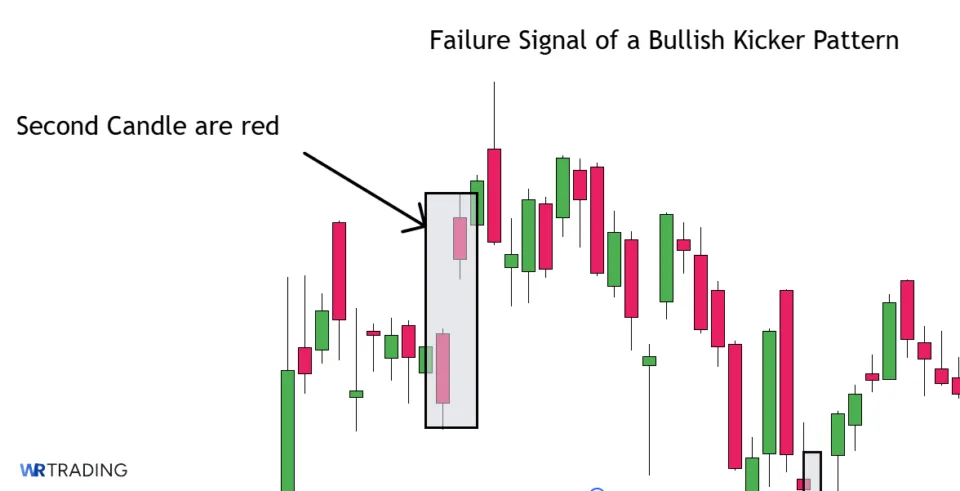
- The green candle closes weak or with a long upper wick: A strong close is one of the most important parts of the setup. If the green candle finishes near the middle of its range or shows rejection from above, it suggests hesitation. Buyers may have stepped in but failed to maintain control.
- The pattern forms in the middle of a wide consolidation range: When the Bullish Kicker appears without a clear trend behind it, the move often stalls quickly. Sideways markets do not provide the pressure that gives this pattern meaning. In those conditions, the setup loses its edge, so avoid trading it.
- There is a key resistance level directly above the second candle: Even a perfect structure will struggle if the price runs straight into previous highs or rejection zones. The pattern might still be valid, but follow-through becomes limited. Strong sellers above the entry can cut the move short.
- Volume drops on the second candle instead of expanding: A clean reversal should bring in real participation. When the green candle forms on weak volume, the move may lack the strength to move prices higher. This often leads to hesitation or a complete failure within the next few sessions.
- The red candle before the pattern is small or indecisive: The best Bullish Kickers follow strong selling pressure. If the first candle is weak or unclear, the second candle does not reverse anything meaningful. Without real momentum to flip, the pattern has no weight behind it.
(Learn To Trade And Read Candlestick Patterns Like A Pro)
Which Indicators Can Be Combined With The Bullish Kicker Pattern?
Combining the Bullish Kicker with the right indicators improves accuracy and leads to higher success rates. These tools help confirm the strength of the reversal, filter out weak signals, and define risk more clearly.
- Relative Strength Index (RSI): The Relative Strength Index measures how fast the price has moved and whether conditions are overbought or oversold. Values below 30 suggest that selling has been stretched and a reversal may be near. A Bullish Kicker appearing as RSI starts rising from those levels confirms that buying strength is returning.
- Volume: Volume shows how many shares, contracts, or units are being traded at a given time. A strong green candle formed on increased volume shows buyers are stepping in. Low volume during the second candle often means the move is not backed by enough participation to last.
- 20-period Moving Average: A moving average smooths out price data to show the direction of the short-term trend. The 20-period version tracks recent momentum and support or resistance levels. If a Bullish Kicker forms and the price pushes back above this line, it often marks the beginning of a shift in direction.
- Stochastic Oscillator: The Stochastic Oscillator tracks how the current price compares to the recent high and low range. When the lines begin rising from below the 20 level, it suggests that momentum is turning from negative to positive. If a Bullish Kicker forms at the same time, the two signals support the idea of a bounce.
- Fibonacci Retracement Levels: Fibonacci levels are calculated from the size of a recent move and are used to find possible support or resistance zones during pullbacks. These levels include 38.2, 50, 61.8, and 78.6 percent retracements. When a Bullish Kicker forms near one of these levels, it shows that buyers are defending the correction.
Alternatives to the Bullish Kicker Pattern:
| Pattern | Structure | Best Use Case | Key Characteristic |
|---|---|---|---|
| Bullish Counterattack | Two-candle bullish reversal | Catching sudden reversals after a sharp drop when the price returns to the prior close. | Second candle closes at or near the open of the previous red candle. |
| Takuri Line | Single-candle bullish reversal | Finding rejection from extreme lows after a deep intraday flush. | Very long lower wick and a small body near the high. |
| Bullish Belt Hold | Single-candle bullish reversal | Entering early after a gap down is fully rejected with strong upside momentum. | Opens at the low and closes near the high with a wide range. |
| Meeting Lines | Two-candle bullish reversal | Confirming momentum shifts when the price snaps back with matching closes. | Green candle closes at the same level as the previous red close. |
| Tri-Star Bottom | Three-candle bullish reversal | Identifying exhausted selloffs that lose momentum before reversing. | Three doji candles with the final one closing higher. |
Learn more about different bullish kicker pattern alternatives in our free candle charts pattern PDF.
What Is The Difference Between The Bullish Kicker And The Bearish Kicker Pattern?
The Bullish Kicker and Bearish Kicker are mirror patterns in structure, but their meanings and market context are completely opposite. Both show a total rejection of the previous session, driven by an aggressive gap and continuation, but the side in control changes.
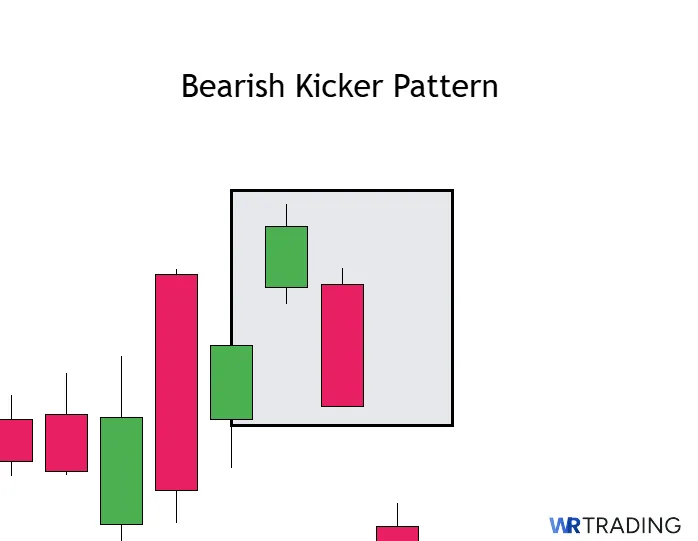
The Bullish version flips direction upward as buyers force the price away from selling pressure, while the Bearish version turns the trend downward when sellers wipe out buyer momentum in a single session.
Each pattern forms after strong movement, but what follows is what defines them. The Bullish Kicker comes after fear and breakdowns, while the Bearish Kicker emerges after greed and sharp rallies. One marks the start of recovery, the other warns of a collapse.
| Section | Bullish Kicker | Bearish Kicker |
|---|---|---|
| Construction | First Candle: Strong red candle closing near the low.Second Candle: Green candle opens far above the red open and closes higher with complete separation. | First Candle: Strong green candle closing near the high.Second Candle: Red candle opens far below the green open and closes lower with complete separation. |
| Forecast | Signals a sudden and aggressive shift in control from sellers to buyers. | Signals a sharp rejection of buying pressure and a complete shift to sellers. |
| Type of Pattern | Two-candle bullish reversal pattern. | Two-candle bearish reversal pattern. |
| Trend Prior to Pattern | Forms after a fast decline, selloff, or panic-driven move. | Forms after a strong rally, breakout exhaustion, or emotional buying. |
| Opposite Pattern | Bearish Kicker. | Bullish Kicker. |
What Is The Difference Between The Bullish Kicker And Bullish Engulfing Pattern?
The Bullish Kicker and Bullish Engulfing patterns are strong reversal setups but form under very different conditions. A Bullish Engulfing develops within the same price range as the previous candle, while the Bullish Kicker breaks completely away with a gap in between.
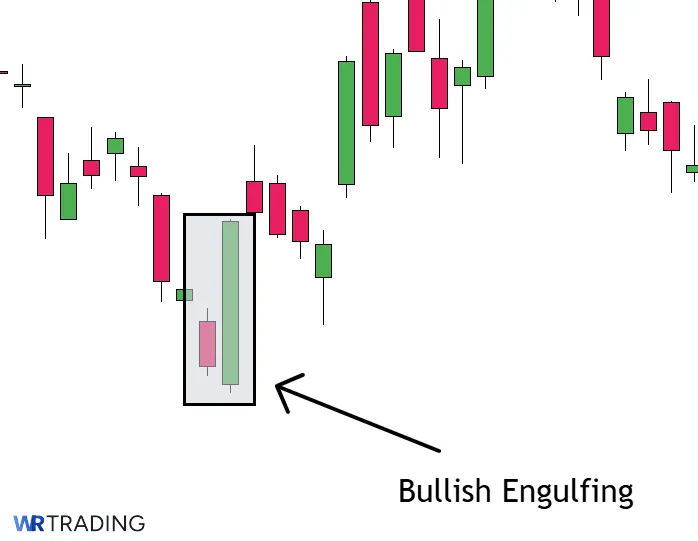
The Kicker is more aggressive and appears suddenly, often in response to emotional or news-driven moves, whereas the Engulfing pattern reflects a more gradual shift that unfolds inside the existing structure.
In a Bullish Engulfing, the green candle opens below the red close and closes above the red open, fully covering its body. However, the Bullish Kicker skips the overlap entirely. The green candle opens above the red candle’s open and never trades within the previous body, making the reversal more immediate. Both can be effective, but the Kicker shows a stronger rejection of the prior trend in less time.
| Section | Bullish Kicker | Bullish Engulfing |
|---|---|---|
| Construction | First Candle: Strong red candle closing near the low.Second Candle: Green candle opens well above the red candle’s open and drives higher with no contact between the candle bodies. | First Candle: Strong red candle.Second Candle: Green candle opens below the red close and closes above the red open, completely covering the body. |
| Forecast | Signals a sharp reversal as buyers completely reject the previous session’s selling pressure. | Signals a controlled reversal where buyers gradually take over the session. |
| Type of Pattern | Two-candle bullish reversal pattern. | Two-candle bullish reversal pattern. |
| Trend Prior to Pattern | Forms after a sharp drop or emotional decline. | Forms after a pullback, retracement, or downtrend. |
| Opposite Pattern | Bearish Kicker. | Bearish Engulfing. |
What Is The Difference Between The Bullish Kicker And Bullish Harami Pattern?
The Bullish Harami is a slower, less aggressive pattern that signals hesitation rather than a full reversal. It forms when a small green candle appears entirely inside the range of a larger red one, showing that sellers are starting to lose momentum. Instead of breaking away from the trend, price holds within the prior range, which reflects uncertainty. The pattern is often part of a base, and by itself, it rarely causes a strong directional move without follow-through.
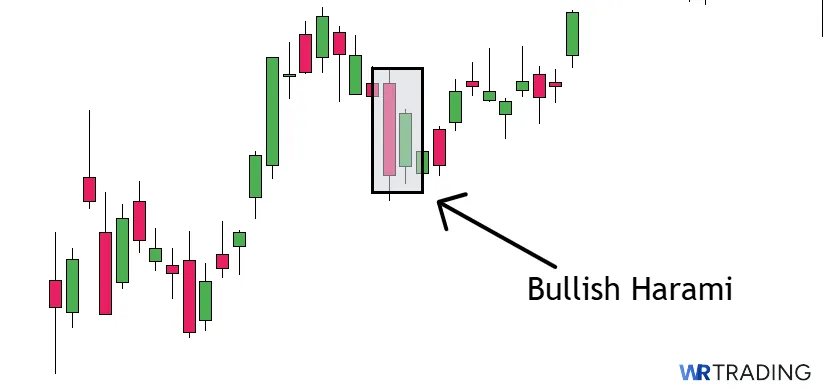
The Bullish Kicker shows none of that caution. It opens well above the previous session and breaks cleanly in the opposite direction. There is no overlap, no hesitation, and no need for additional confirmation. The difference is clear for both candles; the Bullish Harami suggests a pause, the Kicker signals a break.
| Section | Bullish Kicker | Bullish Harami |
|---|---|---|
| Construction | First Candle: Strong red candle closing near the low.Second Candle: Green candle opens far above the red open and closes higher with full separation. | First Candle: Large red candle during a continued decline.Second Candle: Small green candle entirely within the previous body. |
| Forecast | Signals a sharp and decisive reversal away from selling pressure. | Suggests a pause in bearish momentum that could lead to a base or reversal. |
| Type of Pattern | Two-candle bullish reversal pattern. | Two-candle bullish reversal pattern. |
| Trend Prior to Pattern | Forms after a sharp drop, flush, or emotional selloff. | Forms after a steady decline or structured pullback. |
| Opposite Pattern | Bearish Kicker. | Bearish Harami. |
What Are The Limitations Of The Bullish Kicker?
Here are some quick limitations of this pattern that are worth keeping in mind. While the Bullish Kicker looks powerful when it forms cleanly, that structure alone doesn’t guarantee follow-through. A weak setup or the wrong market conditions can turn it into a trap instead of a reversal.
- Needs a strong downtrend before it forms or the signal is weak.
- Gaps are uncommon in some markets, making the setup harder to find.
- Can fail instantly if the price hits resistance shortly after entry.
- Doesn’t work well when volume is low or missing entirely.
- False signals are common during thin or overnight sessions.
Learn Pattern Trading With the WR Trading Mentoring
The Bullish Kicker pattern works when the structure is clean and the setup has proper confirmation, but that only gets you so far. To trade patterns consistently, you need to know how to use them with timing, structure, and clear decision-making.
That’s what the WR Trading Mentoring program teaches. You’ll learn how to take setups like the Bullish Kicker and combine them with context, support zones, and confirmation tools that filter weak entries. Every lesson focuses on real examples, clear strategy, and helping traders build confidence with structure that makes sense.
(Learn To Trade And Read Candlestick Patterns Like A Pro)
Conclusion: The Bullish Kicker Pattern Signals a Sharp Change in Market Control
To summarize, the Bullish Kicker is a powerful two-candle bullish reversal that shows bullish strength stepping in decisively after strong selling. We broke down how the pattern works, where it forms, and what it means when it appears with pressure behind it. We went through how to trade it step by step, how to spot common failures, and which tools make it more effective in real setups.
Used with structure, trend, and timing, it can give early confirmation of a shift that has already started building. We’ve covered everything you need to know about the Bullish Kicker pattern and how to use it in live market conditions. For more in-depth knowledge, visit WR Trading.
FAQs: Most Frequently Asked Questions on Bullish Kicker Pattern
What Does a Bullish Kicker Pattern Indicate?
It shows that buyers have stepped in with full control after aggressive selling. The Bullish Kicker forms when the price opens well above the prior session and never looks back. That kind of shift rarely happens unless sentiment has flipped completely.
How Many Candles Make Up the Bullish Kicker?
The Bullish Kicker is a two-candle pattern with clear separation. The first candle shows heavy selling, and the second completely rejects that move. It only counts if the second opens above the first without overlap.
Which Timeframes Are Best for Trading the Bullish Kicker?
You’ll get cleaner signals on the 4-hour and daily charts. Lower timeframes show too much noise and often miss the separation. The pattern still forms on shorter charts, but the quality drops.
Can the Bullish Kicker Fail in a Downtrend?
Yes, when there’s no support nearby or the trend is still strong. A single pattern can’t reverse a deep move on its own. It needs to align with structure and momentum.
Is Volume Important When This Pattern Appears?
Yes, volume helps confirm that the move has backing behind it. A strong shift with no volume can still work, but the follow-through is often weaker. When the Bullish Kicker shows up with volume, you know buyers are serious.