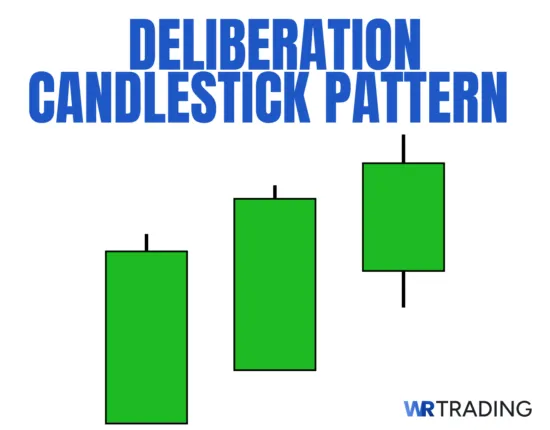
The Deliberation or bearish stalled candlestick pattern is a reversal formation that consists of three bullish candles (with the third being smaller). Its meaning lies in signaling a possible slowdown in bullish momentum before a potential new bearish move.
While not as common as other patterns, we believe it’s a valuable example of candlestick psychology and can signify exhaustion when paired with other technical indicators. Traders who develop a clear strategy around this setup should find it useful for anticipating turning points in forex and other markets.
Several accurate methods exist for interpreting and trading it effectively, all of which will be explained in this guide.
Key Facts about how the Deliberation Candlestick Pattern is formed:
- Construction:
- First and second candle: Long-bodied bullish candles
- Third Candle: Small-bodied bullish candle
- Type Of Pattern: Reversal and continuation
- Trend Prior To The Pattern: Bullish
- Opposite Pattern: Bullish stalled
- Entry Options: after confirmation candle; after the third candle on a pullback; with an indicator
- Stop-Loss Options: above the third candle’s high; ATR-based stop; structural stop
- Psychology: bullish confidence turning to hesitation
(Learn To Trade And Read Candlestick Patterns Like A Pro)
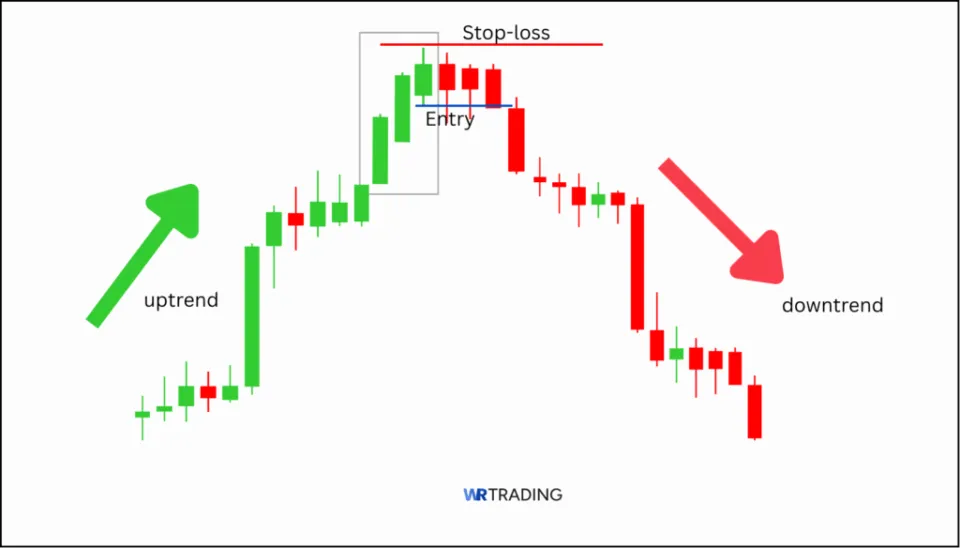
How Is The Bearish Deliberation Pattern Formed?
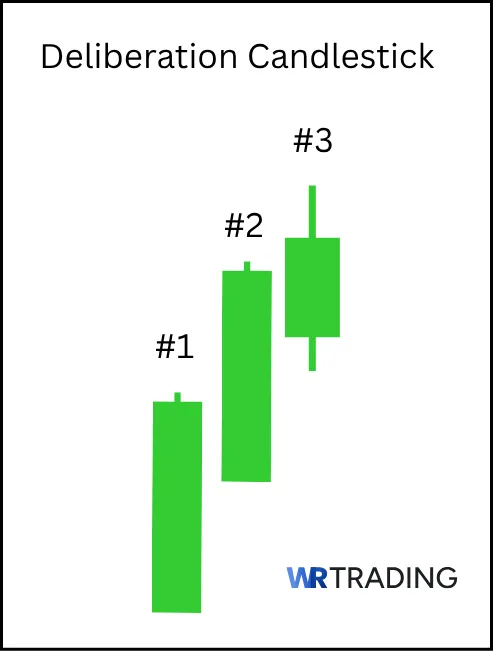
The deliberation pattern forms after an undefined time at the end of a bullish trend or a downtrend retracement. It consists of three consecutive bullish candles, each progressively signaling fatigue in buying pressure:
- First candle: this is a large bullish candle that reflects sustained buying momentum and continued optimism.
- Second candle: this is also another large bullish candle, which usually opens lower than the first but must close above it. By this stage, the momentum remains upward.
- Third candle: this candle is the most telling. Despite being bullish, it is noticeably smaller than the previous two, despite closing higher than both. It represents deliberation (or sometimes indecision, especially with a spinning top) among buyers, showing little interest in pushing to new highs.
What Does The Bearish Deliberation Candlestick Pattern Mean?
We can summarise the psychological interpretation of this pattern in three phases: strong bullish confidence, which turns to slowing momentum and then, finally, hesitation.
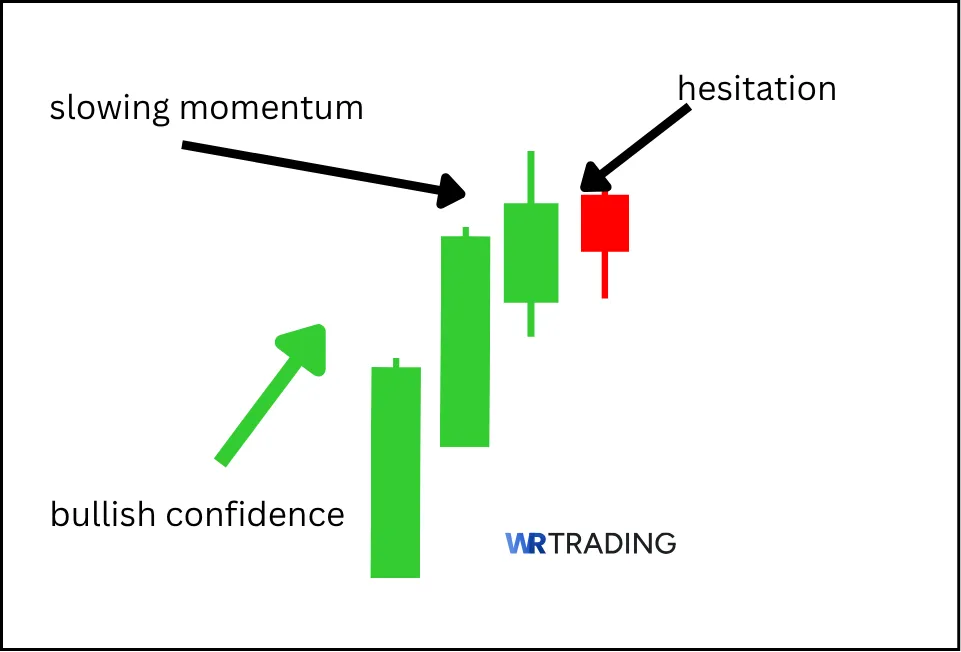
This psychology suggests a warning sign that buyers are less committed than before. It alerts traders to the possibility of a potential bearish reversal within the next candle. Buyers should consider exiting or tightening stops, while sellers should prepare for short entries after the confirmation candle.
Where Does The Name of the Deliberation (Stalled) Pattern Come From?
The name comes from the concept that buyers are ‘deliberating’ or ‘stalling’ after a strong rally before the reversal happens.
(Learn To Trade And Read Candlestick Patterns Like A Pro)
What Is An Example Of The Bearish Deliberation Pattern?
Let’s examine two examples of this pattern: one a reversal and the other a continuation setup.
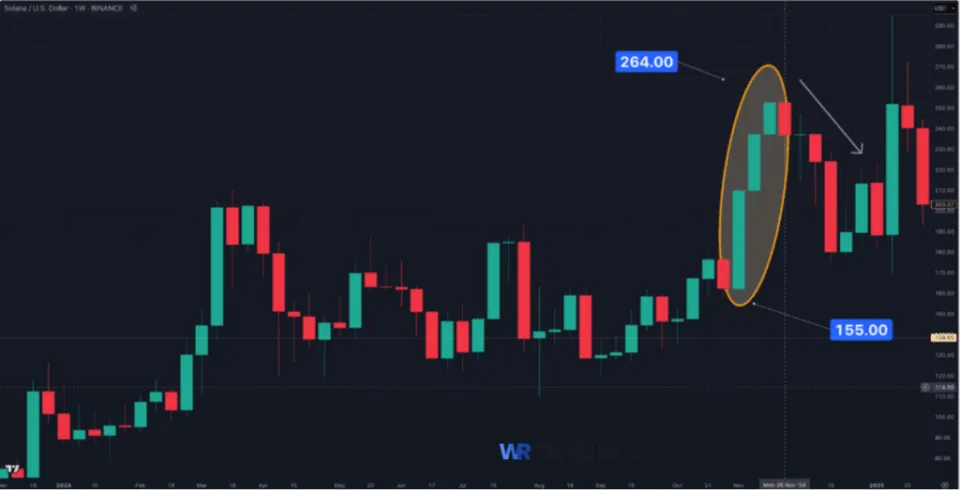
The first is on the weekly chart of Solana. We see three progressive green candles between prices $155 and $264, with the last being much smaller than the previous two. Then, a small reversal occurred after this setup.
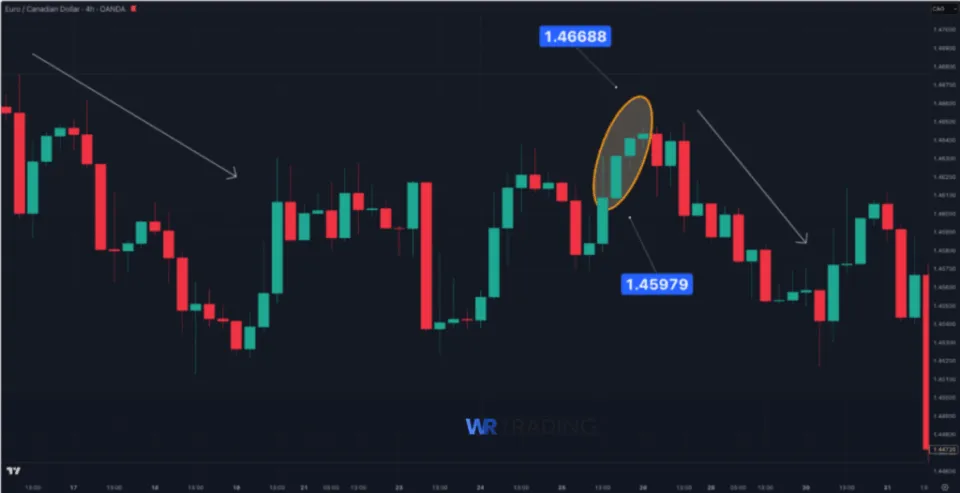
Our final example is on the 4HR chart of EURCAD, this time a downtrend continuation setup. The deliberation pattern formed between prices 1.45979 and 1.46688.
How To Identify The Deliberation (Stalled) Pattern
Identifying the deliberation starts with scanning for a rising market, either an uptrend or a retracement of a downtrend.
Then, look for the pattern at one of these locations or events (or in combination):
- Key support/resistance levels: these are natural swing highs/lows which include horizontal levels, supply zones, Fibonacci retracements, trendlines, channel boundaries, and moving averages
- Overbought technical indicator levels: these suggest momentum is overextended and the market is likely due for a correction, a perfect scenario for the deliberation pattern. Examples include the Relative Strength Index (RSI), Bollinger Bands, and stochastics.
- Volume confirmation: this helps traders visualise the level of interest. The pattern should have decreasing bullish volume after each candle and a bearish spike after the confirmation candle.
- Near the end of a high-impact news event: The deliberation setup can form in high-volatility sessions where we see an emotion-driven spike in buying volume beforehand. However, more caution is necessary to enter after this time.
Next, ensure that you see the three-candle structure which meets the perfect criteria: two bullish candles of similar size with one closing higher than the previous, and then a smaller bullish candle closing higher. Later on, we will go over complementary indicators that can assist you during this identification stage.
How To Trade The Deliberation Candlestick Pattern
Here is a summary of trading this setup before exploring each step in more detail:
- Find the right setup
- Wait for the appearance of the pattern
- Open your trade
- Choose the trading take-profit
(Learn To Trade And Read Candlestick Patterns Like A Pro)
1. Find the Right Setup For The Deliberation Pattern
Here is how you identify the right, meaningful environment for the deliberation pattern (as established earlier):
- Find a strong uptrend or a retracement of a strong downtrend. Either of these should ideally be overextended or close to, which you can check with a technical indicator.
- The pattern should appear at a key resistance zone.
- Traders should avoid trading the pattern before a high-impact economic event.
2. Wait For The Appearance Of The Deliberation Pattern

Having identified a favourable context and after seeing the pattern, be patient for a bearish confirmation candle to form. This validates the potential reversal or pullback. It is only once this candle has closed that a trader can consider entering.
3. Open Your Trade – Entry Point
Aside from the confirmation entry (the most balanced method), traders can choose a few other methods of entering the pattern based on their risk appetite, skill, and goals:
- Retracement entry: entry on a pullback (e.g., using a 50% Fibonacci retracement) of the deliberation pattern. This offers the most favourable entry point at the risk of potentially missing the trade.
- Indicator-assisted entry: using a momentum indicator. Examples include the RSI crossing below 70, a MACD bearish crossover, or a stochastic turning down. This approach is quite conservative but may offer a more delayed entry due to the lagging nature of indicators.
- Aggressive entry: enter immediately after the third candle of the pattern closes, providing the most optimal entry but the highest risk of a false signal.
Afterwards, you should also consider where to place your stop loss. Here are a few options:
- Above the high of the third candle: this is the default method. While it offers the tightest stop, it may be too tight in volatile markets.
- ATR-based stop: you can use the Average True Range indicator to set a stop loss based on the time frame in which the deliberation appears. While traders receive a volatility-based stop, it is usually wider, reducing the profit potential.
- Structural stop: here, a trader places a stop loss just above a resistance level or recent swing high near the pattern. Despite the wider stop, it offers a strong technical foundation.
4. Choose Your Trading Take Profit
Once you’ve completed your entry and the trade appears promising, it’s time to consider how to take profits. As always, there are various ways depending on one’s trading style and the conditions that would occur during the position.

- Targeting key support zones: these are logical areas to exit as the market naturally bounces off them. Watch for horizontal support lines, demand zones prior swing lows, or pivot points.
- Fibonacci retracements: these are another type of resistance that offers several precise target options instead of a fixed level. Rather than choosing a key support area (which isn’t always nearby), you can opt for 78.6%, 61.8% or 50% of the move. These levels are typically the ones many traders watch for.
Trailing stop loss: Trailing your stop allows you to capture a much larger move (compared to other methods) while protecting some gains. Here are a few ways to do it:
- A set number of pips behind the price
- A short-term moving average, e.g., 20 EMA
- Most recent swing highs
- Fibonacci levels
Scaling out: Some advanced traders may set multiple take-profit targets (i.e., scaling out) to reduce emotional pressure and adapt to market conditions. They could use some of the previously discussed techniques. For example:
- 50% at first support or 1:1
- 25% at 1:2 or 38.2% Fib
- 25% at 1:3 or trailing stop
Break of trendline or channel: Here, you can draw a trendline or channel while the trade is moving your way and exit when the market breaks either of the two with a bullish candle. This approach uses an effective visual structure to define target zones.
Finally, traders must ensure their position has the potential to offer a minimum 1:3 risk-to-reward ratio.
(Learn To Trade And Read Candlestick Patterns Like A Pro)
Chart examples
Let’s examine two chart demonstrations, beginning with a continuation setup on the daily EURUSD chart.
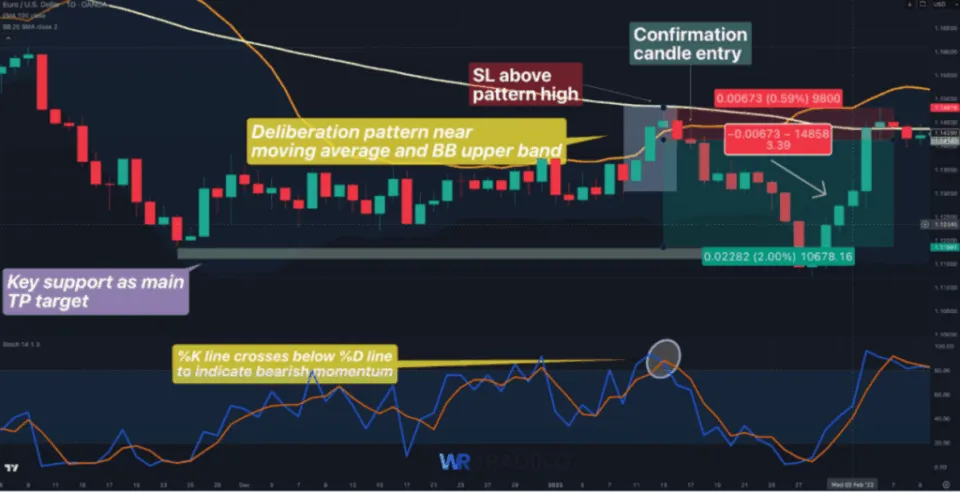
Here are the key elements that made this trade successful:
- The third candle of the deliberation pattern formed on the 100-period moving average
- The pattern also occurred at the upper Bollinger Band, suggesting overextended price action.
- The %D or negative stochastics line crossed below the %K or positive stochastics line, another sign of bearish momentum
You would have entered with a confirmation candle entry at the close of the bearish bar (1.14154) with a stop loss at the pattern’s high (1.14827). This position also exemplifies the power of support and resistance for profit targets.
We see the market moved to a key resistance zone, which is a good level to potentially exit. Ultimately, exiting at 1.11861 (the lowest point of the resistance) would have netted a 3.39x trade.
Our last example is a reversal setup on the daily chart of XAU/USD or gold.
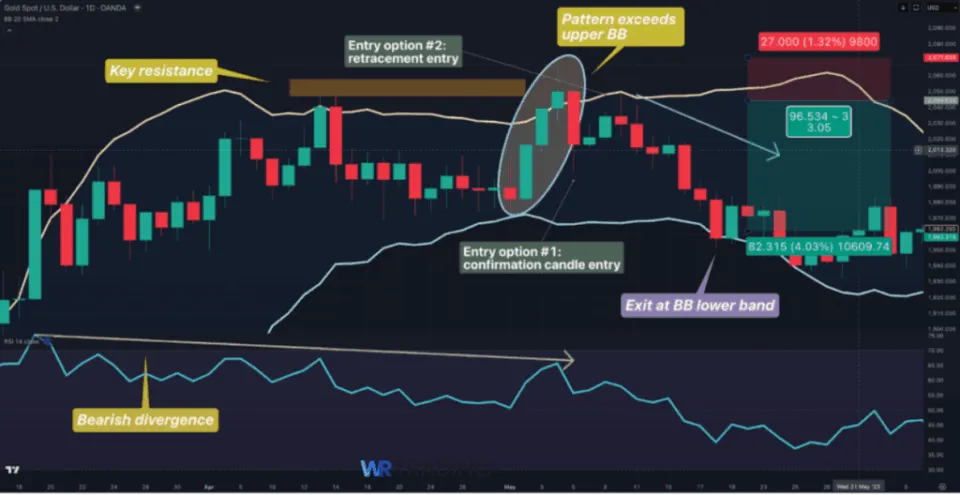
Here are the main confirmation factors of this position:
- The deliberation pattern occurred near a key resistance
- This also aligned with the upper Bollinger Band.
- There was bearish momentum on the RSI
One could have used the retracement entry as an alternative this time (though entering after the confirmation candle was another option). The latter choice would have seen you enter at $2040 (50% between the pattern’s high and confirmation candle) with a stop loss above the deliberation at $2067.
The Bollinger Bands are also another option for taking profits when the price exceeds the opposite band. In this trade, exiting at this point ($1957) would have yielded a 3x return.
What Is The Success Rate Of The Bearish Deliberation (Stalled) Candlestick Pattern?
We couldn’t find any research on this pattern’s success, possibly because it is a relatively rare setup. However, our backtesting indicated a 55% hit rate under optimal conditions.
As with all patterns, this is influenced by various factors. These include:
- Trend strength before the pattern: The bearish deliberation is generally more reliable when it appears at the end of a strong bullish trend or move. This contrasts with weak trends and choppy price movements.
- Third candle characteristics: Traders should ensure the third candle has a small real body. This signals buyer fatigue or a loss of momentum, which is the essence of the bearish deliberation.
- Volume confirmation: Ideally, volume should steadily decline at each candle (dropping more notably on the last) of the pattern.
- Chart location: Candlestick patterns are less reliable when they appear in random places. Traders enhance their level of success when they observe the deliberation pattern at specific locations, such as key resistance levels and trendlines.
- Time frames: Higher time frames (from H4 and above) are often more dependable, as they reduce the level of ‘noise’ and minimize false signals.
Is The Deliberation Candlestick Pattern Suitable For Beginners?
No, we believe the deliberation pattern isn’t beginner-friendly. It’s a setup with complex nuances (which can easily be misinterpreted) and low frequency, factors that may not suit newer traders.
Still, the pattern isn’t very challenging and can be utilised by traders with only a few years of experience.
(Learn To Trade And Read Candlestick Patterns Like A Pro)
What Are The Pros And Cons Of the Deliberation Pattern?
Pros
- Offers low noise reversal signal
- Shows trend exhaustion
- Compatibility with other confirmation tools
Cons
- Infrequent appearance
- The need for confirmation
- Striking similarity with other patterns
What Are The Advantages Of The DeliberationPattern?
The main benefits of the deliberation pattern include its low-noise nature, ability to show trend exhaustion, and compatibility with other confirmation methods.
- Offers low noise reversal signal: Many reversal patterns, such as long wick candles and engulfing patterns, occur based on a significant volatility or dramatic shift. Meanwhile, the deliberation pattern is more subtle with fairly consistent candle formations. This also means that a trader’s stop loss is generally narrower since there is less volatility to account for.
- Shows trend exhaustion: The purpose of the deliberation is to show exhaustion in an uptrend or bearish retracement. This allows traders to improve how they anticipate reversals.
- Compatibility with other confirmation tools: Most candlestick patterns work (and should) well with other technical tools to improve their success rate – the deliberation setup is no exception.
What Are The Disadvantages Of The Deliberation Pattern?
Equally crucial is noting the limitations of this setup, which include its infrequent appearance, the need for confirmation, and notable similarity to other patterns.
- Infrequent appearance: One reason that barely any studies exist for this pattern is its rare appearance. Thus, traders cannot rely on it for consistent opportunities, nor can they gain enough testing data. However, the setup’s rarity does make it more outstanding compared to the common ones.
- Need for confirmation: Although this is a scarce pattern, it requires a significant confluence or combination of indicators to reduce false signals.
- Striking similarity with other formations: The deliberation pattern can easily be mistaken for the three white soldiers, advanced block, and rising three methods patterns. Hence, it is open to misinterpretation.
Can The Stalled Pattern Have Failure Signals?
Yes, the stalled pattern can fail numerous times for various reasons, such as unfavourable market conditions, improper context, and premature entries. It is possible to attain hit rates below 50%.
Thankfully, there are similar multi-candle setup alternatives that have been widely tested with known success rates. These include the evening star, three black crows, and dark cloud cover.
Which Indicators Can Be Combined With The Deliberation Pattern to Increase Its Success?
The most suitable indicators for this setup should be able to detect changes in momentum, trend strength, and volatility. Here are five options to consider with their ideal settings.
Relative Strength Index (RSI)
The RSI indicates where momentum is stretched and likely to shift, especially when accompanied by divergence. Look for instances when the indicator is above 70 (and dipping below) when the deliberation has formed as this could signal exhausted buyers.
Ideal setting: 14 periods (default)
Moving Average Convergence Divergence (MACD)
The MACD is another momentum indicator, but with trend elements. Watch for a bearish crossover (MACD line crosses below signal line) or divergence anytime during the deliberation’s formation.
Ideal setting: 12, 26, 9 (default)
Volume
Any volume indicator should show where momentum has faded. Traders must note declining volume during the formation (particularly on the third candle), and a spike after the confirmation.
Ideal settings: use standard settings based on the specific volume indicator
Bollinger Bands
Bollinger Bands help traders identify extreme extension zones or increased volatility before a new trend begins. Key scenarios to watch for while trading are seeing the deliberation just outside the upper band, or when the bands widen while it forms.
Ideal setting: 20-periods, 2 standard deviations (default)
Average True Range (ATR)
This volatility indicator can help you beyond entries and exits. Look for moments when there is a spike in the ATR, as it could hint at exhaustion or an overextended move.
Ideal setting: 14 periods (default)
(Learn To Trade And Read Candlestick Patterns Like A Pro)
What Are Simliar Patterns To The Deliberation Pattern?
Here’s a table showcasing other effective candlestick formations similar to the deliberation pattern.
| Pattern | Description |
|---|---|
| Evening star | Three-candle setup with a strong bullish candle, followed by a small-bodied candle, and then a strong bearish candle that closes below the open of the first. |
| Three black crows | Three-candle pattern with three consecutive long bearish candles. |
| Dark cloud cover | Two-bar pattern with a large bullish candle followed by a bearish candle that opens higher but closes below the midpoint of the first candle. |
| Three inside down | Three-candle pattern with a bullish candle, followed by a smaller bearish candle inside it, and then a larger bearish candle confirming the reversal. |
| Bearish harami | Two-bar pattern where a small bearish candle is contained within a prior large bullish candle. |
Find more alternatives by downloading our free Candlestick Patterns PDF.
What Is The Opposite Pattern Of The Deliberation Pattern?
The opposite pattern is the bullish stalled pattern (which can also be referred to as the deliberation setup). Here, we have two consecutive bearish candles, followed by a smaller bearish candle as the last. Like its bearish counterpart, this pattern works in reversals and continuations.
What Is The Difference Between The Deliberation Pattern And The Advanced Block Pattern?
The advanced block pattern is quite similar to the deliberation at first glance, as each contain three progressive bullish candles. They are also both bearish reversal formations that indicate fading bullish momentum and require a confirmation candle.
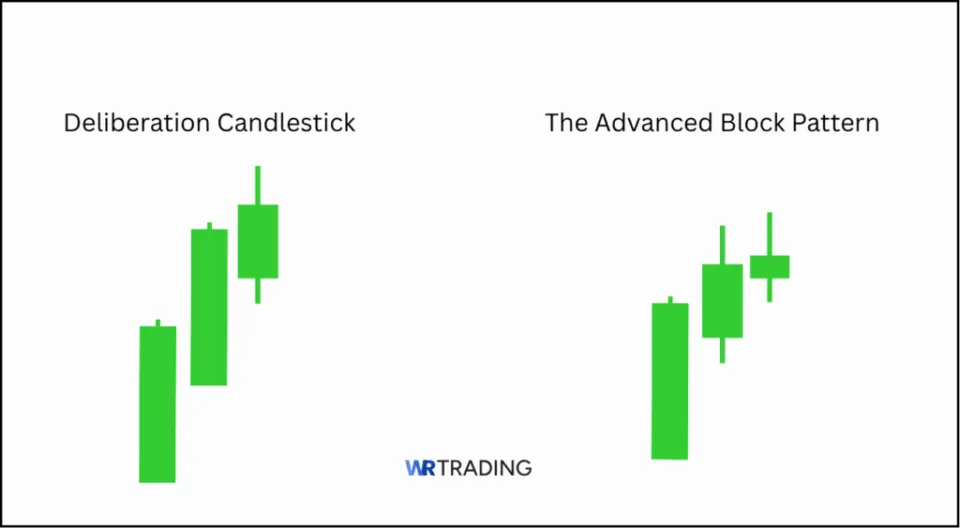
However, the main difference is that with the former, each candle gets progressively smaller in size. Meanwhile, it is only the third candle that is smaller than the previous two with the deliberation.
Learn Pattern Trading With The WR Trading Mentoring
Patterns like the deliberation are effective signals of shifting market psychology in forex and other markets, but interpreting them correctly takes experience. At WR Trading, you’ll go beyond the surface, learning how to analyze context, confirm setups, and manage trades with confidence.
Our mentoring program combines expert guidance with live market applications, helping you develop a disciplined, strategic approach to trading. Whether you’re new to pattern trading or refining your edge, WR Trading ensures you learn to trade patterns purposefully.
(Learn To Trade And Read Candlestick Patterns Like A Pro)
Conclusion: Winning With The Deliberation Pattern
From our experience in technical analysis, mastering the deliberation setup involves understanding the market’s subtle messaging. Its simple structure of three bullish candles (with the third being smaller than the rest) shows us that momentum is fading and sentiment may be shifting.
While this reversal pattern is very rare and nuanced, we’ve seen how powerful it can be when used with the right tools. Our recommendation for increasing your odds of success is simple: don’t trade the deliberation in isolation, utilize confirmation via other indicators, visual confluence, and proper risk management with ideal entries and exits.