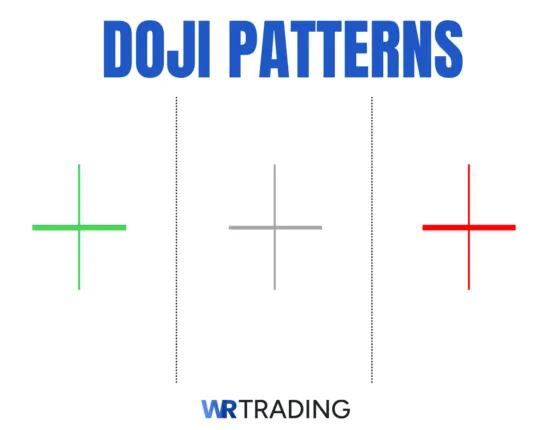
A Doji is a one-candle neutral pattern that reflects uncertainty or indecision about where the price is headed. The pattern consists of a single candlestick that has identical or nearly identical opening and closing prices, resulting in a body that appears extremely thin. Being a neutral pattern, the doji is neither bullish nor bearish on its own. That said, in a strong trend (whether an uptrend or a downtrend), the appearance of the doji can simply indicate a pause before the price continues its rally, or it can also point to a potential weakness in the ongoing trend.
In trading, a doji is often not actionable on its own since it is inherently indecisive, but it can still serve as a hint of a potential reversal if followed by a strong candle pointing in the opposite direction of the trend. Hence, depending on the trend, you can use it to take a long position (if it appears at the bottom of a downtrend and is followed by a strong bullish candle) or to take a short position (if it appears at the top of an uptrend and is followed by a decisive bearish candle).
Key Facts / Pattern Specifications:
- Type of Pattern: Neutral/Indecisive single candlestick pattern
- Pattern Construction:
- Body: Must be extremely small or non-existent
- Wicks/Shadows: It can either be short or long
- Trend Prior to the Pattern: It can appear during an uptrend or a downtrend
- Trend Forecast: It can either be a mere pause or a sign of weakness of the current trend
- Opposite Pattern: “Marubozu,” a long-bodied candlestick pattern with little to no wicks
- Stop Loss Placement:
- Aggressive/Tighter Stop Loss: Depending on the trend, above or below the “confirmation candle” (we will illustrate this later) following the doji
- Conservative/Wider Stop Loss: Depending on the trend, above or below the doji’s upper or lower wick or shadow
(Learn To Trade And Read Candlestick Patterns Like A Pro)
What are the different Types of Doji?
The following are the different types of doji that can appear on any price chart:
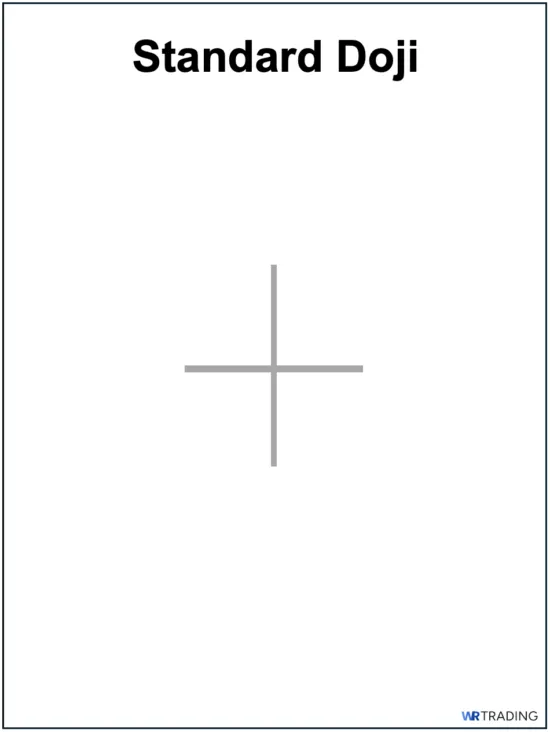
1. Standard Doji
First, the standard doji looks like a cross (or a plus sign in math function). Its upper and lower wicks/shadows are exactly or nearly the same length. Note, however, that the standard doji has relatively short wicks.
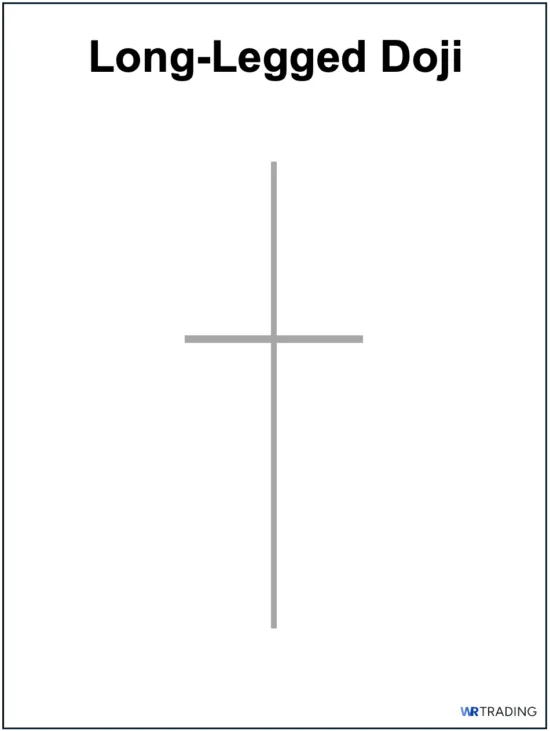
2. Long-Legged Doji
Second, from its name, a long-legged doji has noticeably long wicks on either its upper wick or lower wick or both. This type looks like an asymmetrical cross, as one of its wicks is noticeably longer than the other.
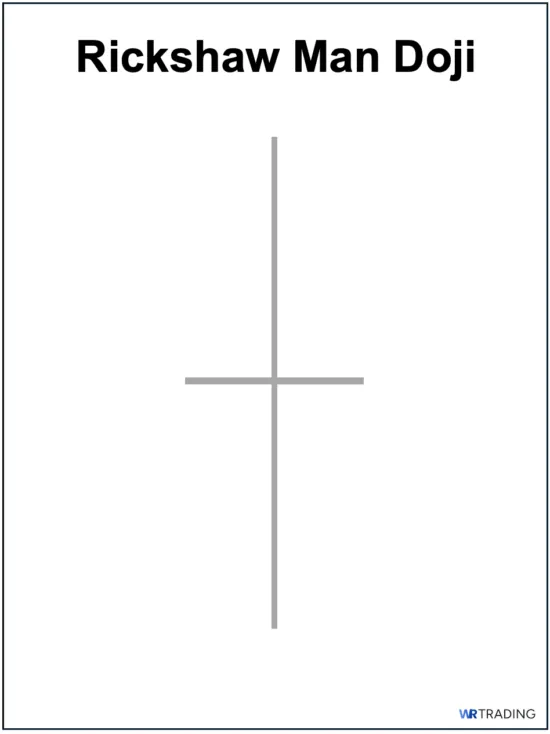
3. Rickshaw Man Doji
Third, the rickshaw man variant is essentially a long-legged doji that has symmetrical upper and lower wicks.
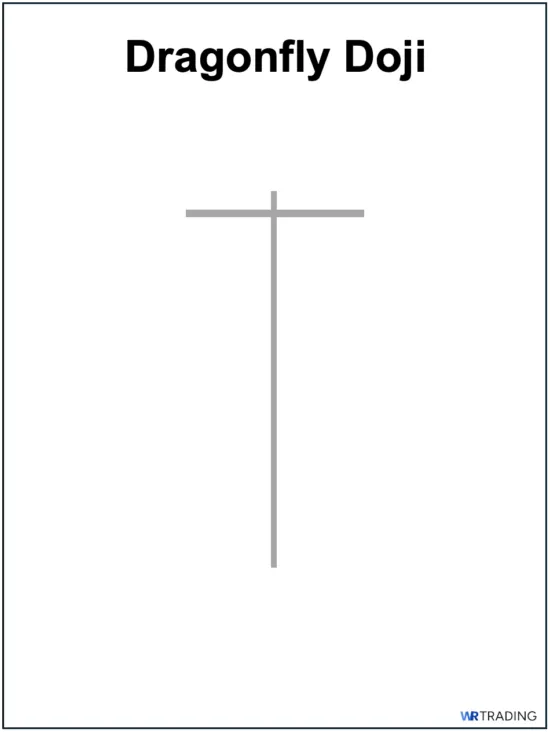
4. Dragonfly Doji
Fourth, the dragonfly doji looks like the capital letter “T.” This type of doji is most useful when it occurs at the bottom of an ongoing downtrend, as it illustrates the rejection of lower prices and, thus, has a bullish directional bias as it may be a precursor to a possible bullish reversal. That said, as a doji, it is not decisive on its own. Hence, a confirmation candle is still needed.
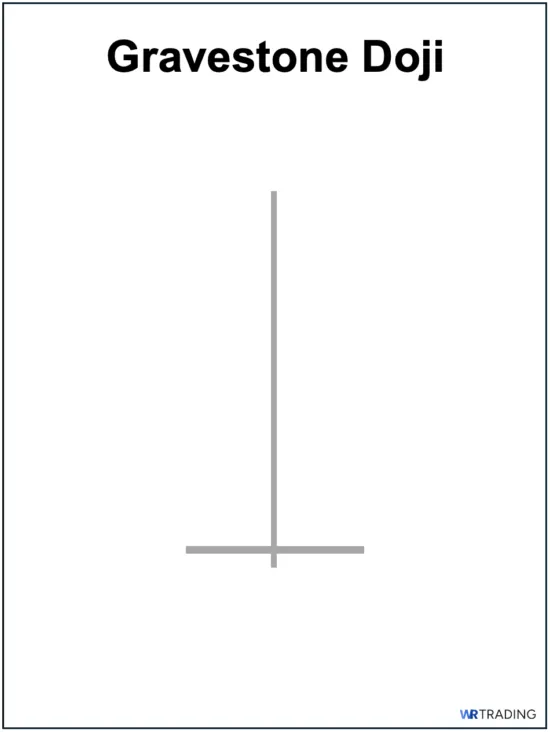
5. Gravestone Doji
Fifth, the gravestone doji is the exact opposite of the dragonfly doji and looks like an inverted capital letter “T.” This type of doji is most useful when it appears at the top of an established uptrend as it visually illustrates a rejection of higher prices. Hence, it has a bearish directional bias as it may be a precursor to a possible bearish reversal. That said, similar to the dragonfly variant, a confirmation candle is still needed.
(Learn To Trade And Read Candlestick Patterns Like A Pro)
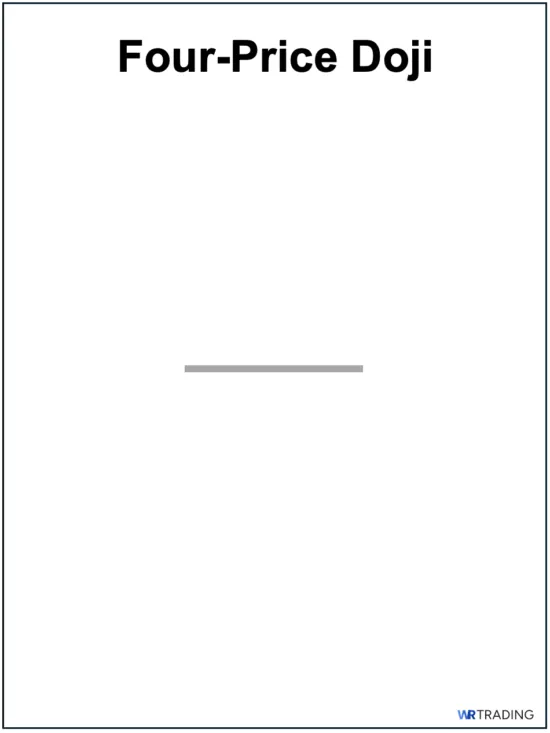
6. Four-Price Doji
Sixth, a four-price doji looks like a hyphen or a mathematical minus sign. From its name, all 4 crucial prices, the open, high, low, and close, are exactly the same (i.e., there is no price movement at all during that specific period). This type of doji usually appears during periods of extremely low volatility and virtually zero liquidity (e.g., illiquid penny stocks).
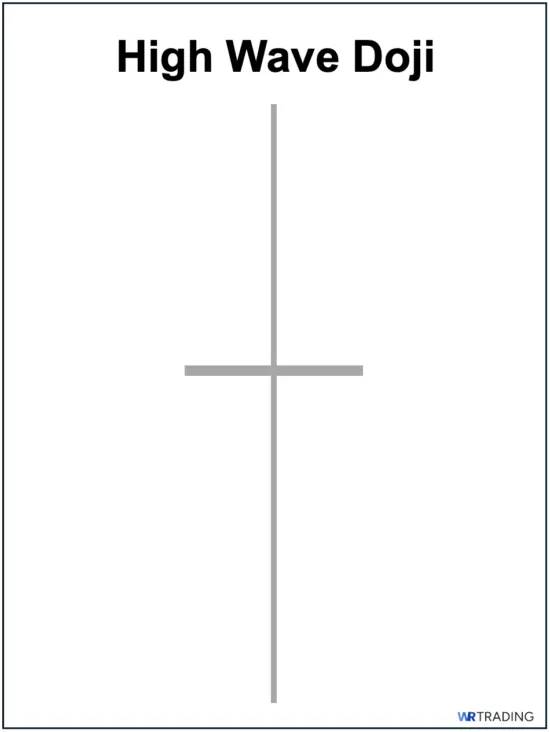
7. High Wave Doji
Seventh, a high wave doji has an extremely large candle range and looks like an exaggerated or oversized long-legged or rickshaw man doji. This doji type reflects a dramatic or wild price swing within a single period.
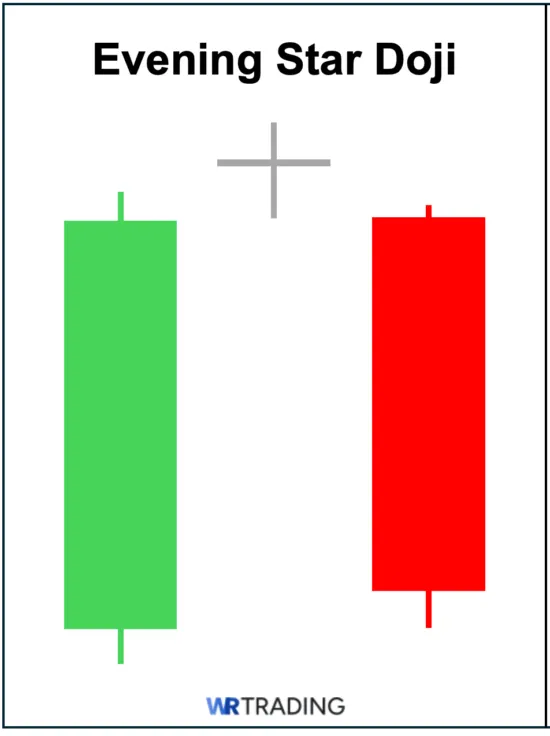
8. Evening Star Doji
Eighth, an evening star doji is technically the second candle of the evening star candlestick pattern, a three-candle bearish formation that appears at the top of an ongoing uptrend. This is because the second candle can either be a small candle or a doji, although having a doji is considered a much stronger bearish reversal variant, as it illustrates a clear progression from bullish (first candle) to uncertainty (doji star), and finally to bearish (third candle).
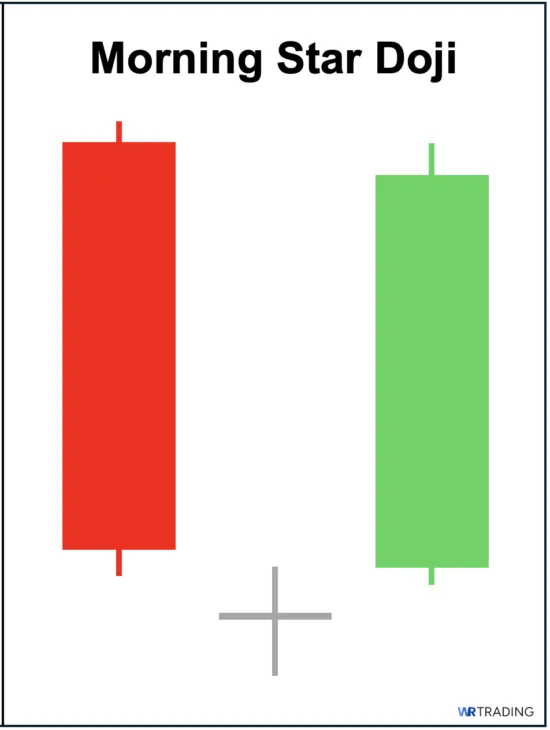
9. Morning Star Doji
Ninth, similar to the evening star doji, the morning star doji is essentially the second candle in the morning star pattern, a bullish reversal three-candlestick formation that appears at the bottom of a downtrend. Having a doji as the pattern’s second candle strengthens the possibility of a successful bullish reversal.
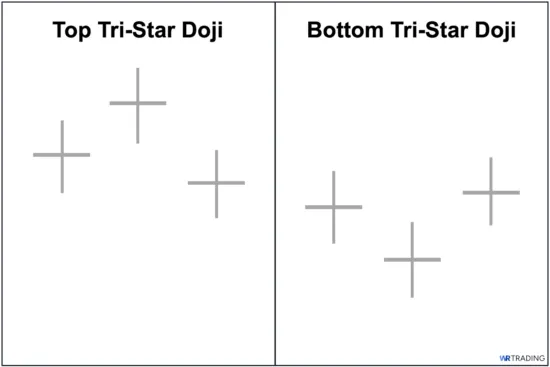
10. Tri-Star Doji
Finally, the tri-star doji is an extremely rare pattern composed of 3 dojis occurring consecutively. Like a doji star, which has a bullish-biased variant (morning star) and a bearish-biased variant (evening star), the top tri-star variant appears at the top of an established uptrend and is bearish-biased, while the bottom tri-star variant appears at the bottom of an ongoing downtrend and is bullish-biased.
(Learn To Trade And Read Candlestick Patterns Like A Pro)
What Does the Doji Pattern Mean in Technical Analysis?
The doji reflects uncertainty or indecision about where the price is headed. In market psychology, a doji can be interpreted as a state of “equilibrium”, where neither buyers nor sellers are in control of the price, and is, therefore, not definitively bullish or bearish.
In other words, both sides (i.e., buyers and sellers) fail to decisively control the price action. This is the reason why, in technical analysis, the following candle is needed to decisively signal either a trend continuation or confirm a potential shift in market sentiment towards a potential reversal. In market psychology, the candle that follows helps identify which side, buyers or sellers, the price is more likely to follow moving forward.
Is the Doji Pattern Bullish or Bearish?
Since the Doji is a neutral candlestick pattern, it is neither a bullish nor a bearish pattern when viewed on its own. In fact, all of its types, even those with a bearish or bullish directional bias, are still considered indecisive until the next candle confirms the market’s intent.
Is the Doji a Reversal Pattern?
When viewed in isolation, the doji is not a reversal pattern but rather a neutral one. It simply marks a point of indecision or uncertainty regarding where the price is headed. That said, the doji can point to a potential trend reversal if it is followed by a confirmation candle. This occurs when it appears at the bottom of a downtrend and is followed by a long-bodied bullish candle, pointing towards a potential bullish reversal, or when it appears at the top of a prevailing uptrend and is followed by a long-bodied bearish candle, signaling a potential bearish reversal.
How to Trade the Doji Candlestick Pattern:
Here is a simple 5-step process you can follow to start trading forex, stocks, and others using the doji pattern:
Step 1: Identify a Valid Doji Pattern – When Does the Doji Pattern Appear?
First, it is important to make sure the doji pattern is valid in the first place. As we have stressed, the doji must appear during a trending move (i.e., on an established uptrend or downtrend). As illustrated above, we can see that the doji appears at the top of an ongoing uptrend, making it a valid pattern.
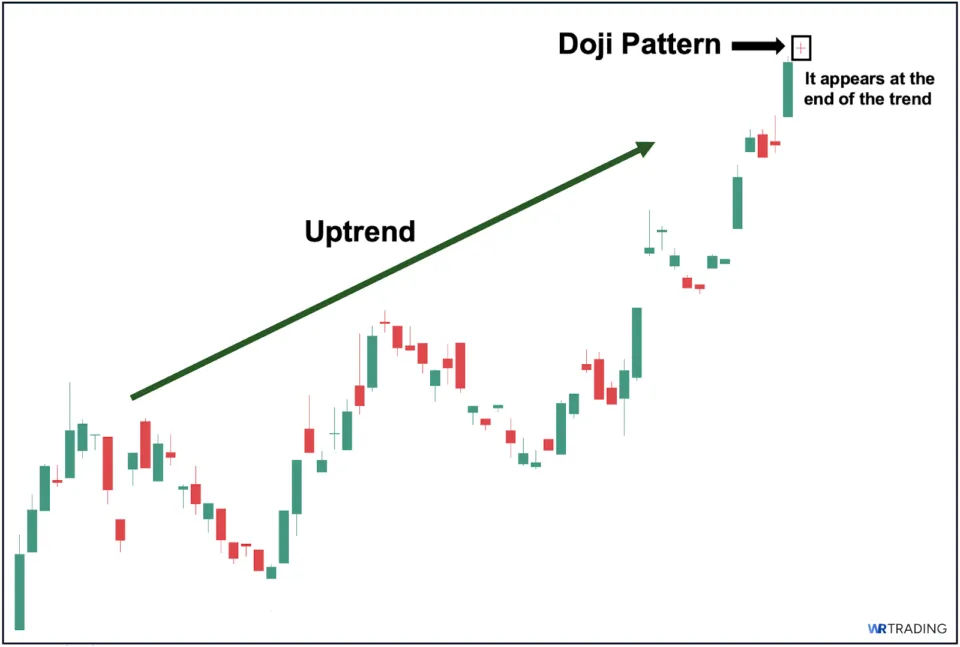
In contrast, if the pattern appears during a non-trending or sideways-moving price action, then the doji loses value as the overall price direction is already indecisive and uncertain.
Step 2: Wait for a Reversal Confirmation Candle to Identify Your Entry
Second, as an indecisive pattern, the doji needs the next candle to validate the shift in market sentiment (from bullish to bearish and vice versa). Remember that the doji only serves to reflect a period of “indecision” of where the price will move next, and it does not decisively indicate a trend reversal. Hence, the following candle will either:
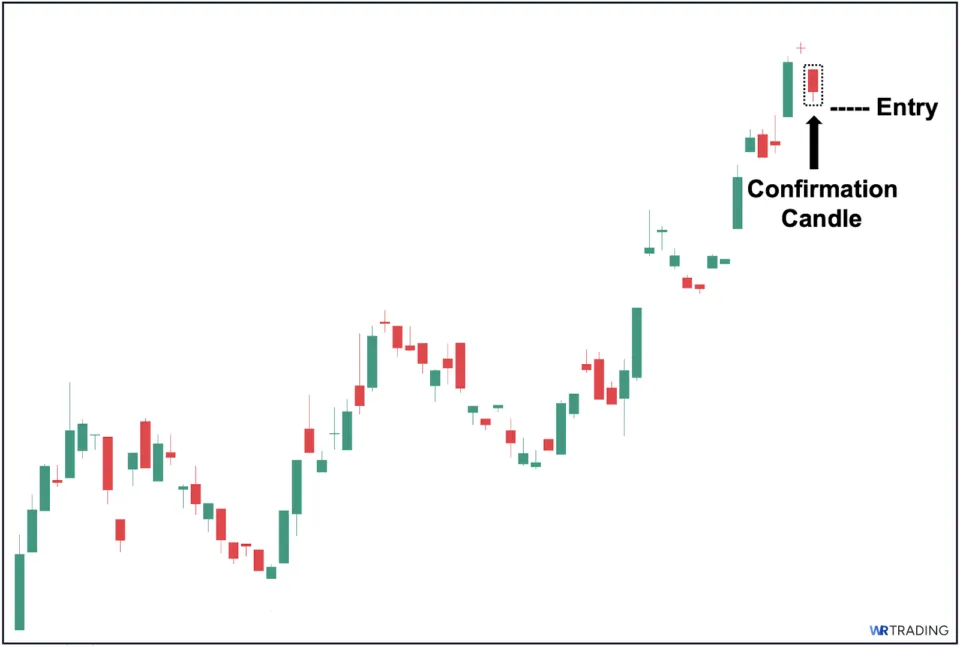
- Serve as a continuation candle if it moves in the direction of the trend (i.e., the existing trend will likely continue), or
- Serve as a confirmation candle if it moves against the direction of the trend (i.e., pointing towards a possible trend reversal).
As shown above, the following candle moves against the current uptrend. Hence, this serves as confirmation that market sentiment has changed, and a bearish reversal may be expected. You can then place your entry either as soon as the confirmation candle closes (aggressive entry) or wait for the price to break below its low (conservative entry).
Step 3: Determine Your Stop Loss (SL) Level
Third, after seeing the confirmation candle and identifying your entry point, the next step is to pinpoint your specific stop loss level. As a general rule of thumb, we recommend placing your stop loss a few ticks above the high of the confirmation candle if during an uptrend (as shown above), or a few ticks below the confirmation candle’s low if during a downtrend.
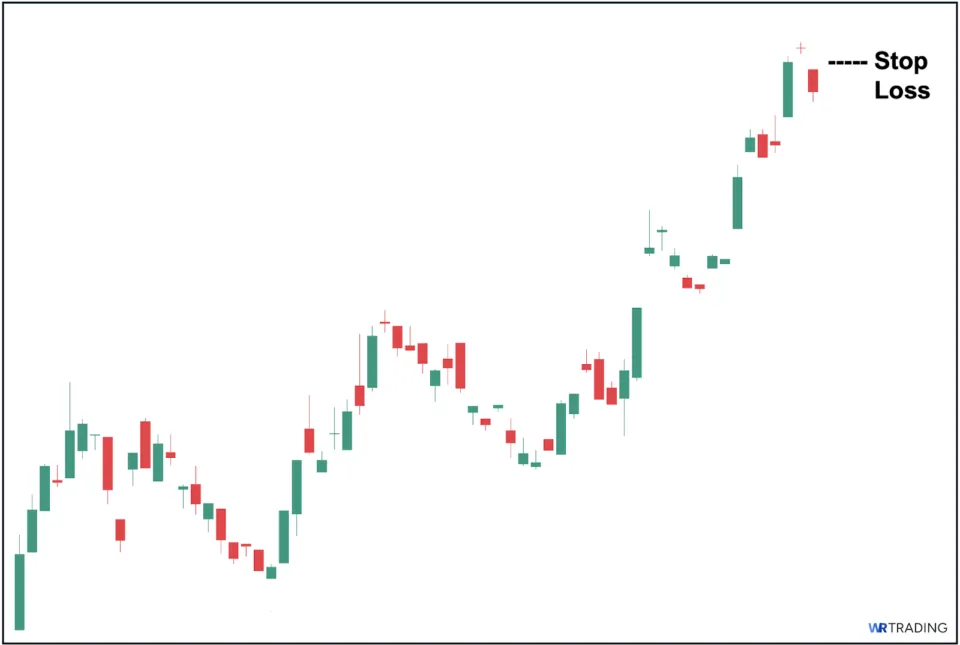
This reduces the risk of hitting your stop loss prematurely, especially if it is placed too close to your entry. Finally, remember that a confirmation candle only increases the probability of a reversal, and it does not and cannot 100% guarantee a successful trend reversal. Hence, a stop loss serves to minimize your losses if the trade does not go in your favor.
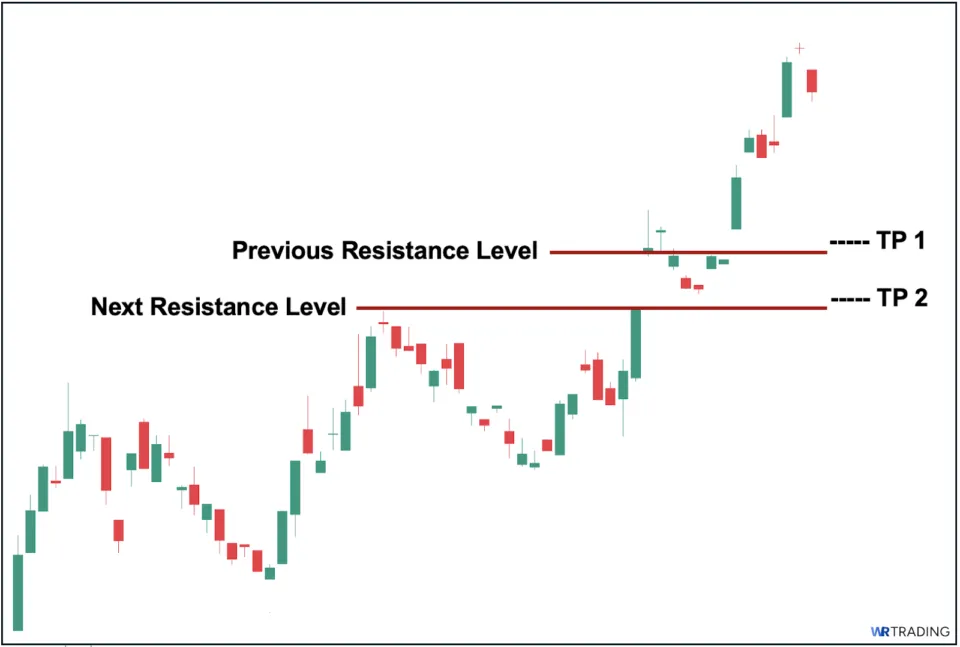
Step 4: Set Your Target Price (TP)
Fourth, after placing a definitive stop loss point in case the trade goes against you, the next step is to identify your target price/s if the trade moves in your favor (i.e., a successful trend reversal). Remember to base your target price/s on an objective metric, such as key structural levels (shown above), where the price is likely to face substantial market pressure that can temporarily or completely stop the price advance.
Also, we strongly recommend that you only take trades with at least a 1:2 risk-reward ratio (this is based on your stop loss point relative to your immediate target price). The higher the potential upside compared to the risk you are taking, the better.
Sample Target Price/s:
- TP 1: A few ticks above the nearest structural level (i.e., previous resistance level)
- TP 2: A few ticks above the next key structural level (i.e., previous major resistance level)
Step 5: Open the Trade
Lastly, after following through with the first four steps, the final step is to place your trade and let it play out. If you follow the four steps beforehand, you will be prepared for whatever the outcome of the trade may be.
(Learn To Trade And Read Candlestick Patterns Like A Pro)
What Are the Pros and Cons of Trading the Doji Pattern?
The following are the pros and cons of using the doji pattern to trade:
Pros
- Adaptable to different market trends
- Flexibility in interpretation
- Early warning sign
- Clear market sentiment
- Easy to spot
Cons
- Not actionable on its own
- May result in a late entry
- Frequent on low volatility environments
- Its multiple types can be confusing
- Highly reliant on the following candle
Advantages of a Doji Pattern
Compared with other candlestick patterns that can only be reliably used exclusively during uptrends or downtrends, doji patterns can be used on both types of trend. Due to its neutral nature, which does not give a decisive bullish or bearish bias until the following candle, the doji allows you to have a more grounded context to its appearance on the price chart.
If you currently hold a position, seeing a doji can serve as a warning or “get ready” sign that, depending on the following candle, it may point to a possible reversal. Unlike other candlestick patterns with much more nuanced interpretations, doji’s market sentiment of simply being “indecisive” is relatively straightforward. Practically, being a relatively rare pattern, it stands out on the price chart more compared with other candlestick patterns.
Disadvantages of a Doji Pattern
Unlike other more decisive candlestick patterns where you can plan your trade based solely on the pattern, a doji is not actionable until the following candle appears. While a confirmation is needed for a potential trend reversal, sometimes the confirmation candle can move dramatically in one direction that the risk-to-reward ratio is simply not ideal (i.e., too much risk).
While generally considered a rare pattern, dojis appear frequently during low volatile and illiquid market periods, thus simply reflecting the lack of market interest. While all doji types are technically indecisive and need a confirmation candle, some variants (e.g., gravestone, dragonfly) have a directional bias, resulting in confusion, particularly among beginners, regarding the nuanced nature of dojis.
A doji’s value will always be incomplete without the following candle to indicate clearly whether the trend is likely to continue or reverse.
What Is the Success/Hit Rate of the Doji Pattern?
Depending on the market context in which it appears, the doji pattern has a success rate of around 50-60%. This can fluctuate depending on the current market environment, your specific trade setup, and other aspects. It is difficult to identify a single precise success rate due to various factors that can impact a particular doji pattern.
Note that the potential for a successful reversal increases significantly if it is a valid doji pattern, one that appears at the top of an uptrend or the bottom of a downtrend, and is followed by a confirmation candle and complemented by at least one synergistic technical tool, such as a moving average or a chart pattern (as we will illustrate in the strategies section below).
Can the Doji Pattern Produce False Signals?
Yes, the doji, like any other candlestick pattern, is not a perfect technical analysis tool. In fact, even if a doji is followed by a confirmation candle and complemented by an additional supporting tool, these only increase the probability of a trend reversal, they cannot guarantee it. Hence, a Doji can still produce false signals.
(Learn To Trade And Read Candlestick Patterns Like A Pro)
Potential Strategies for Trading the Doji Pattern
The following are 3 simple potential strategies you can incorporate to trade the doji pattern:
1. Trading the Doji Pattern with Market Structure
The first strategy involves using the doji pattern with the overall market structure. This strategy leverages the strength of market structure as a major guiding factor of price action, as it is considered to be far superior than any candlestick or chart patterns. We can do this strategy by zooming out the chart when a doji pattern appears. By doing so, we can better contextualize where the price is at.
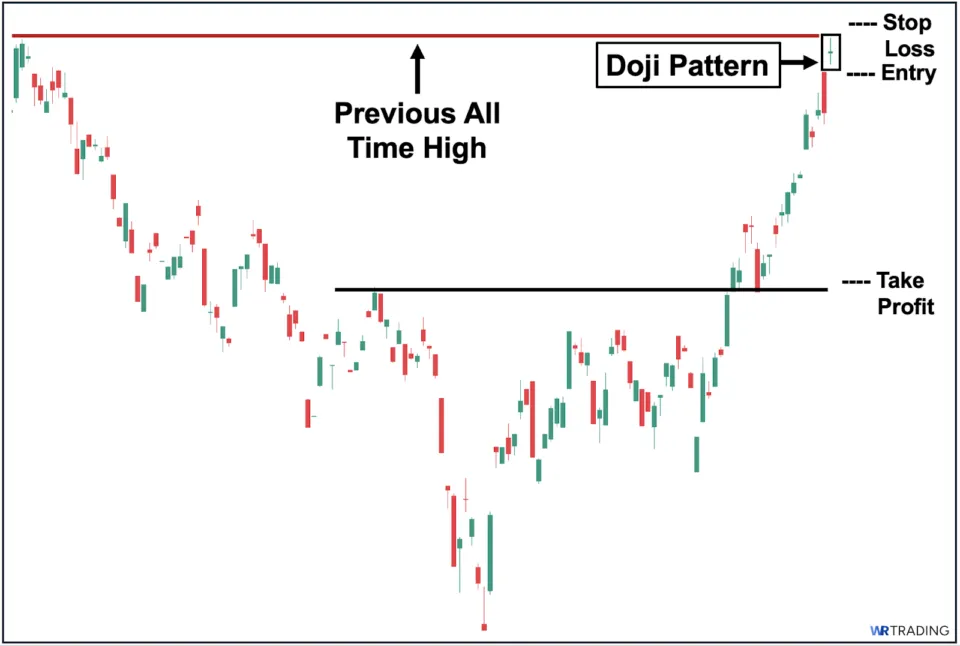
For example, we can see in the above image that a doji pattern appears at the top of an ongoing uptrend. When we zoom out, we can see that its upper wick is hitting the previous all-time high (before it eventually transitioned to a downtrend). With this information, we can conclude that there is a significant resistance for further price rally and unless price closes decisively above this level, then it is far more likely that price will start moving downward.
2. Trading the Doji Pattern with Moving Average
The second strategy involves using a simple moving average, in this case, a 20-period MA to identify the dynamic resistance level where price will likely have difficulty breaking. In this case, in order for the doji pattern to lead to a successful trend reversal, price must first break above this MA.
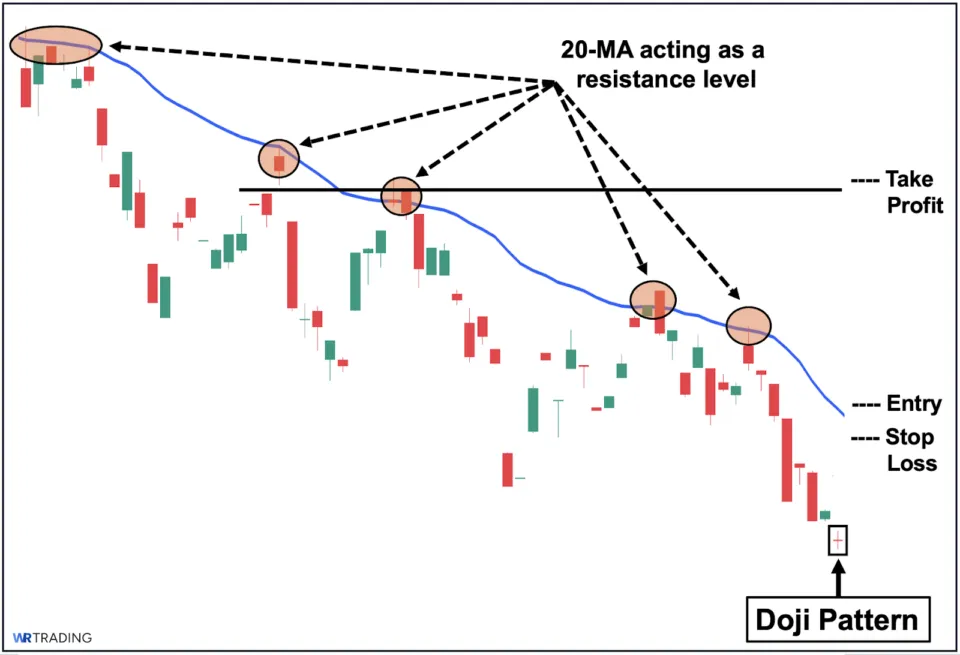
In this example, we can observe how the 20-MA has served as a resistance level, essentially preventing the price from making a bullish countermove as it fails to move above past the 20-MA. Hence, if the doji’s following candle points towards a potential bullish reversal, a conservative approach is to first wait for the price to break the 20-MA before placing a trade.
3. Trading the Doji Pattern with Chart Pattern
The third strategy is utilizing a chart pattern that may have appeared close to the appearance of the doji pattern. By doing so, if both patterns point to a certain direction, then the price is more likely to move according to that bias. To illustrate, we can see an established uptrend in the image above. That said, in the past sessions, the price seems to be consolidating at the top, creating an ascending triangle formation as it failed multiple times to close above this price level.
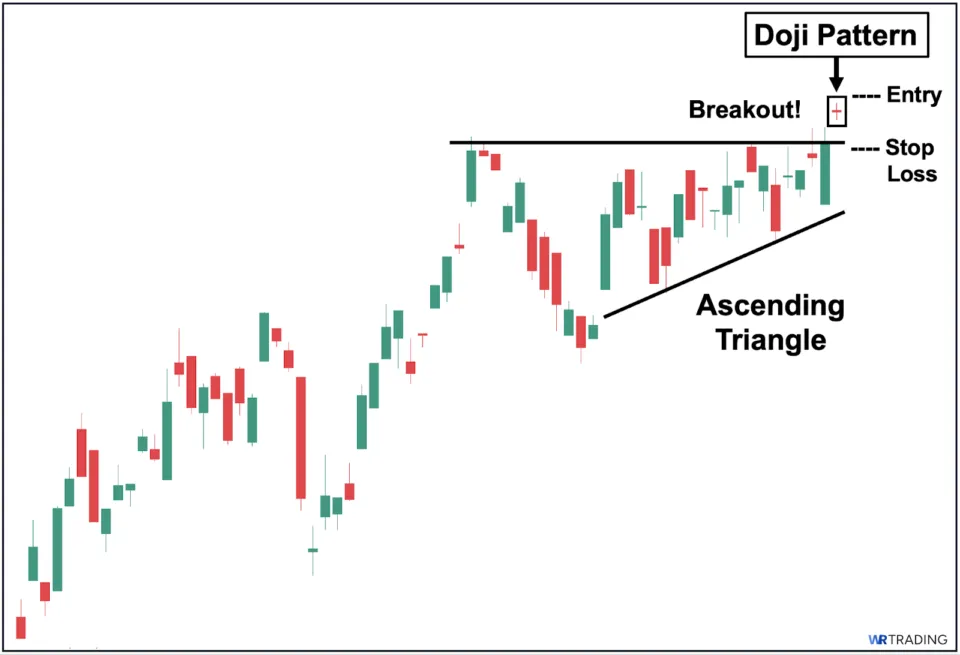
Then, suddenly, a doji pattern appears, closing decisively above this resistance level (a breakout). In this case, while the doji is technically indecisive, by virtue of closing above the previous resistance level, the price action is now more likely to move upwards as long as the following candle does not close below the breakout level.
Which indicators can be combined with the Doji pattern?
You can combine the doji candlestick pattern with technical indicators. Among these indicators, we highly recommend moving averages (MAs). Here are the specific specifications we suggest you use:
Type: Simple Moving Average (SMA)
Depending on the length of the trend, here are the MA periods you can use effectively:
- 10-period SMA – for high momentum short-term trends
- 20-period SMA – for lower momentum short-term trends (as used in our example)
- 50-period SMA – for medium-term trends
- 100-period SMA – for long-term trends
RSI
For reversal confirmation, we recommend the default setting of RSI which has a length of 14 SMA with a standard deviation of 2. Here, look for a divergence between price and RSI (i.e., they start to move in opposite directions.
MACD
For trend continuation confirmation, it’s ideal for the MACD (blue) line and the Signal (orange) line to maintain a healthy distance from each other. Otherwise, if they begin to move closer or starts to crossover, then it’s likely signalling a trend reversal instead.
(Learn To Trade And Read Candlestick Patterns Like A Pro)
What are the Alternatives to the Doji Pattern?
Here are 3 candlestick formations you can use as an alternative to the doji pattern:
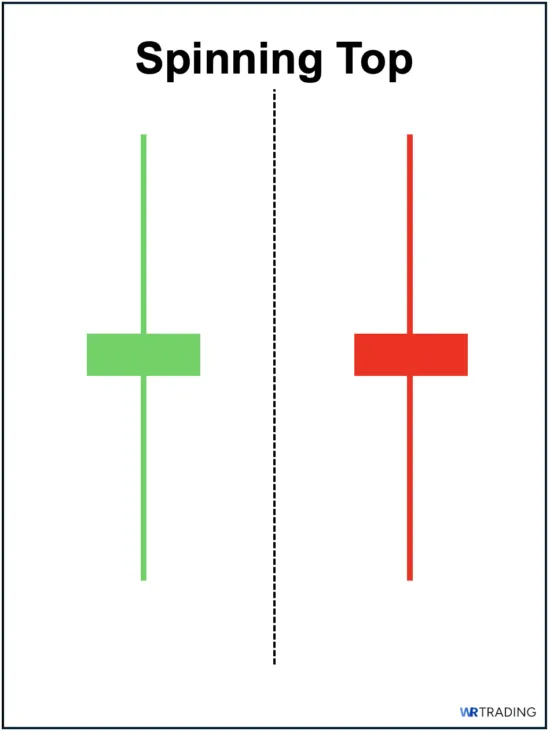
1. Spinning Top
First, similar to the doji, the spinning top is also an indecisive one-candlestick pattern. The main difference, however, is that unlike the doji pattern, the spinning top has a small but noticeable body, whereas dojis have extremely slim or even non-existent bodies. Because it has looser criteria, it appears more frequently than its direct doji counterpart, the long-legged variant.
2. Inside Bar
Second, the Inside Bar is an indecisive two-candlestick pattern consisting of a larger first candle and a much smaller second candle contained within the first candle’s range. Unlike the similarly looking bullish and bearish engulfing patterns, the colors of the 2 candles do not matter; they can even be the same color.
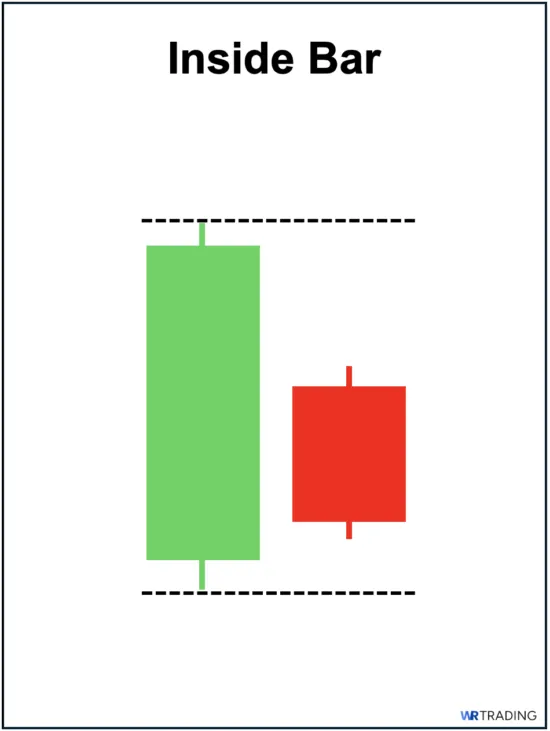
The second candle serves to contrast the decisive move made by the first candle, as it suddenly halts the price rally and instead moves within a much smaller range, reflecting an uncertain market sentiment.
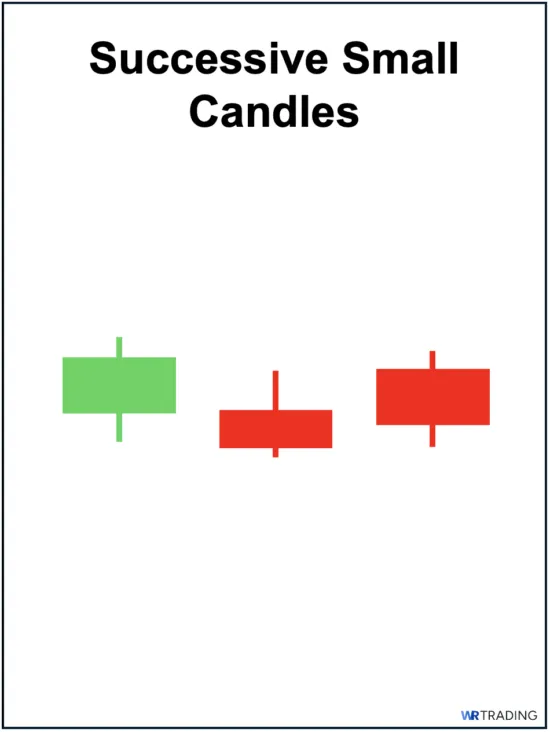
3. Successive Small Candles
Third, a more practical alternative to the elusive Doji pattern is a series of successive small candles that appear after a strong price rally, whether during an uptrend or a downtrend. These candles suggest either a brief pause or growing indecision about where the price action will go next.
More patterns can be found in our free Candlestick Patterns PDF for beginners and advanced traders.
Learn to Trade Patterns with WR Trading Mentoring
As we have illustrated in this comprehensive guide to trading the doji, a seemingly simple candlestick pattern can have many nuances and layers that even experienced traders can benefit from mastering. Better yet, the doji pattern and its unique variants are just some of the many candlestick formations we delve into detail in our mentoring class at WR Trading.
(Learn To Trade And Read Candlestick Patterns Like A Pro)
Conclusion
To conclude, the doji is one of the most well-known candlestick patterns in technical analysis, with its simplicity being a key reason for its popularity. While it does have many variations, all of them form when the opening and closing prices are identical or nearly identical, resulting in a very thin body. As a neutral pattern, remember that a doji is neither bullish nor bearish when viewed on its own and instead merely reflects uncertainty or indecision among market participants regarding the price’s direction.
Regardless, it can still offer meaningful insight into market sentiment, particularly when it suddenly appears during strong uptrends or downtrends, as it may hint at early signs of weakening trend momentum. This is especially true when you’re looking to trade the pattern, as it’s rarely actionable on its own. In fact, we strongly recommend not using the doji in isolation and instead waiting for confirmation, whether in the form of a following candle or a supporting technical indicator, that clearly signals a potential trend reversal before taking a position.