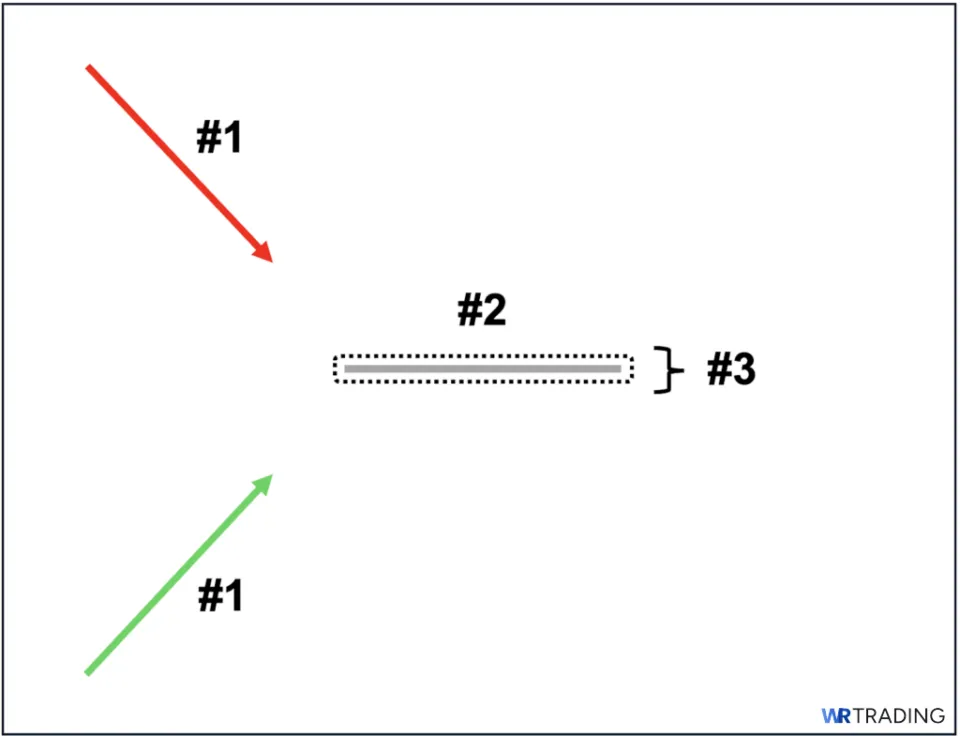
The four-price doji is a one-candle neutral pattern in which the opening, high, low, and closing prices are all identical or equal. This means that the price did not move at all during the trading session. As a result, the four-price doji appears as a thin horizontal line or a minus sign (–) on the price chart, as it has no real body and no upper or lower wicks (shadows).
The pattern is considered neutral or indecisive because it reflects an absence of market sentiment and, often, a lack of trading interest, as the price did not move at all. Hence, when it appears during an active trend, whether an uptrend or a downtrend, it can either be a pause or, more significantly, a sign of weakness or “trend exhaustion” in the ongoing trend.
From our experience, it’s best traded with caution and only when confirmed by a decisive follow-up (confirmation) candle or, at least, a supporting technical indicator, as this improves the probability that a trend reversal can happen. Also, the four-price doji is extremely uncommon to see during active trends, both in uptrends or downtrends.
Key Facts and Specifications of the Four-Price Doji Pattern:
- Type of Pattern: Neutral/Indecisive single candlestick pattern
- Pattern Construction
- Body: Must be extremely thin (visually, it looks like a small horizontal line)
- Wicks/Shadows: No upper and lower wicks/shadows
- Trend Prior to the Pattern: It must appear during an uptrend or a downtrend. Otherwise, it becomes insignificant if it occurs during a sideways (non-trending) period.
- Trend Forecast: It can simply be a “pause” before the trend continues or a sign of weakness or “trend exhaustion” in the ongoing trend, hinting at a potential reversal.
- Opposite Pattern: A “High Wave Doji,” which has an extremely large upper and lower wicks/shadows. It reflects dramatic or wild price swings within a single period.
- Stop Loss Placement:
- Aggressive/Tighter Stop Loss: Depending on the trend, above or below the “confirmation candle” (we will illustrate this later) following the four-price doji
- Conservative/Wider Stop Loss: Depending on the trend, above or below the four-price doji’s body
(Learn To Trade And Read Candlestick Patterns Like A Pro)
How Does the Four-Price Doji Form?
A valid four-price doji must form during an active trend (either an uptrend or a downtrend). It consists of a single candlestick, formed over one trading session, with identical/equal opening, closing, high, and low prices. In other words, the price did not move at all during the entire session. Because of this, the four-price doji appears as a thin horizontal line or a minus sign (–) on the price chart, as it lacks upper and lower wicks (shadows).
However, that while the four-price doji can, and, in fact, often does appear during a non-trending (sideways-moving) period, it is not useful or meaningful, as the ongoing market sentiment is already indecisive and uncertain regarding where the price will go because, again, there is no trend to begin with.
What Does the Four-Price Doji Pattern Mean?
Unlike other doji types, the four-price doji is considered a neutral/indecisive candle in technical analysis not because buyers and sellers actively fought during the session only to reach a point of “market equilibrium” where neither of them wins, but because there was no contest at all between buyers and sellers. This is illustrated by the pattern’s visual appearance, looking like a thin horizontal line or a minus sign (–) as its opening, closing, high, and low prices are identical.
Furthermore, in terms of market psychology, the pattern reflects a lack of trading interest from both buyers and sellers, as there was no effort to sway the price in either direction. This is particularly notable when it appears during a trend, as it can indicate potential trend exhaustion that may eventually lead to a reversal, when followed by a confirmation candle or another confirmation tool.
How to Identify the Four-Price Doji Pattern?
For it to be a valid “four-price doji” pattern, the following are the three key characteristics that it must possess when it forms on a price chart:
1. Chart Placement: It must occur either during an uptrend or a downtrend
2. Candle’s Body: The pattern’s body must be extremely thin
3. Candle’s Wicks: The pattern must have no upper or lower wicks at all
What is an Example of the Four-Price Doji Pattern?
As we can see in the example above, there was a prevailing downtrend prior to the appearance of the four-price doji. The pattern, as shown, opened lower compared to the previous candle, but the price did not move in either direction, higher or lower, throughout the entire trading session, hence the appearance of a thin horizontal line. In this scenario, the pattern reflects a point of trend exhaustion, as selling pressure has seemingly dried up.
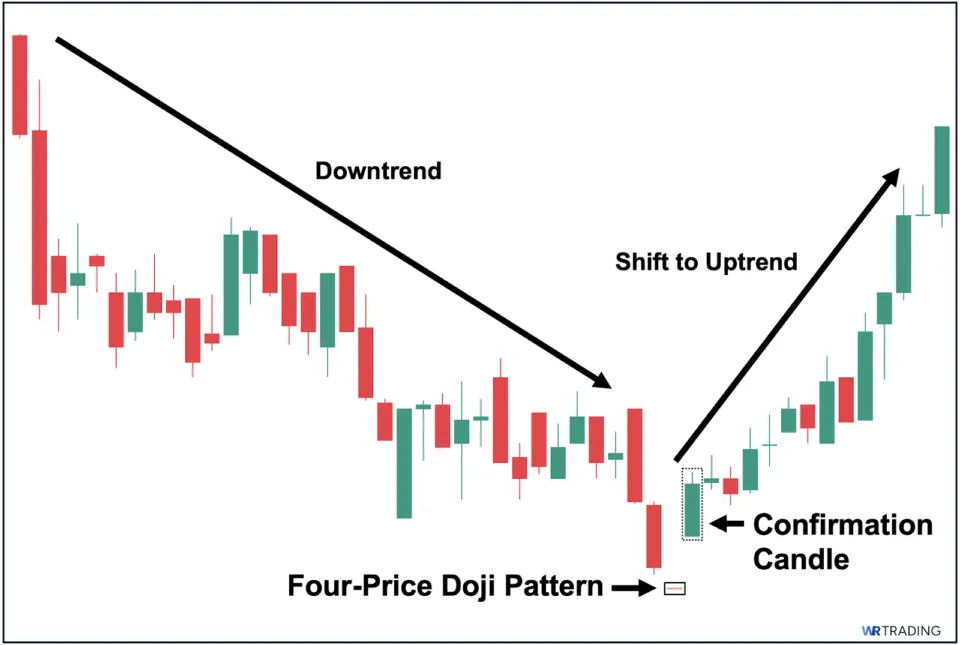
This is confirmed when it is followed by a long-bodied bullish candle that closes above the four-price doji, serving as confirmation that a bullish reversal may be expected. This, in fact, materialized, as it eventually led to a bullish rally, as evidenced by the sharp upward move.
(Learn To Trade And Read Candlestick Patterns Like A Pro)
How to Trade the Four-Price Doji Pattern: A Comprehensive Guide
The following is a simple 5-step process you can follow to start trading stocks, forex, and others using the four-price doji pattern:
Step 1: Identify a Valid Four-Price Doji Pattern
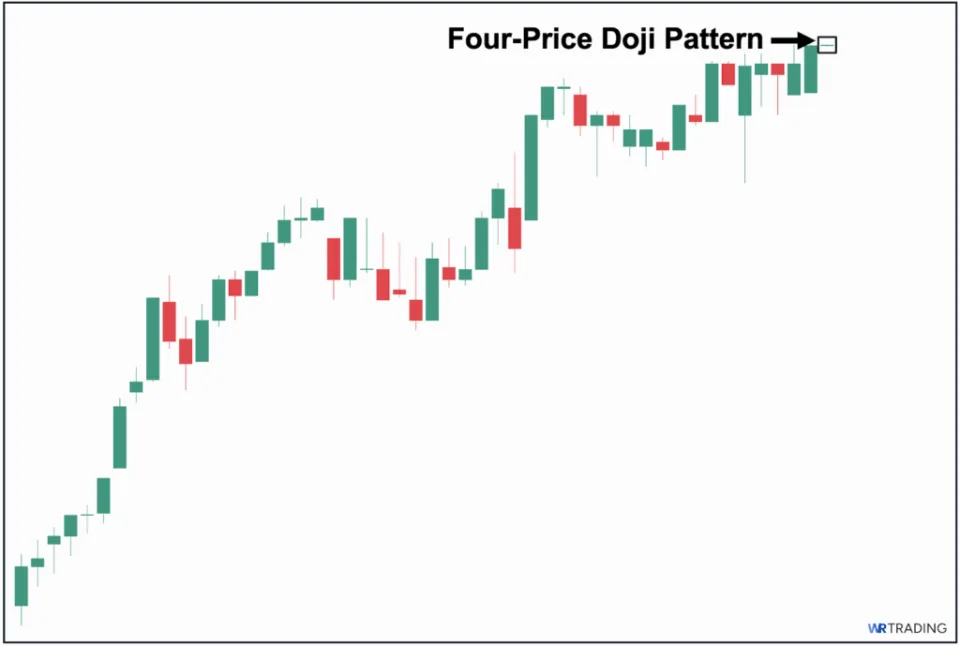
First, it is crucial to ensure that the four-price doji pattern appears during an active trend, either an uptrend or a downtrend. Remember, if the four-price doji appears during a non-trending (sideways-moving) period, the pattern is practically meaningless, as the market sentiment is already indecisive. As shown above, this is a proper example of a four-price doji appearing during an ongoing uptrend, as it introduces doubt as to whether the bullish trend will continue.
Step 2: Wait for a Reversal Confirmation Candle to Identify Your Entry
For a reversal strategy, the second step is to wait for a “confirmation” candle. In this case, the following candle must be a decisive bearish (red) candle that closes below the four-price doji to confirm a potential bearish reversal. Remember, the four-price doji is neutral and indecisive by nature, making it unactionable on its own. This is why waiting for the next candle is essential before considering a trade.
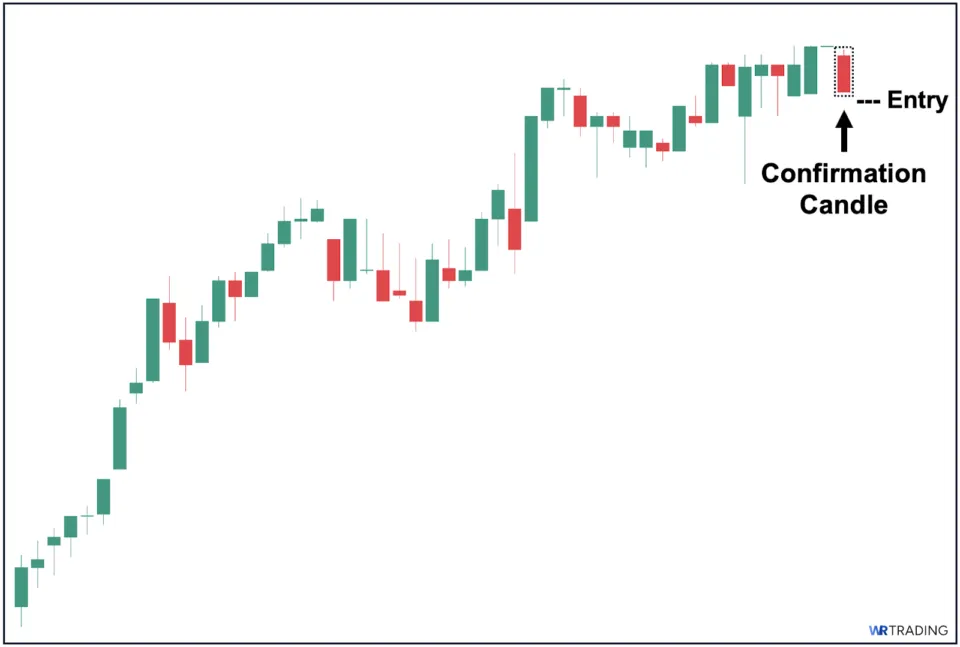
That said, once a confirmation candle appears (such as shown in the image above), you then need to identify your specific entry point. For your entry, we recommend either:
- Aggressive Entry – Placing your buy order at the closing price of the confirmation candle.
- Conservative Entry – Placing your buy order after the price breaks further below the low of the confirmation candle (as an added layer of confidence).
Step 3: Determine Your Stop Loss (SL) Level
Third, after choosing your entry, you need to identify a definitive stop loss point, where you will exit the trade if the price suddenly continues in the direction of the trend (in this example, the uptrend). Here, you can either choose a:
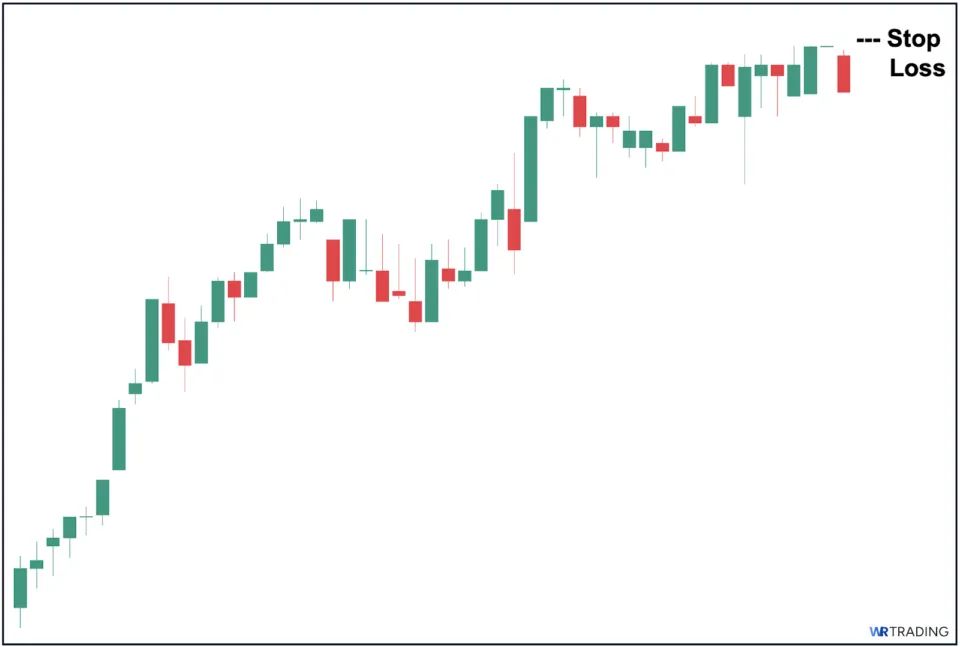
1. Tighter Stop Loss – Placing your stop loss (exit) order just above the high of the confirmation candle (see above image for illustration).
2. Wider Stop Loss – Placing your stop loss (exit) order above the four-price doji.
Step 4: Set Your Target Price (TP)
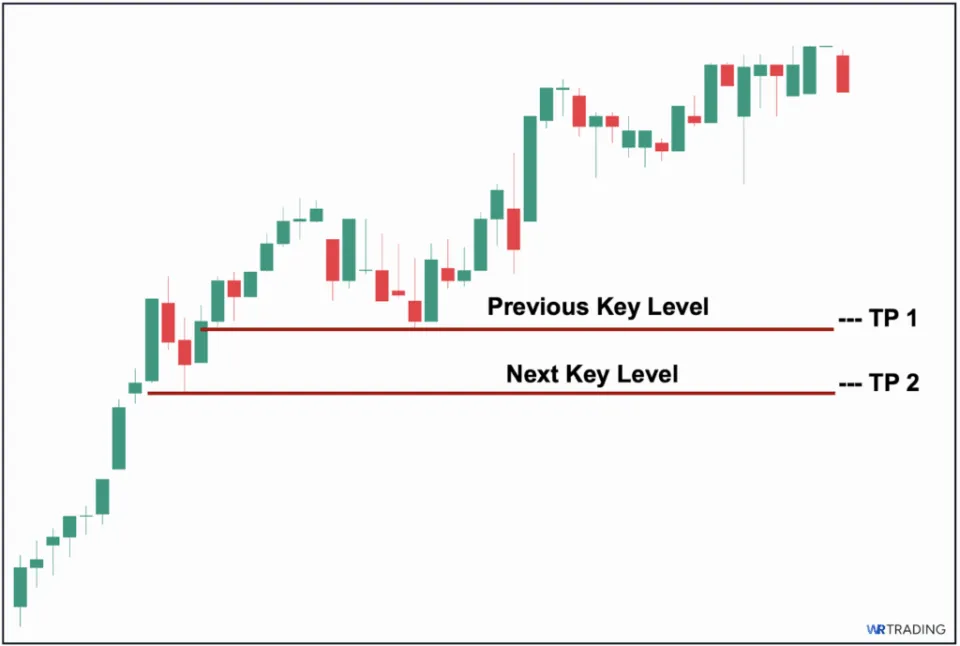
Fourth, you then need to identify your target price/s where you will place your sell orders if price moves in your favor (in this example, if the pattern leads to a successful bearish reversal).
Overall, we recommend selling in tranches, so you will have the opportunity to capture a bigger profit potential if the bearish rally ever extrends. For example, we placed two TPs above based on key structural levels where price may potentially encounter significant buying pressure that could halt the downward (selling) pressure.
Step 5: Open the Trade
Lastly, the final step is to actually open the trade by following your trade plan (steps 1 to 4), placing your sell (short) order at your pinpointed entry point and setting your predefined stop loss and target price orders in advance. Furthermore, we strongly recommend only taking positions with at least a 1:2 risk-reward ratio, meaning the upside potential should be twice the potential downside.
(Learn To Trade And Read Candlestick Patterns Like A Pro)
Is the Four-Price Doji Bullish or Bearish?
The four-price doji is neutral by nature, neither bullish nor bearish. That said, unlike other doji types, the four-price doji is considered neutral not because buyers and sellers actively fought during the session and reached a point of “market equilibrium” where neither side prevailed, but because there was no contest at all between them. This is reflected in the pattern’s appearance: a thin horizontal line, as the price did not move at all during the entire trading session.
What Are the Best Trading Strategies for the Four-Price Doji?
Here are three of the best trading strategies to use with the four-price doji pattern:
1. Trading the Four-Price Doji with Moving Average
MA Settings: Simple Moving Average (MA Length: 20)
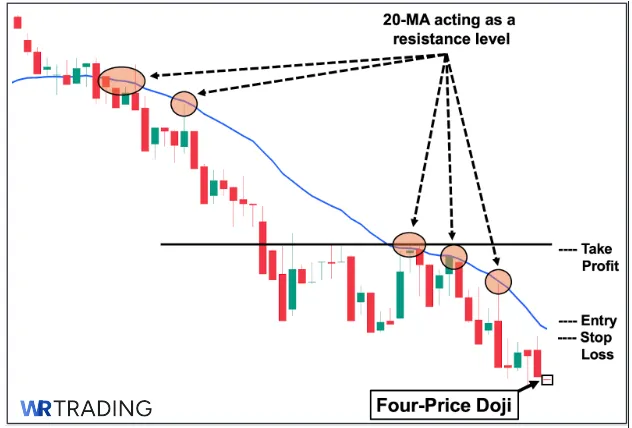
First, you can use a simple moving average, such as the 20-day MA, to pinpoint “dynamic” resistance levels where price will most likely struggle to break through. In the example above, for the four-price doji to confirm a successful trend reversal, price must first break above this moving average.
As we can see in the illustration above, the 20-MA has been acting as a resistance level during the ongoing downtrend, consistently preventing price from breaking above it. This confirms that the moving average is a significant level, and breaking through it will most likely lead to a successful trend reversal. Hence, when the four-price doji suddenly appears, although it may hint at a reversal, it’s best to wait for price to break above the 20-MA before considering a potential long entry.
How to Trade (Trade Setup):
- Entry: Place your entry above the 20 MA line. The price needs to break this resistance first to confirm a potential trend reversal.
- Stop Loss: Assuming price breaks above the 20 MA line, place your stop loss just below this line, as a move back under the 20 MA would invalidate the potential trend reversal.
- Take Profit: Place your TP a few ticks just below the nearest key structural level.
2. Trading the Four-Price Doji with RSI
RSI Settings: Default (14 SMA, 2 Standard Deviation)
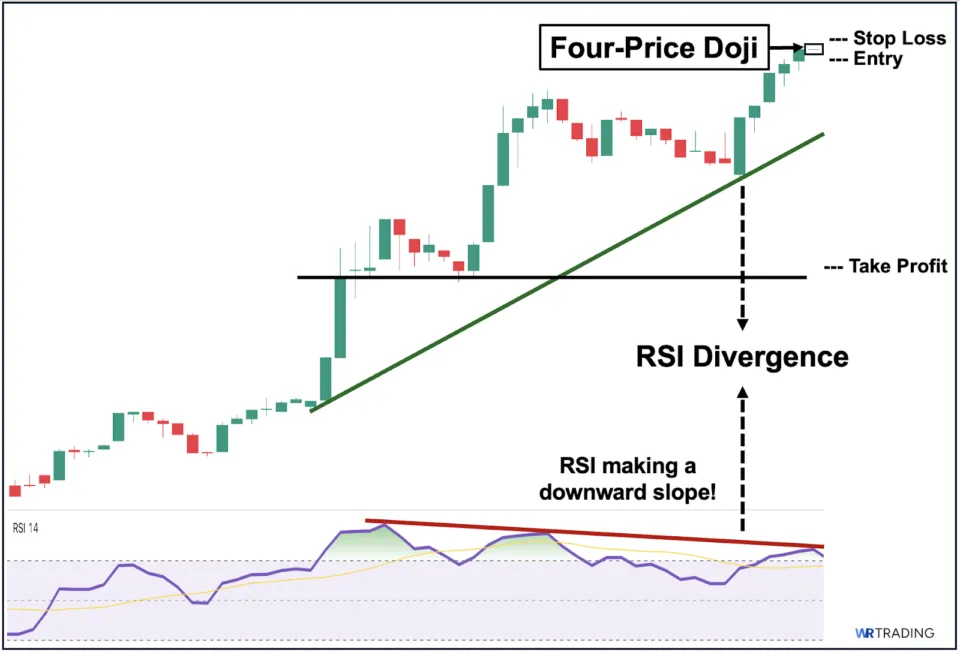
Second, you can use a combination of the appearance of the four-price doji and the presence of RSI divergence. In technical analysis, RSI divergence is one of the most sought-after reversal signals, as it essentially functions as a leading indicator when it appears on a chart. RSI divergence occurs when the RSI’s slope moves in the opposite direction of price.
For example, as shown in the image above, while price has been making higher highs, the RSI has been forming lower lows, creating a distinct divergence. In this case, the appearance of the four-price doji reinforces the possibility of a looming trend reversal, as it fuels uncertainty and doubt regarding the ongoing uptrend.
How to Trade (Trade Setup):
- Entry: Place your entry just below the four-price doji’s low (remember, wait for a confirmation candle to first appear).
- Stop Loss: Place your stop loss just above the four-price doji’s high.
- Take Profit: Place your TP a few ticks above the nearest key structural level.
3. Trading the Four-Price Doji with Market Structure
For example, as shown in the image above, the doji appears near the previous all-time high resistance level. Hence, with this information, we can interpret the four-price doji not merely as a random pause, but as a potential early warning of a reversal, since this price level has historically served as a strong “ceiling” in the past.
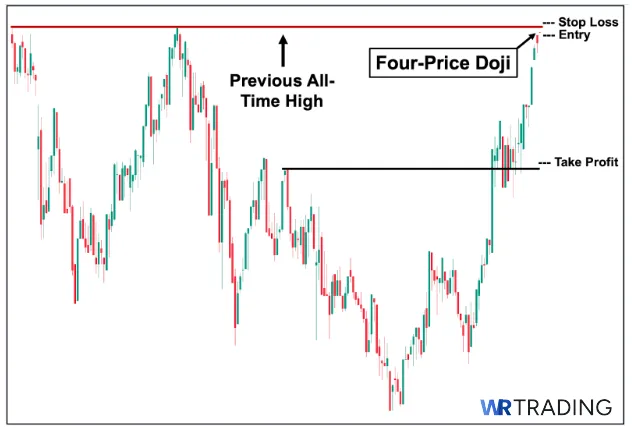
Lastly, the most basic approach in technical analysis is to zoom out and contextualize the appearance of the four-price doji within the broader price structure. Compared to using technical indicators, market structure offers a more raw and undisturbed view of key levels, particularly support and resistance zones that often anchor price reactions
How to Trade (Trade Setup):
- Entry: Place your entry just below the four-price doji’s low (remember, wait for a confirmation candle to first appear).
- Stop Loss: Place your stop loss a few ticks above the all-time high resistance level.
- Take Profit: Place your TP a few ticks above the nearest key structural level.
(Learn To Trade And Read Candlestick Patterns Like A Pro)
What is the Success Rate of the Four-Price Doji?
As a rule of thumb, the four-price doji should never be used in isolation, as it is neither bullish nor bearish. That said, if the doji is followed by a confirmation candle signaling a potential trend reversal, the general success rate of the reversal playing out is around 50–60%.
Moreover, this success rate can be improved when the pattern is supported by complementary technical indicators such as the RSI, moving averages, or volume. Just remember that, at the end of the day, the pattern’s effectiveness still depends on the specific asset class, market environment, and your overall trade setup.
What are the Pros and Cons of the Four-Price Doji?
The following are the key pros and cons of using the four-price doji:
Pros
- An early warning sign of trend exhaustion
- Versatile in different trend environments
- Reflects the absence of a market sentiment
Cons
- Highly dependent on the following confirmation candle
- Not a standalone trade signal
- Primarily caused by low volatility
What are the Advantages of the Four-Price Doji Pattern?
Here are the notable advantages of using the four-price doji as part of your trading strategy:
- An early warning sign of trend exhaustion: The four-price doji has a unique value proposition of serving as a potential early warning sign of trend exhaustion before a trend reversal occurs. The pattern strongly conveys early signs of weakness or hesitation to continue moving forward.
- Versatile in different trend environments: Compared with other candlestick patterns that can only be effective during an uptrend (for bearish reversal patterns) or during a downtrend (for bullish reversal patterns), the four-price doji, being a neutral pattern, can be a valuable tool in both uptrends and downtrends.
- Reflects the absence of market sentiment: When trading different asset classes such as forex and stocks, the four-price doji sends a clear message about the current market sentiment, that neither buyers nor sellers currently have interest in the asset. Hence, it signals that the market is completely indecisive and not biased toward either a bullish or bearish direction.
What are the Disadvantages of the Four-Price Doji Pattern?
Here are the key disadvantages you need to be aware of when using the four-price doji:
- Highly dependent on the following confirmation candle: Unlike other candlestick patterns that can be used on their own, the four-price doji, being a neutral pattern, is highly dependent on the following candle to either disqualify or confirm a reversal signal. This is especially true, as the four-price pattern reflects the absence of trading interest from both buyers and sellers.
- Not a standalone trade signal: Due to the nature of the four-price doji as a highly indecisive pattern, and its heavy dependence on the following candle, it is not advisable to use it as a standalone trade signal, where a position is taken based solely on the doji itself.
- Primarily caused by low volatility: Finally, the four-price doji is often simply the result of an extremely low-volatility period within a trend. Hence, the pattern merely reflects a lack of interest from both sides during that session, resulting in no movement in either direction. For many trading strategies that rely on high volatility, this is far from an ideal scenario.
Can the Four-Price Doji Fail?
Yes, the four-price doji, like any other candlestick pattern, can produce false signals.In fact, on its own, the four-price doji is perceived as a highly indecisive signal, but this can still be wrong. Note that no candlestick pattern is 100% accurate or reliable, even when supported by complementary technical analysis tools like the RSI or moving average.
Hence, even if it appears during a trend and is followed by a confirmation candle pointing to a potential reversal, the signal can still fail, and the price may simply continue with the original trend.
(Learn To Trade And Read Candlestick Patterns Like A Pro)
What are the Alternatives to the Four-Price Doji Pattern?
Here are two potential alternatives to the four-price doji pattern:
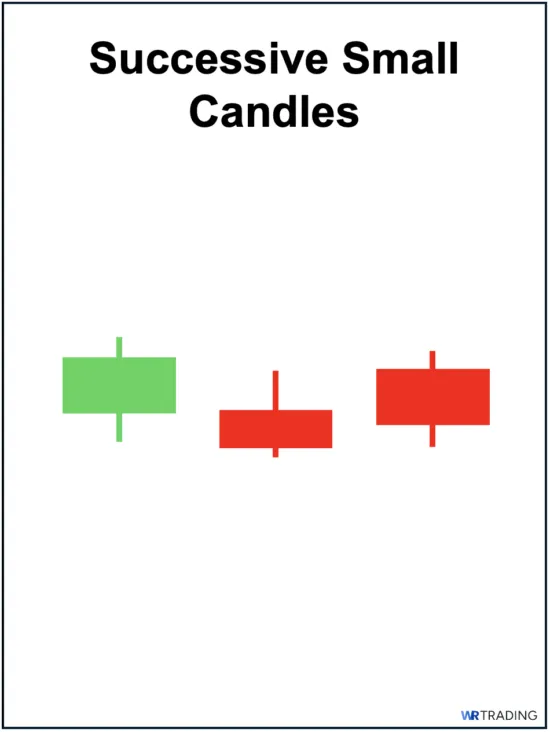
1. Successive Small Candles
First, and perhaps a more practical alternative to the four-price doji pattern is simply a series of successive small candles that appear either during an uptrend or a downtrend. These candles suggest either a brief pause or growing indecision about where the price action will go next.
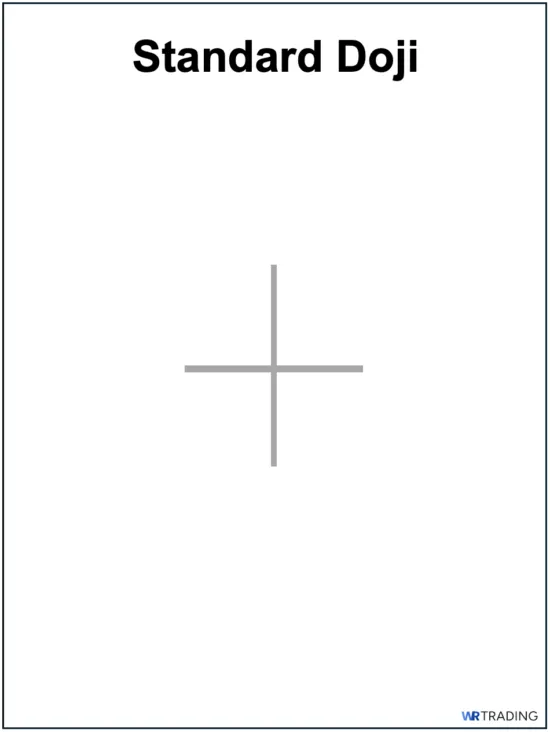
2. Standard Doji
Second, another practical alternative is the standard doji, which appears more often, and looks like a small cross (or a plus sign in math function). Just like the four-price doji, a standard doji reflects indecision and uncertainty.
What Other Types of Dojis Exist?
The following are the other types of dojis that can appear on a price chart and of which you can use:
1. Dragonfly Doji
First, the dragonfly doji looks like the capital letter “T.” The pattern has extremely small or no upper wick at all while having a long lower wick/shadows.
2. Gravestone Doji
Second, the gravestone doji is the complete reverse of the dragonfly doji and looks like an inverted capital letter “T.” The pattern has a long upper wick/shadow while having an extremely small or no lower wick/shadow at all.
3. Rickshaw Man Doji
Third, the rickshaw man has symmetrical upper and lower wicks. That said, compared to the four-price doji, the rickshaw man’s upper and lower wicks (or shadows) are significantly longer.
4. Long-Legged Doji
Fourth, the long-legged doji also has long wicks/shadows on both sides. That said, one of its wicks/shadows (either upper or lower) is distinctly larger than the other.
5. High Wave Doji
Fifth, a high wave doji has “exaggerated” wicks/shadows on both sides (even much bigger than long-legged or rickshaw man dojis). Hence, this makes it literally stand out on a price chart.
6. Tri-Star Doji
Finally, the tri-star doji is an incredibly rare formation consisting of 3 dojis occuring after each other. This type of doji usually appears when volatility and liquidity in a particular asset are both extremely low.
Learn Pattern Trading with the WR Trading Mentoring
As we have covered in this comprehensive guide, even a seemingly insignificant pattern (due to its tiny appearance and its lack of market sentiment) can serve as an early and valuable clue to potential trend exhaustion or even reversal, and this is just one of the many doji types. In our mentoring class at WR Trading, we explore in detail other high-impact doji candlestick patterns and show how to use them practically across different market conditions and asset classes, including major markets like stocks and crypto.
(Learn To Trade And Read Candlestick Patterns Like A Pro)
Conclusion: Four-Price Doji appears when the market goes silent
All things considered, the four-price doji stands out as the most extreme form of indecision among all doji types, as it reflects a complete absence of price movement within a single trading session. Since the pattern’s opening, high, low, and closing prices are all identical, this results in its appearance of being a flat, thin horizontal line with no upper or lower wicks.
In our experience, the four-price doji is one of the rarest candlestick patterns to appear during volatile market conditions. In fact, we tend to see (and expect) the pattern more often on dry, low-volume sideways moving markets. Hence, when it does emerge in the middle of a strong trend, it often signals a potential momentum loss or even trend exhaustion, allowing us to prepare for a looming reversal soon, particularly when it is supported by a confirmation candle or another technical indicator.