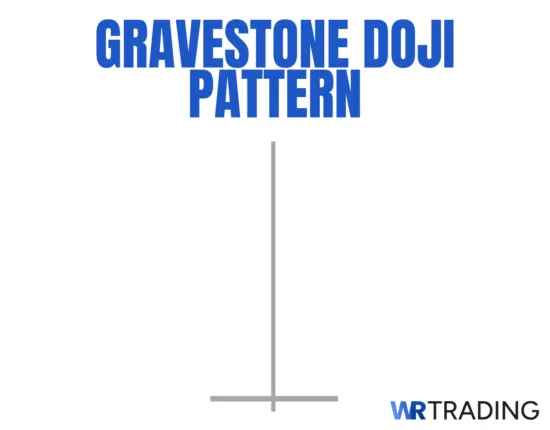
The gravestone doji is a one-candlestick neutral pattern with a bearish directional bias. Visually, it looks like a gravestone (hence the name) or like an inverted letter “T”. Structurally, it is classified as a doji because of its identical (or nearly identical) opening and closing prices. That said, its long upper wick and extremely small or even non-existent lower wick reflect a rejection of higher prices, which is why it is widely viewed as a bearish signal and a possible precursor to a trend reversal when it appears during a prevailing uptrend.
Nevertheless, since it is a variant of a doji, which is inherently neutral, we personally do not recommend treating it as a decisive bearish reversal pattern on its own, especially when compared with more conclusive bearish candlestick reversal patterns. In fact, based on our experience, the gravestone doji is largely unreliable without a follow-up confirmation candle or backing from another confirmation tool.
Key Facts of The Gravestone Doji Candlestick Pattern:
- Type of Pattern: Neutral one-candlestick pattern with bearish directional bias
- Pattern Construction:
- Body: Must be extremely thin (visually, it looks like a small horizontal line)
- Upper Wick/Shadow: Must be relatively long
- Lower Wick/Shadow: Must be extremely small or even non-existent
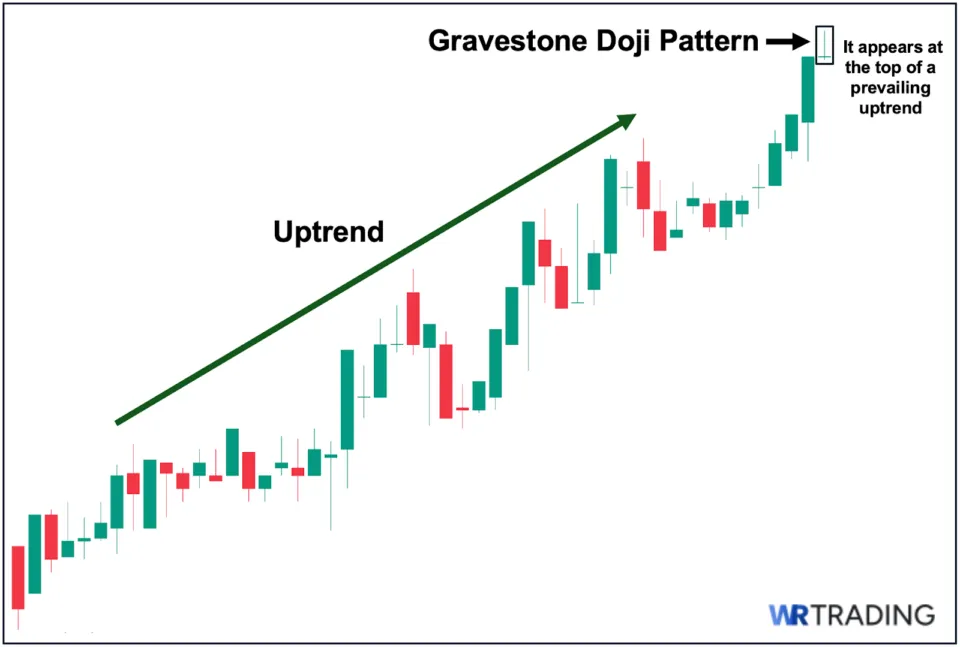
- Trend Prior to the Pattern: It must appear during a prevailing uptrend. Otherwise, it loses significance if it forms during a downtrend or a sideways (non-trending) market.
- Trend Forecast: It can be a mere pause before the uptrend continues, or a sign of growing bearish pressure at higher price levels. Moreover, it points to a potential trend reversal if followed by a confirmation candle.
- Opposite Pattern: The “dragonfly doji,” which is a doji variant with an extremely small or non-existent upper wick and a long lower wick, making it resemble the letter ”T.”
- Stop Loss Placement:
- Aggressive/Tighter Stop Loss: Just above the “confirmation candle” following the gravestone doji (we will illustrate this later)
- Conservative/Wider Stop Loss: Above the gravestone doji’s upper wick
(Learn To Trade And Read Candlestick Patterns Like A Pro)
How Does the Gravestone Doji Form?
A valid gravestone doji must form during a prevailing uptrend. When looking at the price chart, the gravestone doji forms over a single time period, represented by a single candlestick with identical or nearly identical opening and closing prices, resulting in a very thin body. During that same period, the price moved significantly higher, only to close near its opening level. This results in a long upper wick, while the price barely moves below the opening, leading to an extremely small or even non-existent lower wick.
Overall, this results in its appearance resembling an inverted letter “T” or a gravestone. Remember that the pattern must appear during uptrends. Otherwise, if it appears during a downtrend, then it simply validates the existing bearish directional bias. And if it shows up during a non-trending (sideways) period, it is also insignificant, since there is no clear market sentiment to begin with.
What Does the Gravestone Doji Pattern Mean?
The gravestone doji, being a doji variant, carries an inherently indecisive nature, as reflected by its opening and closing prices being identical or nearly identical. That said, unlike a normal doji, which is completely neutral, the gravestone doji conveys a bearish directional bias due to its distinct visual appearance: its long upper wick shows how buyers initially pushed the price upward, only for sellers to step in and drive it back down to around the opening level.
From a market psychology standpoint, this reflects a rejection of higher prices, suggesting that either buying pressure is weakening or, more significantly, selling pressure is strengthening as buyers attempt to push the price further upward. Furthermore, if the gravestone doji appears at the very top of a prevailing uptrend (reaching a new high before going back down) it may indicate that price has hit a key resistance level, where price could struggle to break above it.
Having said all this, remember that the gravestone doji is still a type of doji. Hence, it is not a decisive bearish reversal pattern on its own. In fact, as a trend reversal signal, the gravestone doji is largely unreliable without follow-up confirmation from a candle or support from another confirmation tool.
How to Identify the Gravestone Doji Pattern?
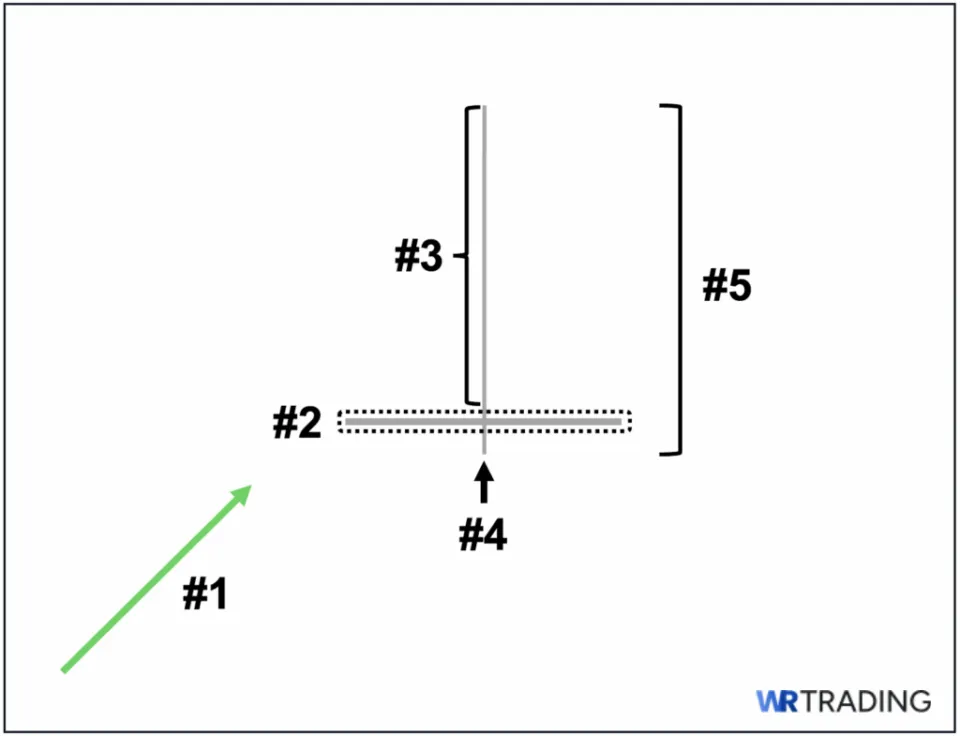
For it to be a valid and actionable candlestick pattern, it must exhibit the following five key characteristics when it forms on a price chart:
- Chart Placement: It must appear during a prevailing uptrend.
- Candle’s Body: It must be extremely slim/thin (representing the identical or nearly identical opening and closing prices).
- Candle’s Upper Wick/Shadows: It must be noticeably long
- Candle’s Lower Wick/Shadows: It must be extremely short or even non-existent
- Overall Appearance: Overall, it must look like a “gravestone” (hence the name) or an inverted letter “T.”
(Learn To Trade And Read Candlestick Patterns Like A Pro)
What is an Example of the Gravestone Doji Pattern?
Shown below is an example of a valid gravestone doji pattern and how it can be used in trading. As we can see, an established uptrend led to the appearance of the gravestone doji. The price then opened significantly higher (as evidenced by the gap up after the previous candle) and proceeded to move upward, reaching a new high for the uptrend. However, despite the initial bullish momentum, sellers eventually stepped in and drove the price back down to around the opening level, resulting in the formation of the pattern.
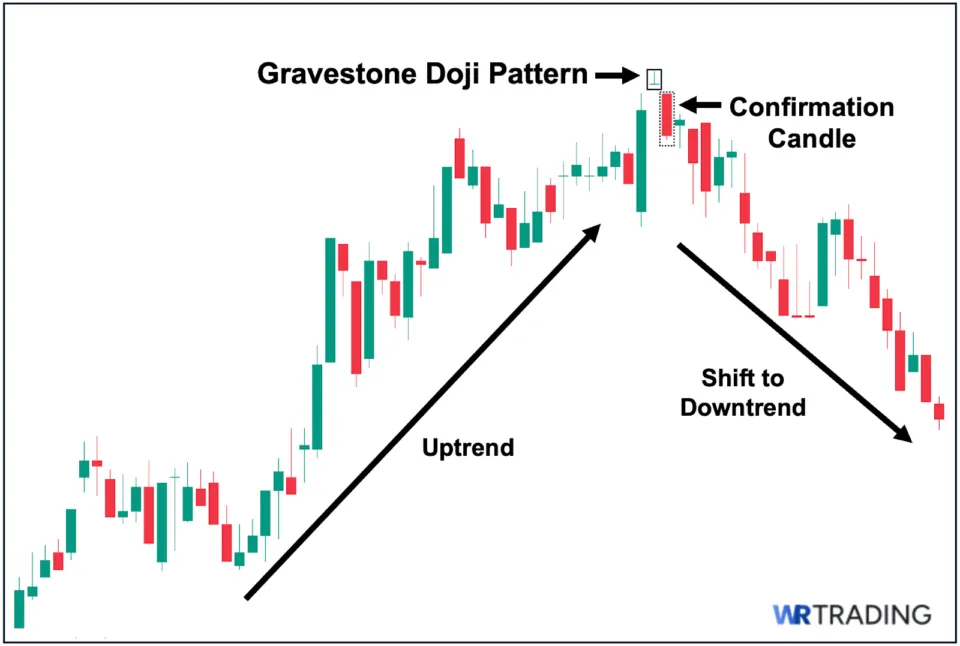
Again, while the gravestone doji conveys a bearish directional bias, its appearance alone does not decisively point to a potential trend reversal. That said, the pattern is swiftly followed by a long bearish candle that closes further below, serving as a confirmation candle that market sentiment may have indeed shifted and a trend reversal may be underway. In this case, the reversal signal materialized, as it eventually led to a downtrend.
How to Trade the Gravestone Doji Pattern: A Comprehensive Guide
Here is a simple 5-step process you can follow to start trading stocks, forex, and others using the gravestone doji pattern:
Step 1: Identify a Valid Gravestone Doji Pattern
First, it is essential to ensure that the gravestone doji pattern is valid. Remember, the pattern must appear during a prevailing uptrend (similar to the illustration above). Therefore, you should only look for this pattern on upward-moving price charts and disregard any “similar-looking” candlestick formations that appear either during a downtrend (as the trend already reflects a bearish directional bias) or in a sideways market (since there is no clear market sentiment at all).
Step 2: Wait for a Reversal Confirmation Candle to Identify Your Entry
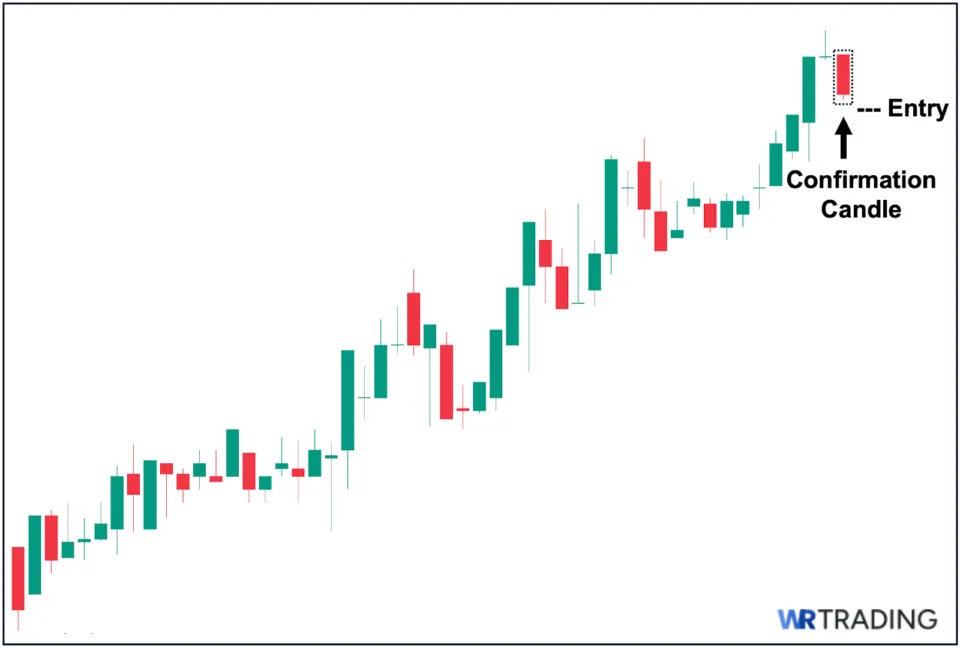
Second, if you want to use the gravestone doji as part of a reversal strategy, it is crucial to first wait for a confirmation candle to appear after the pattern. Again, the gravestone doji is not a decisive bearish reversal pattern on its own. For it to be viewed as such, the following candle must be a relatively long-bodied bearish (red) candle that decisively closes below the low of the gravestone doji, confirming a potential bearish reversal.
Remember, the gravestone doji is a doji variant, and as such, it is inherently indecisive by nature, making it unactionable (despite its bearish directional bias) when viewed on its own. This is why waiting for a confirmation candle is essential, as it helps solidify the shift in market sentiment to bearish.
That said, once a confirmation candle appears (such as shown in the image above), you then need to pinpoint your specific entry point. For your entry, we recommend either:
- Aggressive Entry – Placing your buy order at the closing price of the confirmation candle.
- Conservative Entry – Placing your buy order after the price breaks further below the low of the confirmation candle.
Step 3: Determine Your Stop Loss (SL) Level
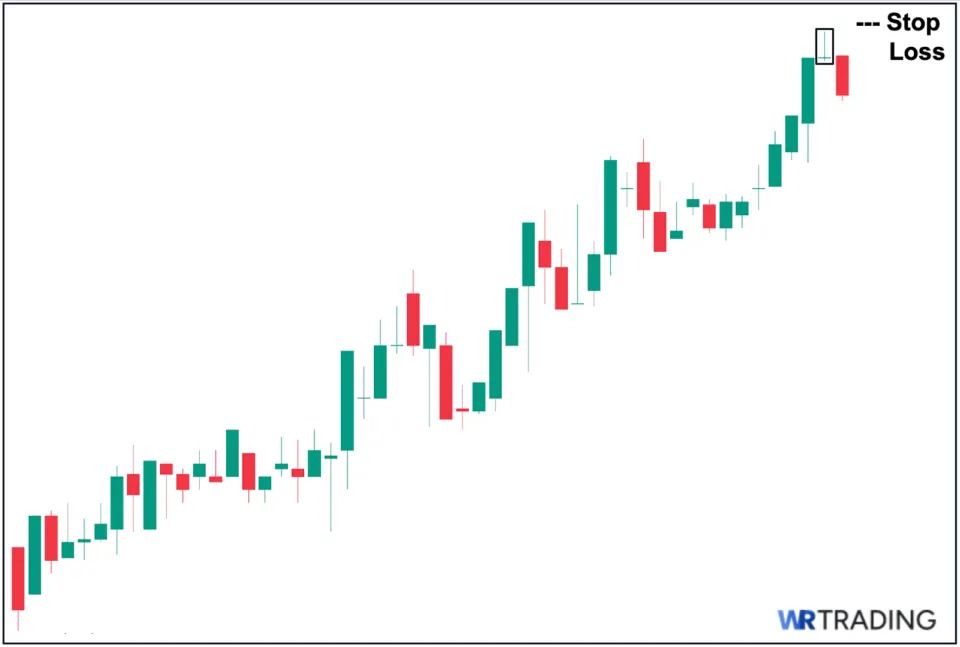
After pinpointing your entry, the third step is to then select your stop loss price level where you will exit the trade definitively if the price suddenly continues in the direction of the original trend (in this case, the uptrend). Here, you can choose either a:
- Tighter Stop Loss – Placing your stop loss just above the high of the confirmation candle.
- Wider Stop Loss – Placing your stop loss above the high of the gravestone doji.
Step 4: Set Your Target Price (TP)
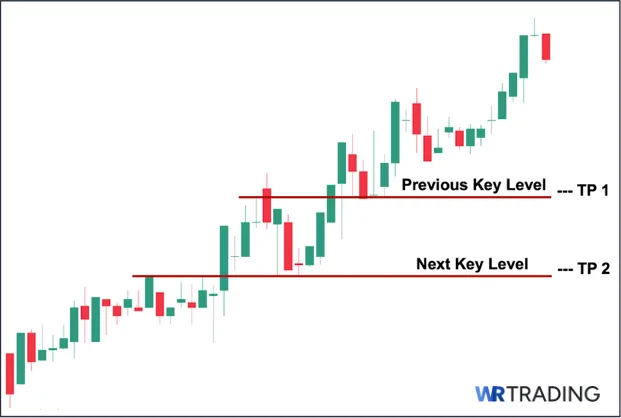
The fourth step is to clearly identify your target price/s (TPs), where you will sell your position if the price moves in your favor. In this case, if the trend reversal materializes and a downtrend eventually follows.
In this step, we recommend setting at least two target prices (also known as selling in “tranches”). Doing this will allow you to capture a bigger profit potential if the bearish move leads to a longer (more extended) downtrend. As an example, you can see in the image above that we placed two TPs around key structural levels where the price may likely face substantial buying pressure that could block further downward move.
Step 5: Open the Trade
The fifth and final step is to formally open the trade by following the first four steps: ensure the pattern is valid, select your entry point, pinpoint your stop loss, and identify your target prices. We also recommend taking only trades with a risk-reward ratio of at least 1:2, meaning the potential upside should be at least twice the potential downside. In other words, the distance from your entry to your first TP should be at least 2x as long compared to the distance from your entry to your stop loss level.
Is the Gravestone Doji Bullish or Bearish?
Unlike other more decisive candlestick patterns, the gravestone doji is not definitively bullish or bearish by nature. This is due to the fact that it is a variant of a doji, which is inherently neutral by nature. That said, due to its candlestick characteristics, it is widely considered to have a bearish directional bias if seen during a prevailing uptrend. Nevertheless, it still needs a confirmation candle or another confirmation tool to be a decisive bearish reversal signal.
(Learn To Trade And Read Candlestick Patterns Like A Pro)
What Are the Best Trading Strategies for the Gravestone Doji?
The following are three of the best trading strategies to use with the gravestone doji pattern:
1. Trading the Gravestone Doji with Moving Average
MA Settings: Simple Moving Average (MA Length: 50)
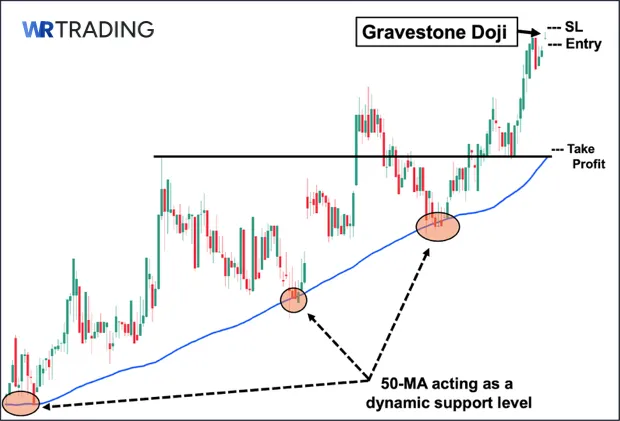
The first strategy utilizes a moving average (in this case, the 50-day simple moving average or 50 SMA) to potentially identify a dynamic support level where price may be prevented from moving further downward. As illustrated above, we can observe how the 50 SMA has acted as a support level during the prevailing uptrend, successfully holding the price from declining further.
This confirms that the 50 SMA is a significant level, and price will likely bounce upward upon touching it, as buying pressure is likely concentrated around that area. Hence, in the event that the gravestone doji does lead to a downward trajectory, we can expect the 50 SMA to act as a major barrier that will likely prevent the price from declining much further.
How to Trade (Trade Setup):
- Entry: Place your entry just below the low of the gravestone doji.
- Stop Loss: Place your stop loss just above the gravestone doji’s high.
- Take Profit: Place your TP a few ticks above the 50-MA level, as it has successfully acted as a dynamic support level and prevented the price from moving further downward.
2. Trading the Gravestone Doji with RSI
RSI Settings: Default (14 SMA, 2 Standard Deviation)
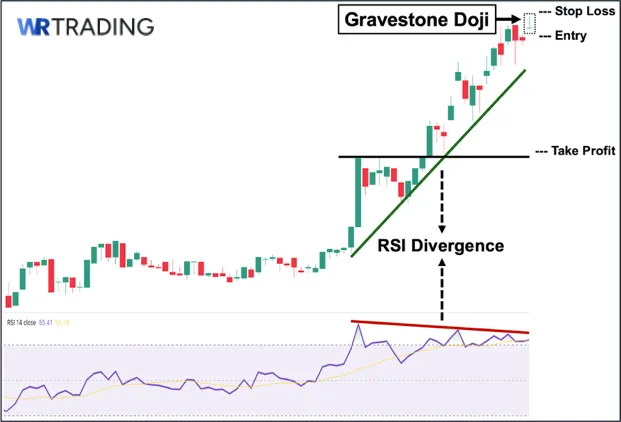
The second strategy is utilizing a combination of the gravestone doji pattern and the presence of an RSI divergence. Note that in technical analysis, an RSI divergence occurs when the RSI’s slope moves in the opposite direction of price. In this case, the price continues to move higher, forming higher highs and sloping upward, while the RSI begins to make lower highs and slope downward. When this happens, the RSI, which measures the strength and momentum of price, essentially serves as a leading indicator, signaling the upcoming end of the uptrend.
To illustrate this, we can see in the image above that while price continues to form higher highs, the RSI begins to slope downward, creating a sharp contrast or divergence. During this setup, the appearance of the gravestone doji (despite being a doji variant) essentially served as confirmation of the looming trend reversal. That said, many traders still prefer to wait for a confirmation candle before taking a short position.
How to Trade (Trade Setup):
- Entry: Place your entry just below the gravestone doji’s low (remember to wait for a confirmation candle to appear first).
- Stop Loss: Place your stop loss just above the gravestone doji’s high.
- Take Profit: Place your TP a few ticks above the nearest key structural level.
3. Trading the Gravestone Doji with Market Structure
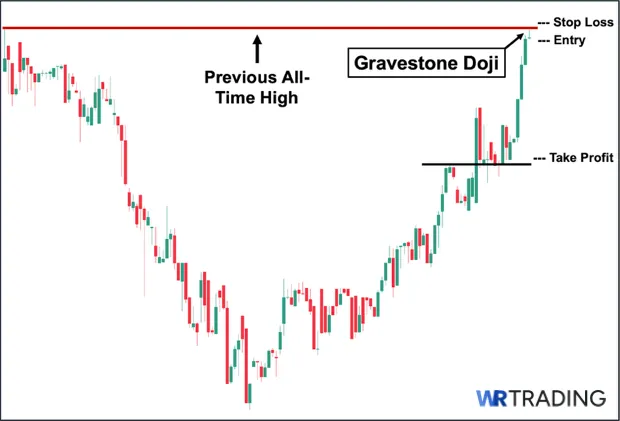
Finally, the most straightforward trading approach you can incorporate when viewing the gravestone doji is to consider it within a broader market structure. We can do this by literally zooming out to contextualize the pattern’s appearance in relation to the overall price movement. Unlike using technical indicators, this approach places great importance on historical price movements and key structural levels, something the gravestone doji aligns well with.
To illustrate, we can see above that the gravestone pattern (particularly its upper wick) hit the previous all-time high resistance level. This gives the pattern incredible significance as it visually represents the selling pressure still present around this level, suggesting that the level will continue to hold. Hence, further price advances are difficult as buyers would need to break this “ceiling.” Furthermore, the brewing selling pressure may, in fact, fuel the flame for a full-blown trend reversal.
How to Trade (Trade Setup):
- Entry: Place your entry just below the gravestone doji’s low (remember to wait for a confirmation candle to appear first).
- Stop Loss: Place your stop loss a few ticks above the previous all-time high resistance level.
- Take Profit: Place your TP a few ticks above (before) the nearest key structural level.
What is the Accuracy Rate of the Gravestone Doji?
In general, the gravestone doji, being a doji variant, should never be used in isolation, as it cannot decisively point to a shift in market sentiment or serve as a reversal pattern on its own. As such, assuming the pattern is swiftly followed by a confirmation candle signaling a potential bearish trend reversal, the general success rate of the reversal playing out is around 50–60%.
Note that this success rate can be further improved when the pattern is also supported by other complementary technical analysis tools such as the RSI, relevant moving averages, or even just volume. Remember, however, that the pattern’s success rate still largely depends on the market environment, your overall trade setup, as well as the specific asset class.
(Learn To Trade And Read Candlestick Patterns Like A Pro)
What are the Pros and Cons of the Gravestone Doji?
Pros
- Reflects clearly the intraday market dynamics
- Effective near structural resistance levels
- Serves as an early warning sign
Cons
- Not actionable on its own
- Reliant on additional confirmation
- Requires contextual skills
What are the Advantages of the Gravestone Doji Pattern?
Here are the notable advantages of using the gravestone doji as part of your trading strategy:
- It reflects clearly the intraday market dynamics: First, the gravestone doji visually provides a clear snapshot of what happened during a specific trading period. At a quick glance, we can tell that the opening and closing prices are roughly the same or even completely identical, and that buyers initially tried to push the price higher, only for sellers to step in and overwhelm them, which resulted in a noticeably long upper wick.
- Effective near structural resistance levels: Second, the gravestone doji is one of the candlestick patterns that becomes especially effective when it appears near or at historical key structural levels. For instance, if the gravestone doji’s upper wick touches a historical key resistance level, it can serve as confirmation that the resistance remains intact and may continue to prevent further price advance.
- It can serve as an early warning sign: Third, despite not being a decisive bearish reversal pattern, its bearish directional bias can still serve as an early warning sign of growing selling pressure at higher levels. This, in turn, can help traders position themselves to act based on the next candle: whether it be a confirmation candle (indicating a potential bearish reversal) or a continuation candle (indicating a continued upward move).
What are the Disadvantages of the Gravestone Doji Pattern?
Here are the key disadvantages you need to be aware of when using the gravestone doji:
- Not actionable on its own: First, as a doji variant that is inherently indecisive, the gravestone doji cannot be used effectively on its own as a decisive bearish signal. In fact, we recommend against using it as the sole basis for your trading decision, as it is highly susceptible to producing false signals if you treat its bearish directional bias as a standalone bearish reversal indicator.
- Heavily reliant on additional confirmation: Second, since it is not actionable on its own, the gravestone doji is highly reliant on an additional confirmation tool, whether in the form of a confirmation candle or a technical analysis indicator that helps confirm the shift in market sentiment to bearish. Otherwise, without such confirmation, the gravestone doji becomes unreliable.
- It requires contextual skills to maximize its value: Third, to fully maximize its value as a doji variant, the gravestone doji must be interpreted in the context of the overall market environment, key levels, and overall sentiment. Hence, this makes it less suited for total beginners, as proper interpretation requires a deeper understanding of price action.
Can the Gravestone Doji Fail?
Yes, the gravestone doji can produce false trading signals. Note that when viewed on its own, the pattern, while conveying a bearish directional bias, is not a decisive bearish reversal signal. This is due to the fact that it is still a doji variant, which is inherently indecisive. This makes it even more likely to produce a false bearish signal.
That said, if it is followed by a confirmation candle or supported by a complementary technical analysis tool, this risk is mitigated to some extent. However, just like any other candlestick pattern, even this is not 100% accurate or reliable, and it can and will still produce false signals.
What are the Alternatives to the Gravestone Doji Pattern?
Here are two potential alternatives to the gravestone doji pattern:
1. Shooting Star
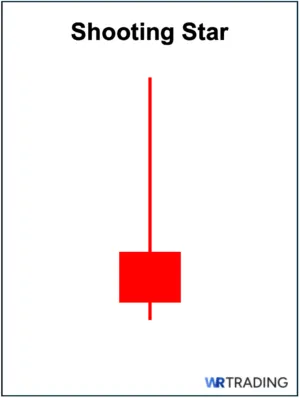
Visually, the gravestone doji and the shooting star resemble each other. That said, unlike the gravestone doji pattern, the shooting star is regarded as a standalone bearish reversal pattern that can be used decisively on its own. This is because it is not a doji. Instead, the pattern is composed of a single candle with a small real body near the low and a long upper wick. Like the gravestone doji, the shooting star’s upper wick reflects a failed attempt by buyers to sustain higher prices as sellers eventually regained control by the close.
2. Tweezer Top
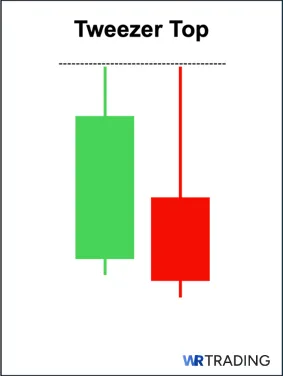
Compared to the gravestone doji, which merely suggests a bearish bias and typically requires confirmation, the tweezer top is viewed as a stronger and more decisive bearish reversal pattern that traders may act on with greater confidence. It consists of two candles with identical or nearly identical highs, highlighting a clear rejection of higher price levels.
This repeated failure to break above the same resistance area often points to a key supply zone, indicating that buyers have lost momentum while sellers are starting to regain control, especially by the close of the second candle.
Many more alternatives can be found in our WR Trading Candlestick Patterns PDF for free.
What Other Types of Dojis Exist?
Here are the other types of dojis that can appear on a price chart, and which you can use:
| Doji Type | Description |
|---|---|
| Four Price Doji | The four-price doji is a one-candle neutral pattern in which the opening, high, low, and closing prices are all identical or equal. Hence, the four-price doji appears as a thin horizontal line or a minus sign (–) on the price chart, as it has no real body and no upper or lower wicks. |
| Dragonfly Doji | The dragonfly doji looks like the capital letter “T.” The pattern has extremely small or no upper wick at all, while having a long lower wick/shadows. |
| Rickshaw Man Doji | The rickshaw man has symmetrical upper and lower wicks. That said, compared to the gravestone doji, the rickshaw man’s upper and lower wicks (or shadows) are significantly longer. |
| Long-Legged Doji | Like the rickshaw man, the long-legged doji also has long wicks/shadows on both sides. That said, one of its wicks/shadows (either upper or lower) is distinctly larger than the other. |
| High Wave Doji | A high wave doji has “exaggerated” wicks/shadows on both sides (even much bigger than long-legged or rickshaw man dojis). Hence, this makes it literally stand out on a price chart. |
| Tri-Star Doji | The tri-star doji is an incredibly rare formation consisting of 3 dojis occurring after each other. This type of doji usually appears when volatility and liquidity in a particular asset are both extremely low. |
Learn Pattern Trading with the WR Trading Mentoring
To fully maximize the value of a gravestone doji, it is crucial that the pattern be interpreted within the broader market context and key structural levels. Unfortunately, this makes it less suited for total beginners, as proper interpretation requires a more advanced understanding of price action and trading psychology. Hence, in our mentoring class at WR Trading, we explore how to use the pattern holistically alongside other technical analysis tools across various market conditions and asset classes such as stocks and crypto.
(Learn To Trade And Read Candlestick Patterns Like A Pro)
Conclusion: Gravestone Doji Is A Bearish Hint That Needs Proper Context
Overall, the gravestone doji stands out as one of the more visually striking doji variants, offering traders a clear visual snapshot of active rejection of higher price levels during a single trading period. Its long upper wick and extremely small or even non-existent body reflect the buyers’ attempt to sustain higher prices, only for sellers to step in and drive it back down to around the opening level before the session ends.
In our experience reading charts, while the gravestone doji is not a decisive bearish reversal signal on its own, its bearish directional bias is enough to serve as an early hint of diminishing bullish sentiment, as sellers begin to show their teeth. Furthermore, the pattern becomes significantly more meaningful when it appears near key historical resistance levels at the top of an established uptrend, particularly when it coincides with a confirmation from a technical analysis tool.