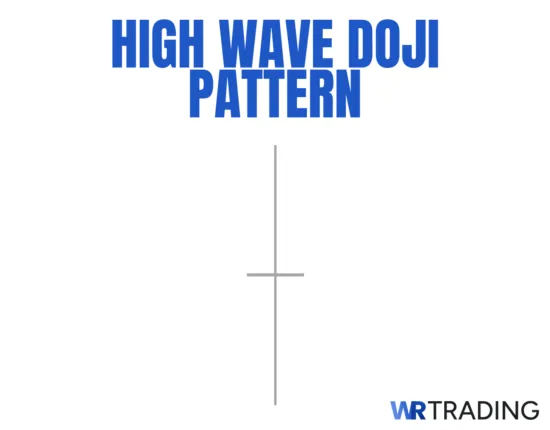
The high wave doji is a one-candle neutral pattern characterized by a slim or non-existent body with extremely long upper and lower wicks, even much longer than a long-legged doji. On a price chart, the high wave doji visually stands out the most compared to any other doji type due to the exaggerated length of its wicks.
When it appears during an ongoing trend, the pattern’s abnormally long wicks reflect a high degree of volatility during the trading session as both buyers and sellers actively try to push the price in their favor. Remarkably, despite heavy buying and selling pressure from both sides, neither side ultimately took control of the price, as it closed near (or at) its opening level. Hence, the pattern also demonstrates a sudden shift from a decisive to an indecisive market sentiment, unlike the trend’s previous dominant market conviction.
Based on our trading experience, the high wave doji typically appears during a non-trending (sideways-moving) period. In such cases, the pattern reflects a lack of interest from either party, resulting in very low levels of liquidity and few willing buyers and sellers. Hence, the bid and ask prices usually have a big discrepancy, leading to a large price movement once some traders decide to buy or sell. This is why we strongly recommend only looking for this pattern during an active trend, where there is usually a relatively high level of liquidity and the appearance of the pattern stems from buyers and sellers actively pushing the price to their respective sides.
Key Facts of The High Wave Doji Candlestick Pattern:
- Type of Pattern: Neutral/indecisive single candlestick pattern
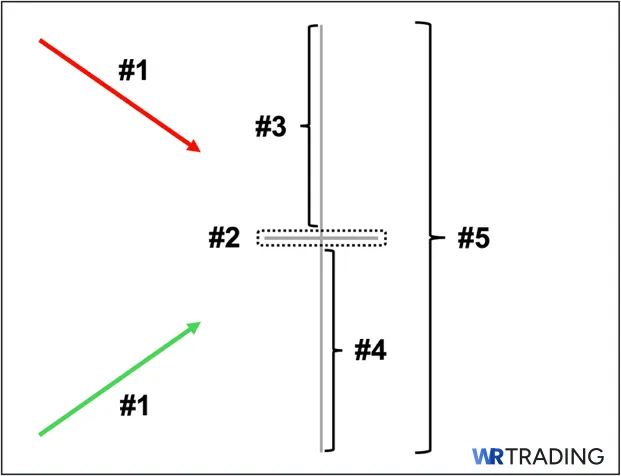
- Pattern Construction:
- Body: Must be extremely thin (visually, it looks like a small horizontal line)
- Upper Wick/Shadow: Must be extremely long, even much longer than a typical long-legged doji’s wicks.
- Lower Wick/Shadow: Similarly, it also must be extremely long, noticeably longer than a typical long-legged doji’s wicks.
- Trend Prior to the Pattern: It must appear during an active trend (either an uptrend or a downtrend). It becomes insignificant if it occurs during a sideways (non-trending) period.
- Trend Forecast: It can either be a brief point of extreme volatility before the trend resumes or a precursor to a potential trend reversal, especially if supported by a confirmation tool or followed by a confirmation candle.
- Opposite Pattern: A “Marubozu,” a long-bodied candlestick pattern with little to no wicks. Unlike the high wave doji, the marubozu reflects one-sided, decisive control of price action.
- Stop Loss Placement:
- Tighter Stop Loss: Depending on the trend, a few ticks above or below the confirmation candle following the high wave doji (we will illustrate this later)
- Wider Stop Loss: Depending on the trend, a few ticks above or below the high wave doji’s upper or lower wick
(Learn To Trade And Read Candlestick Patterns Like A Pro)
How Does the High Wave Doji Form?
A valid high wave doji must appear within an active trend (either a prevailing uptrend or an ongoing downtrend). During the session, buyers pushed the price sharply higher, creating an extremely long upper wick, while sellers dragged it significantly lower, resulting in an exaggerated lower wick.
Yet despite this intense back-and-forth, neither side managed to assert lasting control, and the price ended up closing near (or at) its opening level, hence, producing a small or virtually non-existent body. This reflects a high degree of intraday volatility with no clear directional bias. In addition, while a high wave doji can technically appear in sideways markets, it becomes insignificant in such conditions, as the prevailing sentiment is already indecisive in the first place.
What Does the High Wave Doji Pattern Mean?
Due to it being a doji variant, the high wave doji is inherently a neutral pattern. That said, unlike a standard or common doji, it reflects an unusually high level of intraday volatility, often even greater than that of a long-legged doji, which it visually dwarfs in comparison, and is typically marked by erratic price movement in both directions. The high wave doji points to the fact that both buyers and sellers were incredibly active during the session, but neither was able to establish lasting control.
From a market psychology standpoint, the high wave doji points to a session filled with elevated tug-of-war between buyers and sellers. Price moved aggressively in both directions, driven by sudden sentiment shifts, yet ultimately settled near (or at) its opening level. When this occurs during an active trend, it also introduces a high degree of doubt, as the side previously in control is now being met with significant counterpressure.
Even so, the high wave doji should not be used as a standalone reversal signal. While, yes, it raises a red flag about potential instability in the trend, decisive confirmation is still needed to validate whether the market is indeed shifting direction or simply experiencing heightened volatility within the trend.
How to Identify the High Wave Doji Pattern?
For it to be a valid high wave doji pattern, here are the key characteristics that it must possess when it forms on the price chart:
- Chart Placement: It must occur either during an uptrend or a downtrend. Note that if it appears during a non-trending (sideways-moving) period, then it essentially becomes pointless, as market sentiment is already indecisive.
- Candle’s Body: It must be extremely slim/thin (representing the identical or nearly identical opening and closing prices).
- Candle’s Upper Wick: Must be extremely long, even much longer than a typical long-legged doji’s wicks.
- Candle’s Lower Wick: Must also be extremely long, even much longer than a typical long-legged doji’s wicks. Note: The upper and lower wicks of the high wave doji are usually not the same length.
- Overall Appearance: It must have an extremely wide candle range due to its long wicks, making it literally stand out visually on a price chart (it is also very easy to spot).
What is an Example of the High Wave Doji Pattern?
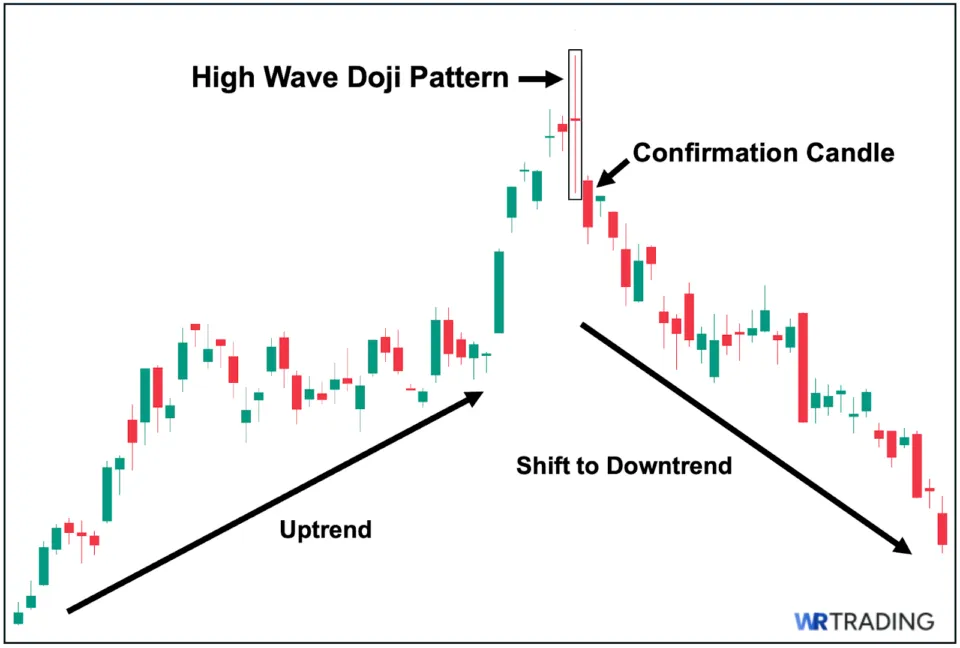
In the illustration above, we can observe an example of a high wave doji pattern on a price chart. As shown, there was a prevailing uptrend before the high wave doji formed. During the specific trading session where the pattern appeared, price initially pushed higher and even set a new all-time high within the trend. However, sellers eventually stepped in and drove the price back down.
Despite efforts from both sides, the session ended in a surprising stalemate between buyers and sellers, as the price ultimately closed near its opening level. Note that since it is a doji variant, the high wave doji cannot serve as a reliable trend reversal signal on its own. It always requires confirmation. In this case, confirmation came immediately as the next candle was a relatively long bearish candle that decisively closed below the high wave doji. This pointed to a likely bearish trend reversal, and in this case, the reversal played out as we can see a downward rally that soon followed.
(Learn To Trade And Read Candlestick Patterns Like A Pro)
How to Trade the High Wave Doji Pattern:
The following is a simple 5-step process you can follow to begin trading forex, stocks, and other assets using the high wave doji pattern:
Step 1: Identify a Valid High Wave Doji Pattern
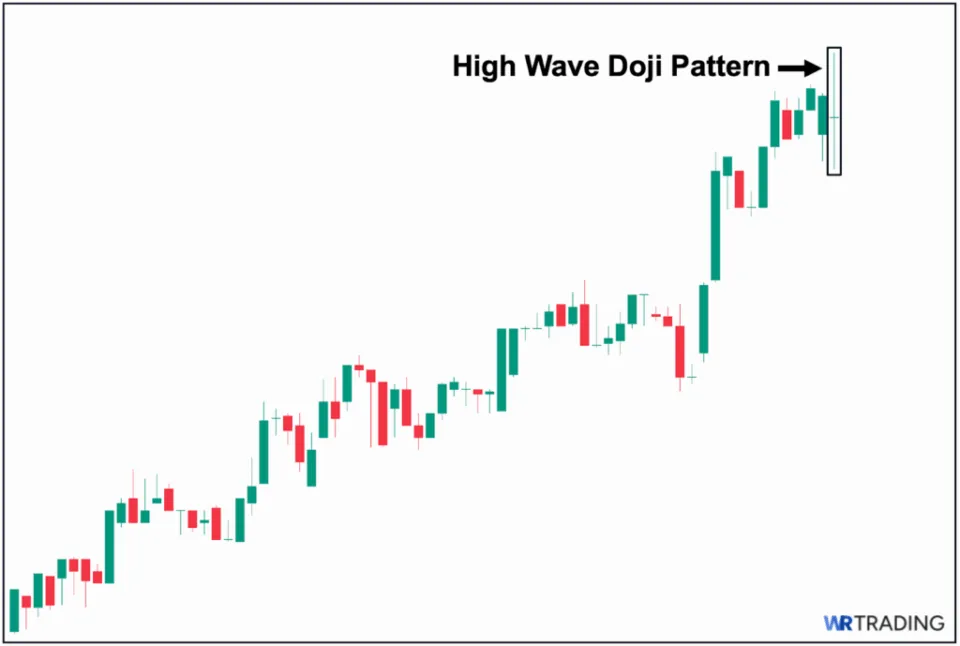
First, ensure the high wave doji emerges during an active trend (either a prevailing uptrend or an ongoing downtrend). Note that if the pattern emerges during a non-trending (sideways-moving) period, it essentially becomes purposeless, as market sentiment is already indecisive. To illustrate clearly, we can see in the illustration above a valid example of a high wave doji. As shown, the pattern appeared during an active trend, specifically in this case, at the peak of a prevailing uptrend.
Step 2: Wait for a Reversal Confirmation Candle to Identify Your Entry
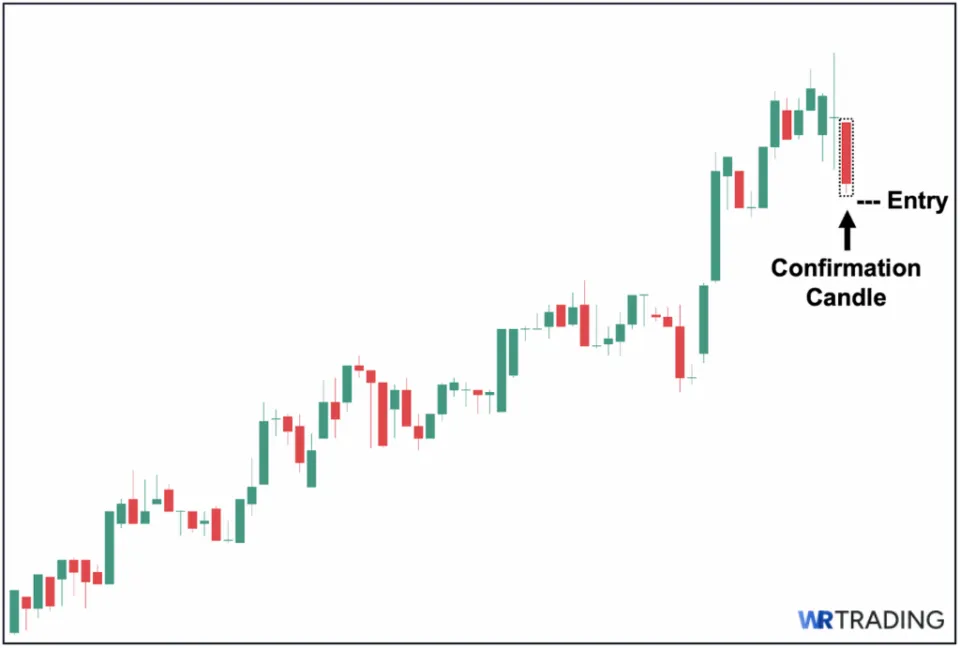
Second, if you intend to utilize the high wave doji as part of a trend reversal strategy, then it’s essential to wait for a confirmation candle to appear first. In our illustration above, since there is a prevailing uptrend, to confirm a potential shift in market sentiment, the confirmation candle must be a decisive bearish candle that closes below the low of the high wave doji pattern (the opposite applies if the active trend is a downtrend instead).
In our example above, this ideal scenario happened, as the pattern was immediately followed by a decisive bearish candle, essentially confirming the shift in market sentiment from bullish to bearish. After the appearance of a confirmation candle, you can then decide on your specific entry point.
Here, we recommend either:
- Aggressive Entry – Placing your short order at the closing price of the confirmation candle.
- Conservative Entry – Placing your short order after the price breaks further below the low of the confirmation candle (as an added layer of confidence).
Step 3: Determine Your Stop Loss (SL) Level
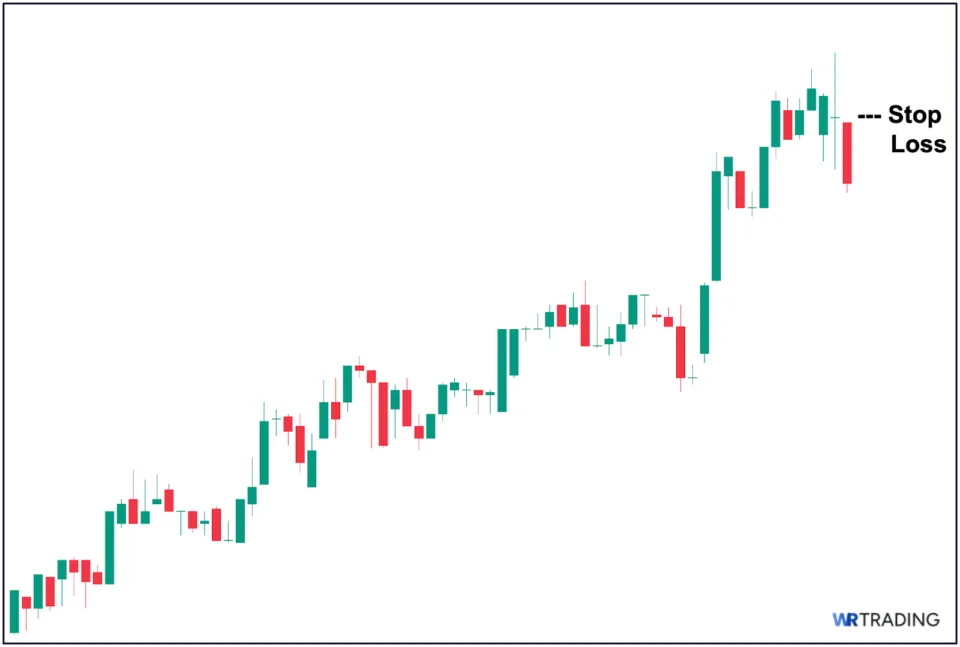
Third, after identifying your specific entry point, you then need to choose your definitive stop-loss point, where you will exit the trade (no questions asked) if it goes against your favor (in our specific example, if the uptrend continues its bullish rally instead of leading to a bearish trend reversal). For setting your stop loss, we recommend either having a:
- Tighter Stop Loss – Placing your stop loss just above the high of the confirmation candle (see the image above for illustration).
- Wider Stop Loss – Placing your stop loss just above the high wave doji’s upper wick.
Step 4: Set Your Target Price (TP)
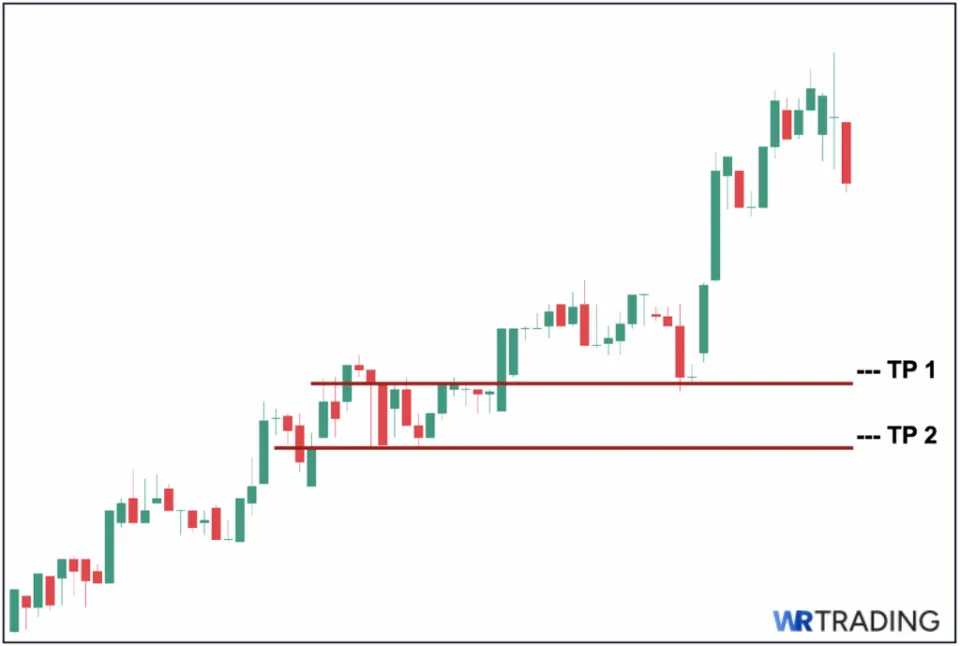
Fourth, you then need to pinpoint your target price(s) where you will put your sell orders if price moves in your favor (in our example, if the high wave doji successfully leads to a bearish trend reversal/downtrend).
In this specific step, we also recommend selling in tranches (essentially having more than one take-profit point), allowing you to capture greater profit potential if the bearish rally ever extends past your initial (first) target price. To clearly illustrate, you can observe that we placed two target prices (TPs) above.
We based these TPs on key structural levels where price may face substantial buying pressure that could halt further downward move.
Step 5: Open the Trade
The fifth and final step is to officially open the trade by thoroughly following the first four steps we outlined: First, ensure the pattern is valid. Second, pinpoint your specific entry point. Third, clearly identify your definitive stop-loss level. And fourth, choose your target price (TP) levels.
Furthermore, we strongly advise taking trades only when there is at least a minimum 1:2 risk-reward ratio (in other words, the potential upside must be at least twice the potential downside). In other words, the distance from your entry to your first TP must be at least twice as long versus the distance from your entry to your stop-loss point.
Is the High Wave Doji Bullish or Bearish?
By nature, the high wave doji is a neutral pattern with no clear bullish or bearish directional bias. What sets it apart, however, is its exaggerated long wicks, which indicate an elevated degree of intraday volatility and sharp price swings in both directions (up and down). This typically indicates a session characterized by heightened uncertainty, where both buyers and sellers attempted to exert control over the price but ultimately failed to do so. As such, the pattern is best interpreted as a mere indication of market instability or hesitation and generally requires confirmation before it can be considered a valid counter-trend signal.
(Learn To Trade And Read Candlestick Patterns Like A Pro)
What Are the Best Trading Strategies for the High Wave Doji?
Here are three of the best trading strategies to utilize alongside the high wave doji pattern:
1. Trading the High Wave Doji with RSI
RSI Settings: Default (14 SMA, 2 Standard Deviation)
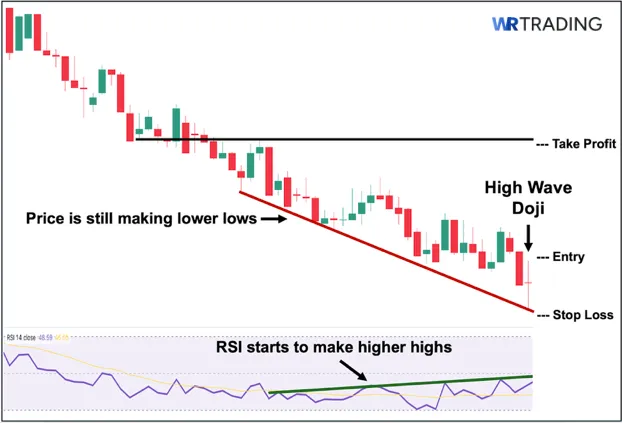
First, you can incorporate the appearance of the high wave doji with the presence of an RSI divergence. An RSI divergence happens when the RSI’s trendline moves in the opposite direction of the price. In technical analysis, the presence of an RSI divergence is viewed as one of the most reliable trend reversal signals. This is due to the fact that, compared with other technical indicators, RSI divergence is widely regarded to be a “leading” indicator whenever it appears on a chart.
To illustrate this, we can observe in the image above that while price continues to make lower lows, the RSI has begun forming higher highs, creating a clear divergence as the two move in opposite directions. In this specific case, the appearance of a high wave doji can act as confirmation of a potential bullish trend reversal, as the pattern introduces heightened uncertainty about the strength of the ongoing downtrend and suggests that selling momentum may be fading and that market sentiment could be starting to shift.
How to Trade (Trade Setup):
- Entry: Place your entry just above the high wave doji’s high (remember, wait for a confirmation candle to first appear).
- Stop Loss: Place your stop loss just below the high wave doji’s low.
- Take Profit: Place your first TP a few ticks below (before) the nearest key structural resistance level.
2. Trading the High Wave Doji with Moving Average
MA Settings: Simple Moving Average (MA Length: 20)
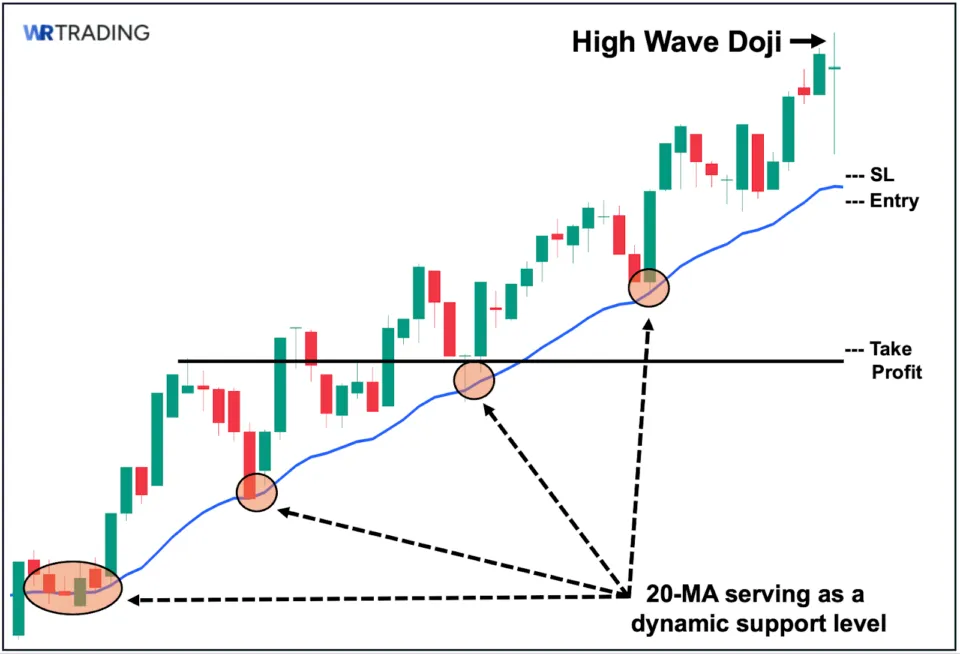
Second, you can also use a simple moving average, such as the 20-day moving average we use for this example, to determine potential dynamic support levels (in uptrends) or dynamic resistance levels (in downtrends), where price may have difficulty breaking through. For instance, in our example above, we can observe a prevailing uptrend. For the high wave doji to lead to a valid trend reversal using a moving average, the price must first decisively close below the 20-day moving average.
That said, that would not be an easy ask. As we can see, the 20-MA has consistently acted as a strong support level in the past, successfully holding off any prior attempts at a bearish trend reversal. Because of this, we can conclude that the 20-MA is indeed a key level that needs to be broken convincingly first before a potential trend reversal can be confirmed. Hence, when the high wave doji appeared, although it signals a high degree of indecision, it is still best to first wait until the price breaks below the 20-MA before considering placing a short order.
As a matter of fact, even if a confirmation candle (in this case, a decisive bearish candle closing further below) follows the pattern, we still recommend waiting until the price decisively closes below the 20-MA. Otherwise, the moving average may simply invalidate the entire setup, as it has proven to be a key support level.
How to Trade (Trade Setup):
- Entry: Place your entry just below the 20 MA line. Remember that the price needs to break this key support level first to confirm a potential bearish trend reversal.
- Stop Loss: Assuming price successfully closes below the 20 MA line, place your stop loss just above this line, as a move back above the 20 MA would essentially invalidate the trend reversal attempt.
- Take Profit: Place your TP a few ticks just above (before) the nearest key structural support level.
3. Trading the High Wave Doji with Market Structure
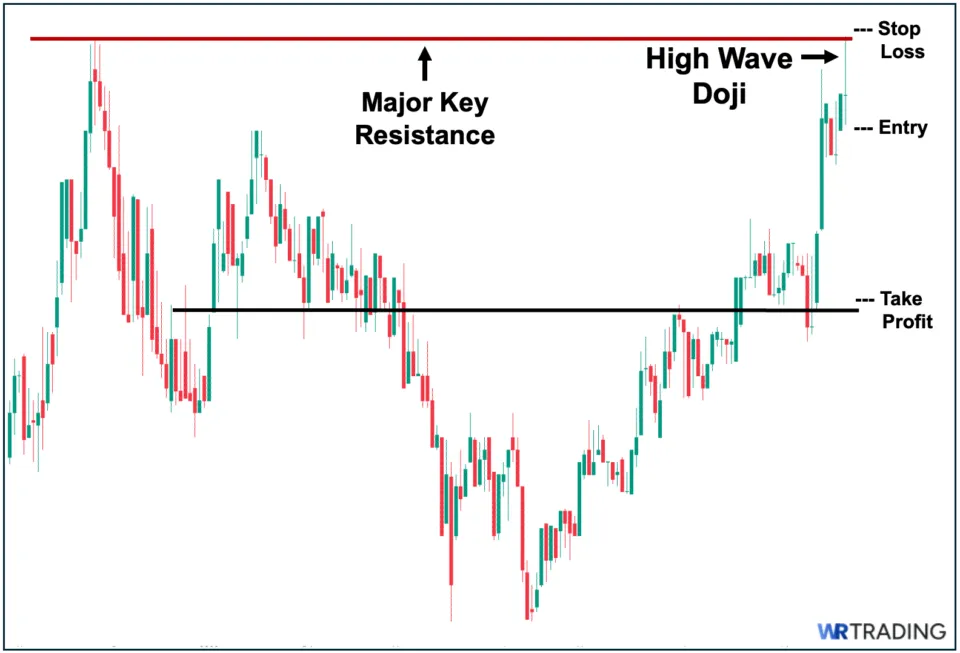
Third, you can also simply employ the most fundamental approach in technical analysis, which is considering the overall structural context in which the pattern emerges. You can simply do this by literally zooming out the price chart and contextualizing the appearance of the high wave doji against the overall market structure. Compared with other technical indicators, market structure is unique as it presents a “raw” view of historical key structural price levels that you can review.
To illustrate plainly, when we zoom out the price chart, we can observe in the example above that the upper wick of the high wave doji touches a major key resistance level. We can also see that when price reached this level in the past, it failed to break through and instead triggered selling pressure that pushed price downward. With this market context in mind, we can reasonably expect price to bounce down from this “ceiling” rather than successfully break above it.
How to Trade (Trade Setup):
- Entry: Place your entry just below the high wave doji’s low (remember to wait first for a confirmation candle to appear).
- Stop Loss: Place your stop loss a few ticks above the major key resistance level. In this case, the previous all-time high that acted as a ceiling, preventing the price from breaking past it.
- Take Profit: Place your TP a few ticks just above (before) the nearest key structural support level.
(Learn To Trade And Read Candlestick Patterns Like A Pro)
What is the Success Rate of the High Wave Doji?
As a best practice, the high wave doji should never be relied on by itself, as it offers no clear bullish or bearish bias and may simply reflect a volatile session with no directional conviction. However, if it’s followed by a strong confirmation candle pointing to a possible reversal, the likelihood of that reversal materializing tends to fall within the 50–60% range.
That probability can improve when the high wave doji forms near a key level and aligns with other supporting indicators,such as RSI divergence or a significant moving average. Even so, the pattern’s reliability remains highly dependent on the asset you’re trading, the surrounding market conditions, and how well it fits into your overall trading plan.
What are the Pros and Cons of the High Wave Doji?
Here are the key pros and cons of using the high wave doji pattern:
Pros
- Visually distinctive
- Often shows up ahead of a major price shift
- Serves as a volatility barometer
Cons
- May not offer a viable risk-reward setup
- No clear-cut rule for wick size
- Unwise to trade in isolation (without confirmation)
What are the Advantages of the High Wave Doji Pattern?
Here are the notable advantages of using the high wave doji as part of your trading strategy:
- Visually distinctive and easy to spot: First, the high wave doji is incredibly easy to spot on a price chart due to its extremely long upper and lower wicks, which make it quite literally stand out by occupying a large price zone. Its exaggerated structure immediately draws attention.
- Often shows up ahead of a major price shift: Second, due to the very nature of the high wave doji reflecting an exceptional level of volatility, the pattern often precedes a major price move in either direction (whether it’s a continuation of the existing trend or a reversal against it), giving traders an opportunity to prepare for a potential momentum-based play
- Serves as a volatility barometer: Third, the high wave doji can act as a barometer of volatility just by simply looking at how big its candle range is (the distance between its high and low prices). This makes the pattern especially useful for identifying highly unstable and emotion-driven price action.
What are the Disadvantages of the High Wave Doji Pattern?
Here are the key disadvantages you need to be aware of when using the high wave doji:
- May not offer a viable risk-reward setup: First, due to its inherent characteristic of having extremely long wicks, the high wave doji often results in an unfavorable risk-reward setup, especially when your entry is placed after a confirmation candle and your stop-loss is positioned beyond the opposite wick. The wide candle range can create a large risk exposure relative to the potential reward, making it difficult to structure efficient trade parameters, especially compared to other doji variants.
- No clear-cut rule for wick size: Second, there is no universally accepted wick length that defines a high wave doji, only that it is “extremely long.” Due to this lack of standardization, it can lead to inconsistent interpretations and varying levels of significance depending on the specific trader or market.
- Unwise to trade in isolation and without confirmation: Third, the high wave doji should never be evaluated in isolation as it is highly unreliable when viewed as a standalone reversal signal. As a doji variant, it still merely signals indecision despite the elevated volatility. For this reason, it is still wise to first wait for either a clear confirmation candle or a viable supporting technical confirmation signal, before considering any entry.
Can the High Wave Doji Produce False Signals?
Yes, the high wave doji, like any other candlestick pattern, is not immune to producing false signals. In fact, when viewed in isolation and without the support of a confirmation candle or any complementary technical tool, it is perhaps one of the most indecisive and unreliable patterns and hence, should not be treated as a standalone trend reversal signal at all. Furthermore, even when supported by confirmation (whether through a follow-up candle or other technical indicators), the pattern can still fail, as no candlestick formation is ever 100% accurate.
(Learn To Trade And Read Candlestick Patterns Like A Pro)
What are the Alternatives to the High Wave Doji Pattern?
The following are two potential alternatives to the high wave doji pattern:
1. Long-Legged Doji
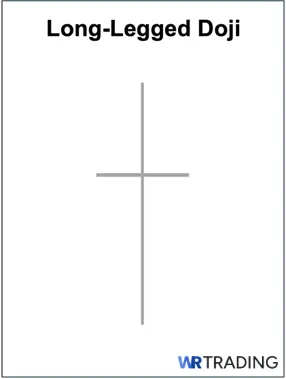
The long-legged doji is one of the most common variants of a doji. Visually, it has relatively long upper and lower wicks compared to a standard or common doji, which typically features short wicks. That said, it still pales in comparison to the high wave doji’s extremely long wicks, which even dwarf those of a long-legged doji. The long-legged doji, however, is considered a more actionable pattern, as it appears more frequently and can therefore be used more often than the high wave doji.
2. Rickshaw Man Doji
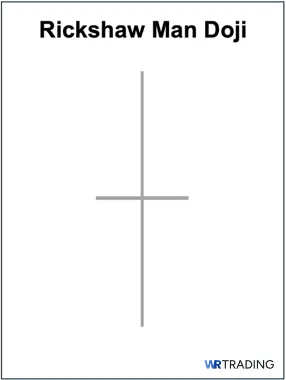
The rickshaw man doji is technically a more specific subvariant of the long-legged doji. In fact, it shares all the same defining features except one: its upper and lower wicks are similarly sized or perfectly symmetrical in length. This makes it resemble a perfectly centered cross. Note that this symmetry is not required for standard long-legged dojis, which often have wicks of noticeably uneven length.
Furthermore, while both the long-legged doji and rickshaw man similarly reflect high volatility during the trading period, the rickshaw man indicates complete market equilibrium, as both buyers and sellers pushed the price in similar ranges but ultimately settled at the midpoint, showing no clear directional bias.
What Other Types of Dojis Exist?
Aside from the high wave doji, here are the other types of doji patterns that you will see on a price chart:
| Doji Type | Description |
|---|---|
| Four Price Doji | Third, the four-price doji is a unique type of doji in which the opening, high, low, and closing prices are all identical. Hence, it appears as a thin horizontal line or a minus sign (–) on the price chart, as it has no real body and no upper or lower wicks. |
| Dragonfly Doji | Fourth, the dragonfly doji essentially looks like the capital letter “T” because it has an extremely small or no upper wick at all, while featuring a relatively long lower wick. |
| Gravestone Doji | Fifth, the gravestone doji is the complete opposite of the dragonfly doji and resembles an inverted capital letter “T.” The pattern features a long upper wick or shadow, accompanied by an extremely small or nonexistent lower wick or shadow. |
| Tri-Star Doji | Sixth, the tri-star doji is an incredibly rare formation consisting of 3 dojis occurring consecutively. This type of doji usually appears when both volatility and liquidity in a particular asset are extremely low. |
Learn Pattern Trading with the WR Trading Mentoring
As we have extensively covered, the high wave doji, both visually and structurally, stands out among other doji types because of its exaggerated wicks that represent a period of extreme volatility, which ultimately resulted in a surprising stalemate between buyers and sellers. In our mentoring session at WR Trading, we go further by highlighting how the pattern can be applied in more nuanced trading scenarios as well as demonstrating advanced applications across various asset classes, including forex, stocks, and indices.
(Learn To Trade And Read Candlestick Patterns Like A Pro)
High Wave Doji: Extreme Volatility Without Resolution
Overall, the high wave doji is arguably the most distinctive doji type when seen on a price chart due to its sheer size, and is undoubtedly one of the most intense visual representations of market indecision. Its extremely long wicks (both upper and lower) suggest aggressive but uncoordinated attempts by buyers and sellers to push price in their direction. Yet despite the intensity of these moves, the candle closes near (or at) its opening level, indicating that neither side was able to sustain control and establish clear conviction by the end of the session.
Based on our experience, a valid high wave doji, which occurs during either an uptrend or a downtrend, tends to emerge in erratic or parabolic market phases, where sharp intraday swings are likely. While the pattern itself remains neutral and indecisive (as it is technically a type of doji), its appearance, even when viewed in isolation, can still be valuable, as it reflects extreme volatility, pointing to a likely significant follow-up move in either direction.