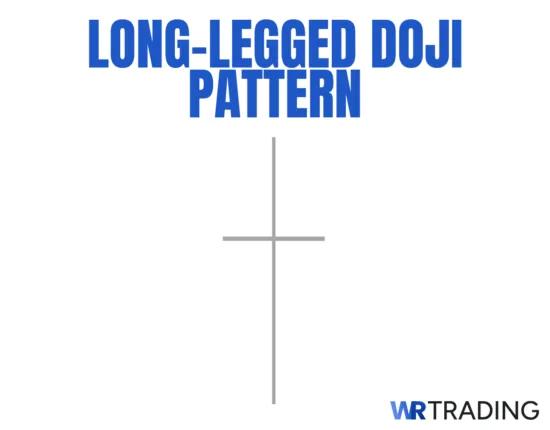
The long-legged doji is a one-candle neutral pattern characterized by an extremely slim or non-existent body, and upper and lower wicks that are noticeably longer than those of a standard or common doji. The pattern’s wide candle range (the distance between the pattern’s high and low) reflects higher-than-normal volatility during that specific trading session and suggests an active tug-of-war between buyers and sellers, with neither side gaining clear control of price action in the end. Also, it represents a point of market indecision within the trend, which may simply be a pause before the original trend continues or serve as a precursor to a potential trend reversal, if it is supported by a confirmation tool or followed immediately by a confirmation candle.
From our trading experience, we strongly recommend against using the pattern in isolation, as it is highly unreliable and, being a doji variant, incredibly indecisive without the presence of a confirmation tool or a decisive confirmation candle that follows it. Many advanced-level traders also prefer to use the long-legged doji as a gauge of current market interest and volatility, as the pattern is often followed by a sharp move in either direction.
Key Facts of The Long-Legged Doji Candlestick Pattern:
- Type of Pattern: Neutral/indecisive single candlestick pattern
- Pattern Construction:
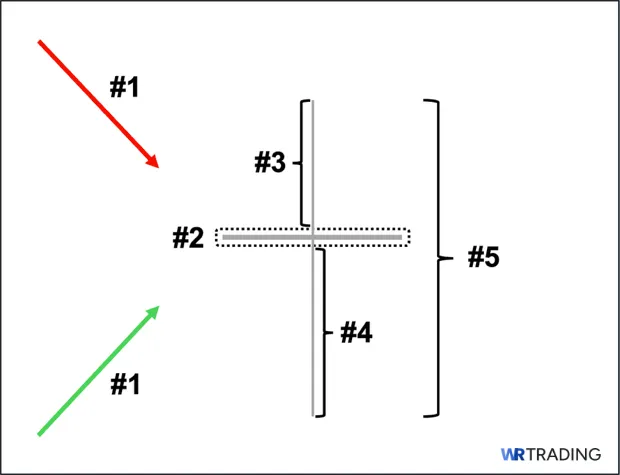
- Body: Must be extremely thin (visually, it looks like a small horizontal line)
- Upper Wick/Shadow: Must be relatively long, though it’s usually not exactly the same length as the lower wick (it may be longer or shorter).
- Lower Wick/Shadow: Must be relatively long, though it’s also usually not exactly the same length as the upper wick (it may be longer or shorter).
- Trend Prior to the Pattern: It must appear during an active trend (either an uptrend or a downtrend). It becomes insignificant if it occurs during a sideways (non-trending) period.
- Trend Forecast: It can simply be a “pause” before the trend continues or a precursor to a potential trend reversal, especially if supported by a confirmation tool or followed by a confirmation candle.
- Opposite Pattern: A “Marubozu,” a long-bodied candlestick pattern with little to no wicks. The pattern reflects decisive, one-sided control of price action.
- Stop Loss Placement:
- Aggressive/Tighter Stop Loss: Depending on the trend, a few ticks above or below the confirmation candle following the long-legged doji (we will illustrate this later)
- Conservative/Wider Stop Loss: Depending on the trend, a few ticks above or below the long-legged doji’s upper or lower wick
(Learn To Trade And Read Candlestick Patterns Like A Pro)
How Does the Long-Legged Doji Form?
A valid long-legged doji must form during an active trend (either an uptrend or a downtrend). During the session, buyers attempted to push the price significantly higher, resulting in a relatively long upper wick, while sellers also tried to drive it significantly lower, forming a relatively long lower wick.
However, in the end, neither buyers nor sellers prevailed, and the price closed near (or at) its opening level, resulting in a slim or virtually non-existent body and reflecting the fact that neither party decisively took control of price action. Note also that while long-legged doji can appear during non-trending (sideways) periods, it is not particularly useful or meaningful, as the ongoing market sentiment is already indecisive since there is no trend to begin with.
What Does the Long-Legged Doji Pattern Mean?
Because of its structure, the long-legged doji is an inherently neutral or indecisive pattern. However, compared to a common or standard doji, the long-legged doji reflects higher-than-normal volatility during a specific trading session and suggests an active tug-of-war between buyers and sellers. In contrast, a common or standard doji may simply be a result of a lack of interest or participation from both sides.
From a market psychology standpoint, the long-legged doji reflects elevated interest from both buyers and sellers, as price actively moved throughout the trading session. However, despite efforts from both sides, neither party succeeded in pushing the price in their favor. This raises concern when it appears during an established trend, since you would normally expect one side to be in clear control.
But in this case, the counterparty pushed back and challenged that control.
In fact, even if a confirmation candle follows the pattern, as long as the price does not break the 20-MA, we still advise waiting for the price to eventually break past the 20-MA before taking action, as the 20-MA can simply invalidate the setup.
How to Identify the Long-Legged Doji Pattern?
For it to be a valid long-legged doji pattern, here are the key characteristics that it must possess when it forms on the price chart:
- Chart Placement: It must occur either during an uptrend or a downtrend. Note that if it appears during a non-trending (sideways-moving) period, then it essentially becomes pointless, as market sentiment is already indecisive.
- Candle’s Body: It must be extremely slim/thin (representing the identical or nearly identical opening and closing prices).
- Candle’s Upper Wick: Must be relatively long, though it’s usually not exactly the same length as the lower wick (it may be slightly longer or slightly shorter).
- Candle’s Lower Wick: Must be relatively long, though it’s usually not exactly the same length as the upper wick (it may be slightly longer or slightly shorter).
- Overall Appearance: It must have a wide candle range and resemble a “cross” or a stretched-out “plus sign,” with both the upper and lower wicks noticeably longer than those of a standard or common doji.
(Learn To Trade And Read Candlestick Patterns Like A Pro)
What is an Example of the Long-Legged Doji Pattern?
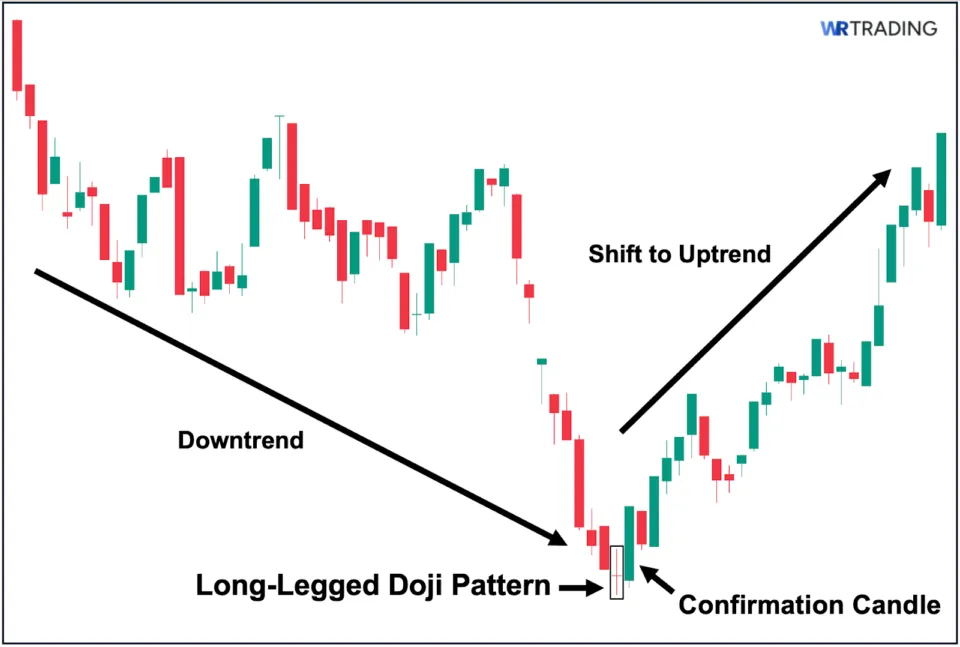
In the image above, we can see an example of a long-legged doji pattern on a price chart. As observed, there was an ongoing downtrend prior to the appearance of the long-legged doji. During the trading session where the pattern appeared, the price initially attempted to move lower, even creating a new all-time low. However, despite the early selling pressure, buyers eventually stepped in and pushed the price upward.
Ultimately, this tug-of-war between the two parties ended in a stalemate, with the price closing near its opening level. However, being a doji, the pattern alone is not a valid trend reversal signal on its own. Hence, it needs confirmation, and in this case, confirmation came immediately as the next candle was a long-bodied bullish candle that decisively closed above the long-legged doji. This points to a likely trend reversal, and indeed, the reversal played out as we can see a bullish rally soon followed.
How to Trade the Long-Legged Doji Pattern: A Comprehensive Guide
The following is a simple 5-step process you can follow to begin trading forex, stocks, and other assets using the long-legged doji pattern:
Step 1: Identify a Valid Long-Legged Doji Pattern
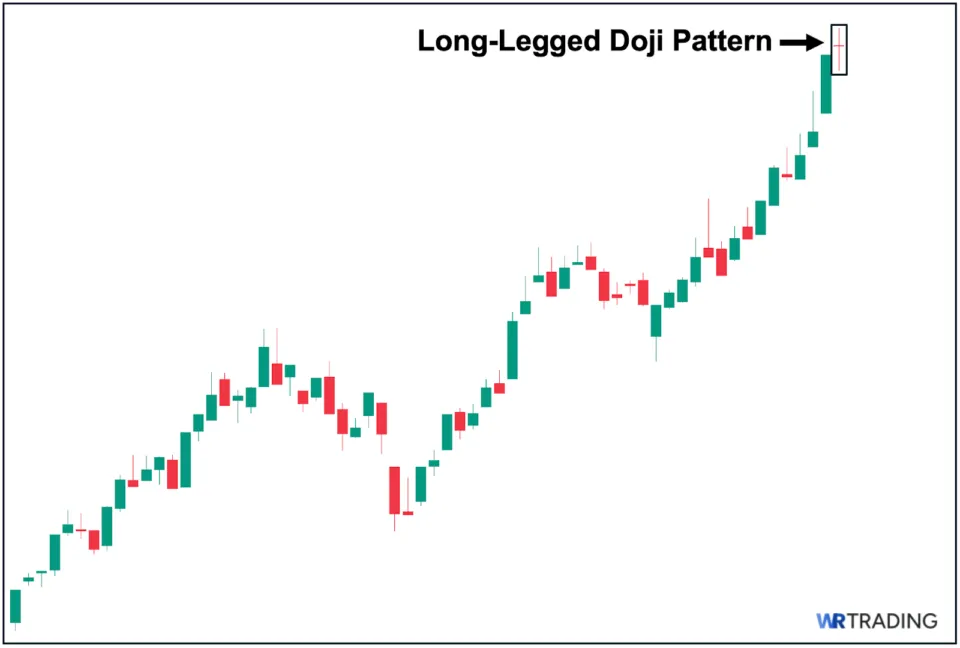
The first step is to make sure the long-legged doji appears during an active trend (either an uptrend or a downtrend). Note that if the pattern appears during a non-trending (sideways moving) period, it becomes meaningless, as market sentiment is already indecisive. To illustrate, we can see in the image above a valid example of a long-legged doji. As shown, the pattern emerged during an active trend, specifically at the peak of an ongoing uptrend.
Step 2: Wait for a Reversal Confirmation Candle to Identify Your Entry
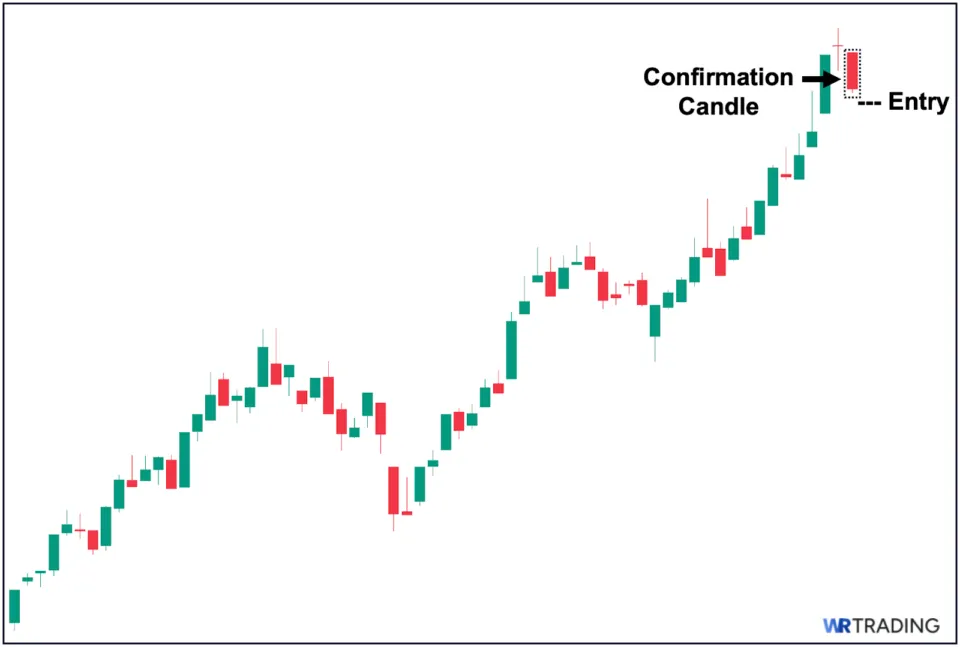
Second, if you plan on using the long-legged doji as part of a reversal strategy, then it’s crucial to wait for a confirmation candle to first appear. In our illustration above, since the active trend is an uptrend, the confirmation candle must be a decisive bearish candle that closes below the low of the long-legged pattern (the opposite applies if the active trend is a downtrend).
In this case, that ideal scenario occurred, as the pattern was immediately followed by such a candle. Afterward, you can then decide on your specific entry point. Here, we recommend either:
- Aggressive Entry – Placing your short order at the closing price of the confirmation candle.
- Conservative Entry – Placing your short order after the price breaks further below the low of the confirmation candle (as an added layer of confidence).
(Learn To Trade And Read Candlestick Patterns Like A Pro)
Step 3: Determine Your Stop Loss (SL) Level
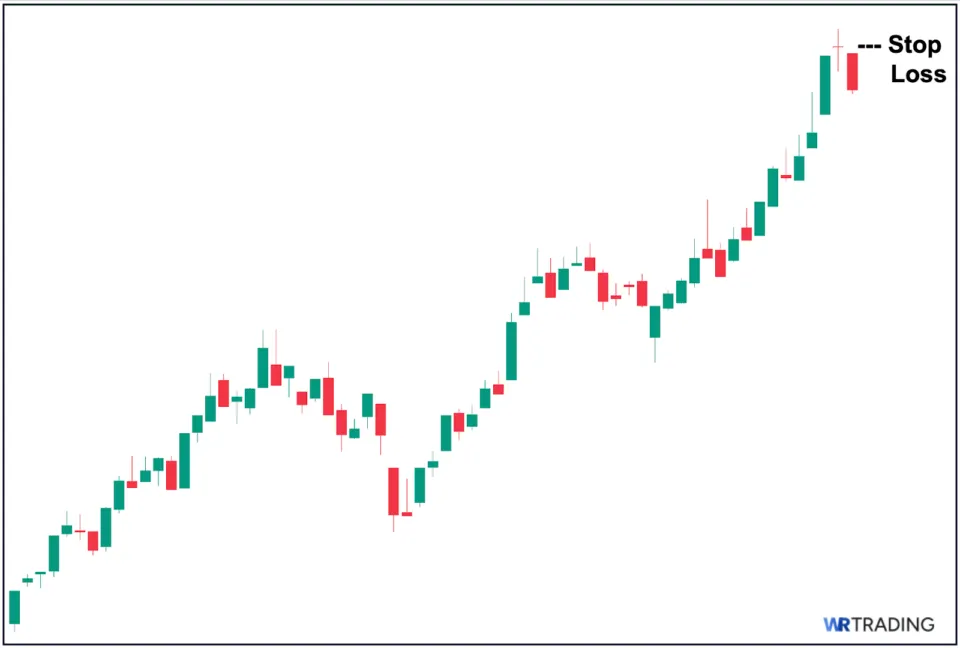
Third, after pinpointing your entry, you must then choose your stop-loss point, where you will exit the trade if it goes against your favor (in this example, if the uptrend continues instead of leading to a trend reversal). For placing your stop loss, we recommend either having a:
- Tighter Stop Loss – Placing your stop loss just above the high of the confirmation candle (see the image above for illustration).
- Wider Stop Loss – Placing your stop loss just above the long-legged doji’s upper wick.
Step 4: Set Your Target Price (TP)
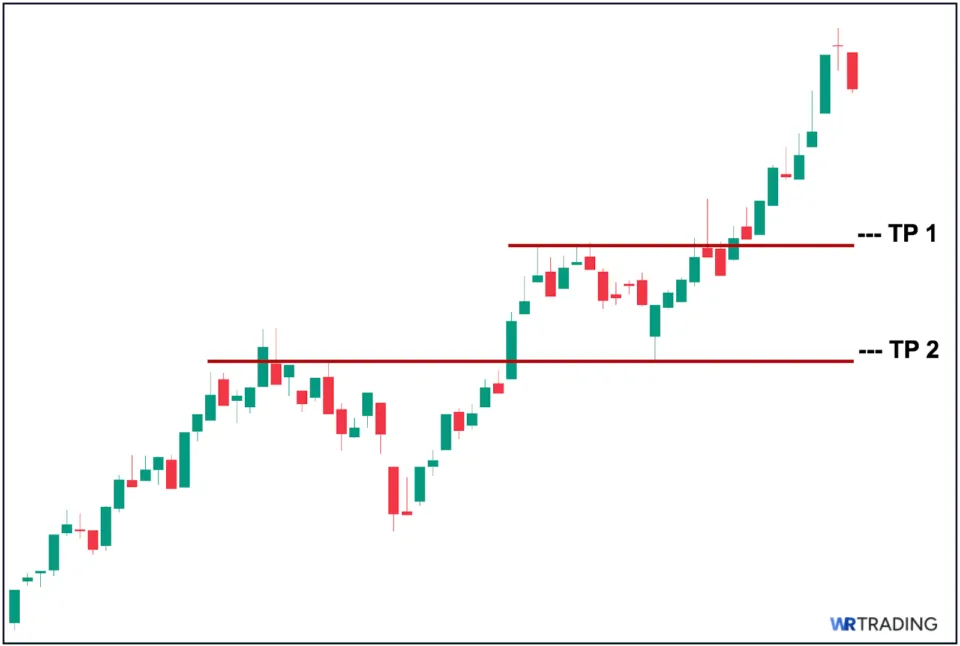
Fourth, you then must identify your target price/s where you will place your sell orders if price moves in your favor (in this example, if the long-legged doji leads to a bearish trend reversal).
In this step, we recommend selling in tranches, so you have the opportunity to capture greater profit potential if the bearish rally extends beyond your initial target price. To illustrate, you can observe that we placed two target prices (TPs) above. We based these TPs on key structural levels where price may encounter significant buying pressure, which could prevent further downward movement.
Step 5: Open the Trade
The fifth and last step is to formally open the trade by simply following the first four steps we mentioned: First, make sure the pattern is valid. Second, pinpoint your entry point. Third, identify your definitive stop-loss level. And fourth, select your target price (TP) levels.
Furthermore, we strongly advise taking trades only when there is at least a 1:2 risk-reward ratio, meaning the potential upside must be at least twice the potential downside. In other words, the distance from your entry to your first TP should be at least twice as long compared with the distance from your entry to your definite stop-loss point.
Is the Long-Legged Doji Bullish or Bearish?
By nature, the long-legged doji is viewed as overwhelmingly neutral or indecisive, and is neither decisively bullish nor bearish. That said, its relatively long upper and lower wicks reflect higher-than-normal volatility during that specific trading session and could suggest a tug-of-war between buyers and sellers, with neither side gaining clear control. Hence, the pattern is interpreted as a sign of market indecision and essentially requires confirmation before it can be considered a meaningful counter-trend signal.
(Learn To Trade And Read Candlestick Patterns Like A Pro)
What Are the Best Trading Strategies for the Long-Legged Doji?
Here are three of the best trading strategies to utilize alongside the long-legged doji pattern:
1. Trading the Long-Legged Doji with RSI
RSI Settings: Default (14 SMA, 2 Standard Deviation)
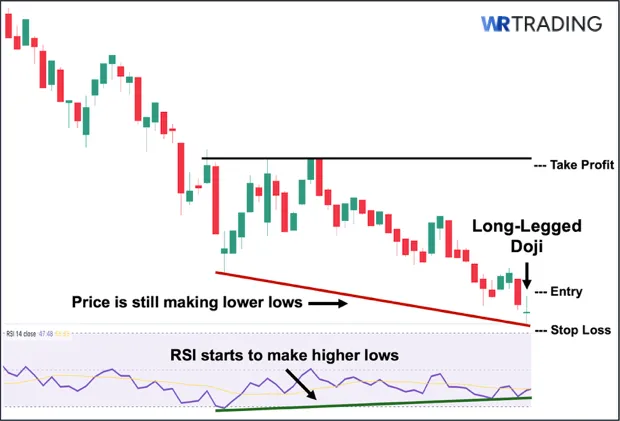
First, you can combine the appearance of the long-legged doji with the potential presence of RSI divergence. An RSI divergence occurs when the RSI’s trendline moves in the opposite direction of the price. In technical analysis, the presence of an RSI divergence is regarded as one of the most reliable reversal signals. This is because, compared with other technical indicators, RSI divergence is widely considered to be a “leading” indicator whenever it appears on a chart.
To illustrate, we can observe in the image above that while price is still making lower lows, the RSI has started to form higher lows, creating a distinct divergence. In this case, the appearance of the long-legged doji confirms the possibility of a looming trend reversal, as the pattern fuels uncertainty and doubt about the ongoing downtrend. This is due to the divergence, which suggests that sellers may be losing momentum and that market sentiment may be starting to shift.
How to Trade (Trade Setup):
- Entry: Place your entry just above the long-legged doji’s high (remember, wait for a confirmation candle to first appear).
- Stop Loss: Place your stop loss just below the long-legged doji’s low.
- Take Profit: Place your TP a few ticks below (before) the nearest key structural level.
2. Trading the Long-Legged Doji with Moving Average
MA Settings: Simple Moving Average (MA Length: 20)
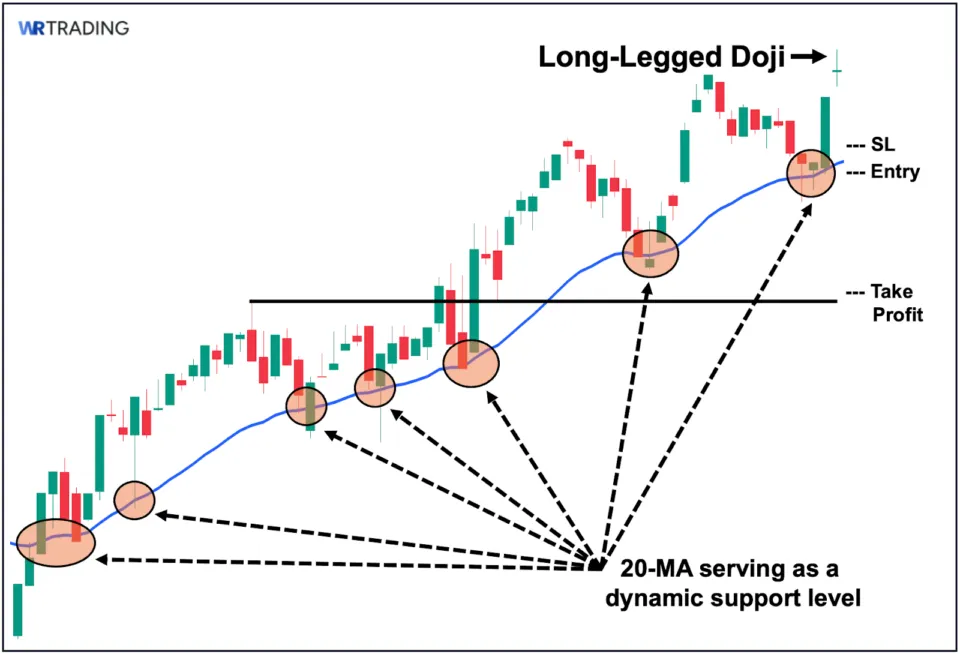
Second, you can also use a simple moving average (in this case, the 20-day moving average) to identify potential “dynamic” support levels (for uptrends) and resistance levels (for downtrends) where price may have difficulty breaking through. To illustrate, we can see from our example above an established uptrend. Hence, for the long-legged doji to lead to a successful trend reversal, the price must first decisively close below this 20 MA level.
However, that is easier said than done, as we can see how the 20-MA has consistently supported the price in the past, successfully preventing any attempts at a trend reversal. Based on this observation, we can conclude that 20-MA is a major support level that must be decisively broken for a trend reversal to occur. Therefore, when the long-legged doji appears, although it reflects uncertainty, it’s best to first wait for the price to break below the 20-MA.
In fact, even if a confirmation candle follows the pattern, as long as the price does not break the 20-MA, we still advise waiting for the price to eventually break past the 20-MA before taking action, as the 20-MA can simply invalidate the setup.
How to Trade (Trade Setup):
- Entry: Place your entry just below the 20 MA line. The price needs to break this support level first to confirm a potential trend reversal.
- Stop Loss: Assuming price successfully closes below the 20 MA line, place your stop loss just above this line, as a move back above the 20 MA would invalidate the potential trend reversal.
- Take Profit: Place your TP a few ticks just above (before) the nearest key structural level.
3. Trading the Long-Legged Doji with Market Structure
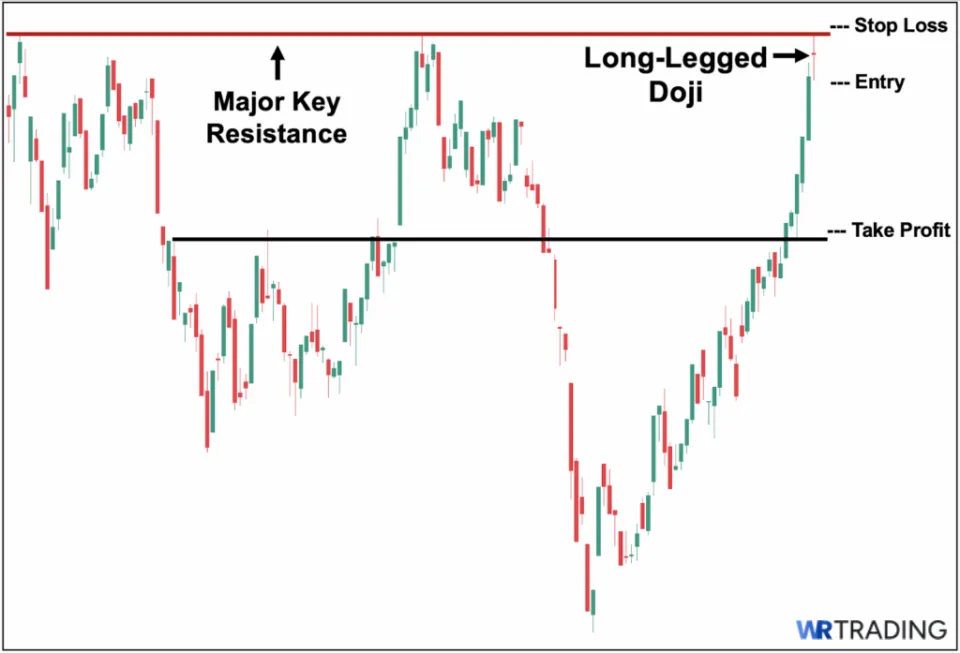
Third, you can also simply utilize the fundamental approach in technical analysis, which involves considering the overall structural context in which the pattern appears. You can do this by zooming out the price chart and contextualizing the appearance of the long-legged doji. Unlike technical indicators, market structure offers a raw view of key price levels in the past.
To illustrate, we can see in our example above that the upper wick of the long-legged doji touches a major key resistance level. We can also observe that when price reached this level in the past, it held successfully and even triggered downward pressure. With this context in mind, we now know that price is more likely to bounce down this “ceiling” rather than successfully break above it.
How to Trade (Trade Setup):
- Entry: Place your entry just below the long-legged doji’s low (remember, wait for a confirmation candle to first appear).
- Stop Loss: Place your stop loss a few ticks above the major key resistance level.
- Take Profit: Place your TP a few ticks just above (before) the nearest key structural level.
(Learn To Trade And Read Candlestick Patterns Like A Pro)
What is the Success Rate of the Long-Legged Doji?
As a best practice, the long-legged doji should never be used in isolation, as it lacks a decisive bullish or bearish directional bias and may simply indicate a pause before the original trend resumes. Nevertheless, if the pattern is immediately followed by a confirmation candle pointing towards a potential trend reversal, the general success rate of the reversal playing out is about 50–60%.
Moreover, the success rate can be further improved if the long-legged doji is supported by additional technical analysis tools, such as a relevant moving average or RSI divergence. That said, always remember that the pattern’s effectiveness still depends heavily on the specific asset being traded, the broader market context, as well as your overall trade setup.
What are the Pros and Cons of the Long-Legged Doji?
The following are the key pros and cons of using the long-legged doji pattern:
Pros
- Serves as a volatility marker
- Reflects the current market indecision
- Often precedes a sharp move in either direction
Cons
- Lacks directional bias
- Reliant on confirmation
- Subjective interpretation of wick lengths
What are the Advantages of the Long-Legged Doji Pattern?
Here are the notable advantages of using the long-legged doji as part of your trading strategy:
- It serves as a volatility marker: First, due to the pattern’s relatively long wicks, it visually reflects the high volatility currently present in the asset. This is useful because it suggests that there is significant market interest, especially when supported by substantial volume, and that an active fight for price control is underway. Hence, even though it is a doji, meaning the opening and closing prices are nearly identical, we can infer that the candle was not formed due to low activity or disinterest but rather from a session marked by a strong tug-of-war between buyers and sellers.
- It reflects the ongoing market indecision: Second, despite efforts from both buyers and sellers, we can immediately tell that the market remains undecided on which direction to go. This is useful because it alerts traders to a potential shift in sentiment or a possible pause in the prevailing trend, allowing them to prepare either way.
- It often precedes a sharp move in either direction: Third, due to the relatively high volatility, we can infer that there is active interest from both buyers and sellers. This often sets the stage for a sharp move in either direction, especially once the market breaks out of the indecision zone. In contrast, a normal or standard doji is usually formed during periods of low market activity or interest. As a result, it is less likely to lead to a sharp move immediately after its appearance.
What are the Disadvantages of the Long-Legged Doji Pattern?
Here are the key disadvantages you need to be aware of when using the long-legged doji:
- It lacks directional bias: First, because the long-legged doji ultimately reflects indecision and closes near its opening price, it does not give any distinct directional bias. This makes it difficult for traders to know whether to prepare for a potential bullish or bearish move, particularly without a decisive confirmation candle (or any other confirmation tool) that follows.
- It is extremely reliant on confirmation: Second, and in connection with our first point, due to its inherent nature, the long-legged doji cannot be viewed in isolation. Again, it only reflects indecision; traders must wait for a strong confirmation candle before making any trading decision. Without confirmation, the setup becomes highly unreliable (prone to failure).
- The required wick length is often subjective: Third, the wick length needed to classify a candle as a “long-legged doji” in the first place is often subjective. In fact, while some traders may consider moderate wicks sufficient, others may require much longer wicks before recognizing the pattern. What even qualifies as a “moderate” length? As you can see, this lack of standardization can sometimes lead to inconsistent analysis and misaligned expectations across different traders and markets.
(Learn To Trade And Read Candlestick Patterns Like A Pro)
Can the Long-Legged Doji Produce False Signals?
Yes, the long-legged doji, like any other candlestick pattern, can and will produce false signals. In fact, without the support of a confirmation tool or a confirmation candle, the long-legged doji is a highly indecisive pattern when viewed on its own and cannot be relied upon as a trend reversal signal. Nevertheless, even when supported by complementary technical analysis tools or followed by a confirmation candle, the signal can still fail, as no pattern is ever 100% reliable or accurate.
What are the Alternatives to the Long-Legged Doji Pattern?
Here are two potential alternatives to the long-legged doji pattern:
1. Rickshaw Man Doji
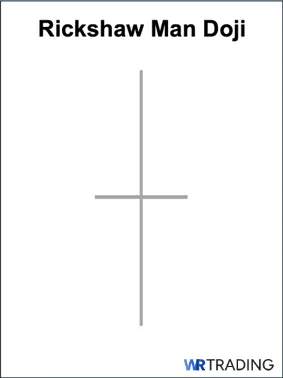
The rickshaw man doji is technically a more specific subvariant of the long-legged doji. In fact, it shares all the same defining features except one: its upper and lower wicks are similarly sized or perfectly symmetrical in length. This makes it resemble a perfectly centered cross. Note that this symmetry is not required for standard long-legged dojis, which often have wicks of noticeably uneven length.
Furthermore, while both the long-legged doji and rickshaw man similarly reflect high volatility during the trading period, the rickshaw man indicates complete market equilibrium, as both buyers and sellers pushed the price in similar ranges but ultimately settled at the midpoint, showing no clear directional bias.
2. High Wave Doji
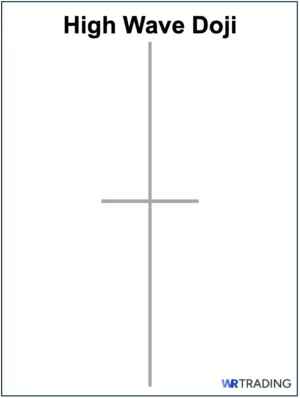
A high wave doji features exaggerated upper and lower wicks, even longer than those of a long-legged doji or a rickshaw man. This exaggerated wick structure causes the candle to visually stand out on the price chart. In fact, of all the doji variations, the high wave doji is usually the most visually prominent due to its extremely long upper and lower shadows.
While the long-legged doji already reflects high volatility during the period, the high wave doji takes this to another level, signaling an even more extreme degree of price volatility.
What Other Types of Dojis Exist?
The following are the other types of dojis that can appear on a price chart:
| Doji Type | Description |
|---|---|
| Four Price Doji | Second, the four-price doji is a one-candle neutral pattern in which the opening, high, low, and closing prices are all identical or equal. Hence, the four-price doji appears as a thin horizontal line or a minus sign (–) on the price chart, as it has no real body and no upper or lower wicks. |
| Dragonfly Doji | Third, the dragonfly doji looks like the capital letter “T.” The pattern has extremely small or no upper wick at all, while having a long lower wick/shadows. |
| Gravestone Doji | Fourth, the gravestone doji is the complete opposite of the dragonfly doji and resembles an inverted capital letter “T.” The pattern features a long upper wick/shadow, accompanied by an extremely small or nonexistent lower wick/shadow. |
| Tri-Star Doji | Sixth, the tri-star doji is an incredibly rare formation consisting of 3 dojis occurring after each other. This type of doji usually appears when volatility and liquidity in a particular asset are both extremely low. |
Learn Pattern Trading with the WR Trading Mentoring
As we have explored, the long-legged doji visually reflects strong market activity from both buyers and sellers; however, neither side ends up taking control of price. While the pattern is neutral, it can still be used as an early warning sign of a shifting power dynamic and balance. In our mentoring class at WR Trading, we cover more advanced use cases and unique interpretations of the long-legged doji, as well as explore other high-impact doji variants, and show how to use them effectively across diverse financial assets, including forex and indices.
(Learn To Trade And Read Candlestick Patterns Like A Pro)
Long-Legged Doji: A Stalemate in the Middle of Volatility
All things considered, the long-legged doji is one of the clearest visual representations of market indecision, being marked by strong participation from both buyers and sellers, yet with neither side able to decisively take control of price. Its long upper and lower wicks reflect high volatility and sharp intraday movement, as both parties tried to push price in their favor. Despite this, the session ultimately ends where it began, showing a lack of clear market conviction.
In our experience, the long-legged doji, unlike other doji types, tends to appear more frequently during volatile market conditions. In fact, while the pattern is neutral and indecisive on its own, it becomes meaningful when viewed in full context, serving as a valuable tool for anticipating potential trend reversals or temporary pauses (such as a mini-consolidation period) within a trend, depending, of course, on other present market factors.