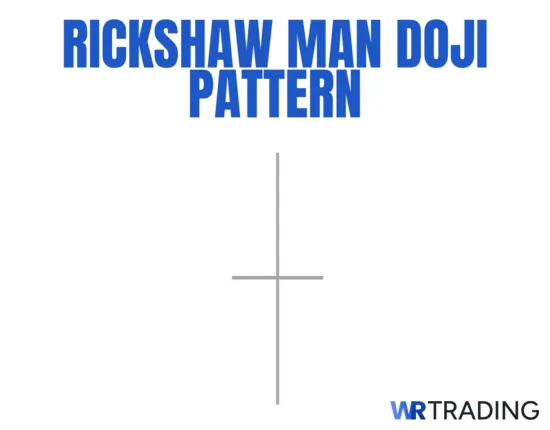
The rickshaw man doji is a one-candle neutral pattern characterized by an extremely slim (or non-existent) body and visually symmetrical long upper and lower wicks. It is technically a subvariant of the long-legged doji. What sets it apart is the equal length of its wicks, which is something not required in the typical long-legged doji. Like its parent pattern, the rickshaw man doji visually reflects elevated volatility during the trading session, as both buyers and sellers actively tried to take control of price action. Interestingly, despite the heightened volatility, its symmetrical upper and lower wicks reflect a state of market equilibrium between buyers and sellers as price settles in the middle, with neither side successfully swaying the price in their favor.
Based on our experience, the rickshaw man doji often marks a point of true market indecision, where price could swing in either direction. Therefore, we do not recommend using the pattern in isolation, as it does not provide any clear directional bias. Instead, to use it effectively in trading, we strongly suggest waiting for a confirmation signal: either from a technical indicator or from the following candle.
Key Facts of The Rickshaw Man Doji Candlestick Pattern:
- Type of Pattern: Neutral/indecisive single candlestick pattern
- Pattern Construction
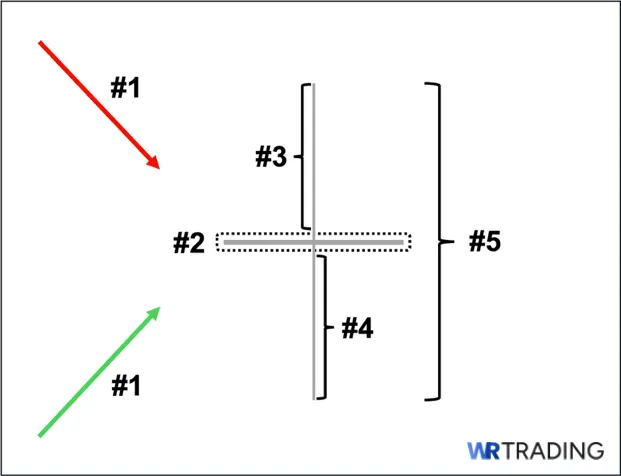
- Body: Must be extremely thin (visually, it looks like a slim horizontal line)
- Upper Wick/Shadow: Must be relatively long and roughly the same length as the lower wick.
- Lower Wick/Shadow: Must also be relatively long and roughly the same length as the lower wick.
- Trend Prior to the Pattern: It must appear during an active trend (either an uptrend or a downtrend). It becomes insignificant if it occurs during a sideways (non-trending) period.
- Trend Forecast: It can simply be a “pause” before the trend continues or a precursor to a potential trend reversal, especially if supported by a confirmation tool or followed by a confirmation candle.
- Opposite Pattern: A “Marubozu,” a long-bodied candlestick pattern with little to no wicks. The pattern reflects decisive, one-sided control of price action.
- Stop Loss Placement:
- Aggressive/Tighter Stop Loss: Depending on the trend, a few ticks above or below the confirmation candle following the rickshaw man doji (we will illustrate this later)
- Conservative/Wider Stop Loss: Depending on the trend, a few ticks above or below the rickshaw man doji’s upper or lower wick
(Learn To Trade And Read Candlestick Patterns Like A Pro)
How Does the Rickshaw Man Doji Form?
A valid rickshaw man doji must appear during an active trend, whether it’s an uptrend or a downtrend. During the session, buyers attempted to push the price notably higher, forming a relatively long upper wick, while sellers also tried to pull it significantly lower, resulting in a similarly long lower wick. Nevertheless, neither buyers nor sellers managed to dominate at the end of the session, and the price closed near (or at) its opening level, which also happens to be in the middle of the candle’s range, resulting in a visually symmetrical upper and lower wicks.
This illustrates that neither side was able to sway the price in their favor. It’s also crucial to note that while the rickshaw man doji can appear during sideways or non-trending markets (and, in fact, it often does), it holds little significance, as the market is already in a state of indecision with no clear directional bias to begin with.
What Does the Rickshaw Man Doji Pattern Mean?
Due to its structure, the rickshaw man doji (like its parent pattern, the long-legged doji) is an inherently neutral or indecisive pattern. What makes it stand out, however, is the symmetry of its upper and lower wicks, which reflects a remarkably balanced tug-of-war between buyers and sellers. Also, compared to a standard/common doji, which may simply suggest low participation or disinterest, the rickshaw man indicates heightened activity from both sides, as price moved significantly in both directions before settling near or at its open.
From a market psychology perspective, this pattern reveals that buyers and sellers were both actively engaged during the session. Yet, despite strong efforts, neither side managed to tilt the outcome in their favor. This becomes especially significant when it shows up during a strong trend, since you would normally expect one side (either buyers or sellers) to maintain clear control. But in this case, both failed.
Still, the rickshaw man doji should not be treated as a standalone reversal signal. The uncertainty it introduces, while valid, must be backed by strong confirmation before traders can conclude that market sentiment has truly shifted and that the established trend is at risk of collapsing.
How to Identify the Rickshaw Man Doji Pattern?
For it to be a valid rickshaw man doji pattern, here are the key characteristics that it must possess when it forms on the price chart:
- Chart Placement: It must occur either during an uptrend or a downtrend. Note that if it appears during a non-trending (sideways-moving) period, it becomes practically pointless, as market sentiment is already indecisive.
- Candle’s Body: It must be extremely slim/thin (representing the identical or nearly identical opening and closing prices).
- Candle’s Upper Wick: It must be relatively long and visually equal in length (symmetrical) to its lower wick.
- Candle’s Lower Wick: Similarly, it must also be relatively long and visually equal in length to its upper wick.
- Overall Appearance: It must have a long candle range and resemble a symmetrical “cross” or a stretched-out “plus sign,” with both of its upper and lower wicks being noticeably longer than those of a standard or common doji.
(Learn To Trade And Read Candlestick Patterns Like A Pro)
What is an Example of the Rickshaw Man Doji Pattern?
Shown below is an example of a rickshaw man doji pattern that can appear on a price chart. As we can observe, there was a prevailing uptrend before the rickshaw man appeared. Then, during the trading session, when the pattern emerged, we can see that both buyers and sellers actively tried to sway the price in their favor, as evidenced by the long upper and lower wicks. In fact, the price even reached a new high before ultimately closing at its opening price.
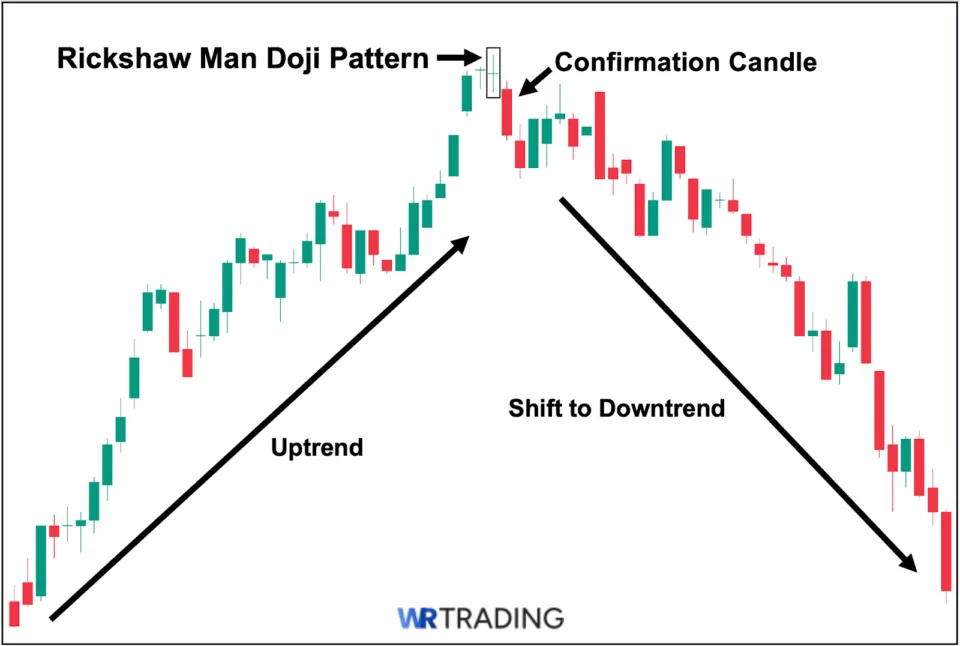
That said, since the rickshaw man is inherently indecisive or neutral, it is not a reliable signal for a full-blown trend reversal on its own. If it is to lead to a downtrend, it must be followed by a clear confirmation signal. In this case, confirmation came from the next candle, which was a long-bodied bearish candle that closed strongly below the rickshaw man doji. This candle essentially acted as the “confirmation candle,” suggesting that market sentiment may have shifted. As it turned out, the signal proved valid, and the price continued into a sustained downtrend.
How to Trade the Rickshaw Man Doji Pattern:
Here is a simple 5-step process you can follow to start using the rickshaw man doji pattern when trading financial instruments such as forex, stocks, and other assets.
Step 1: Identify a Valid Rickshaw Man Doji Pattern
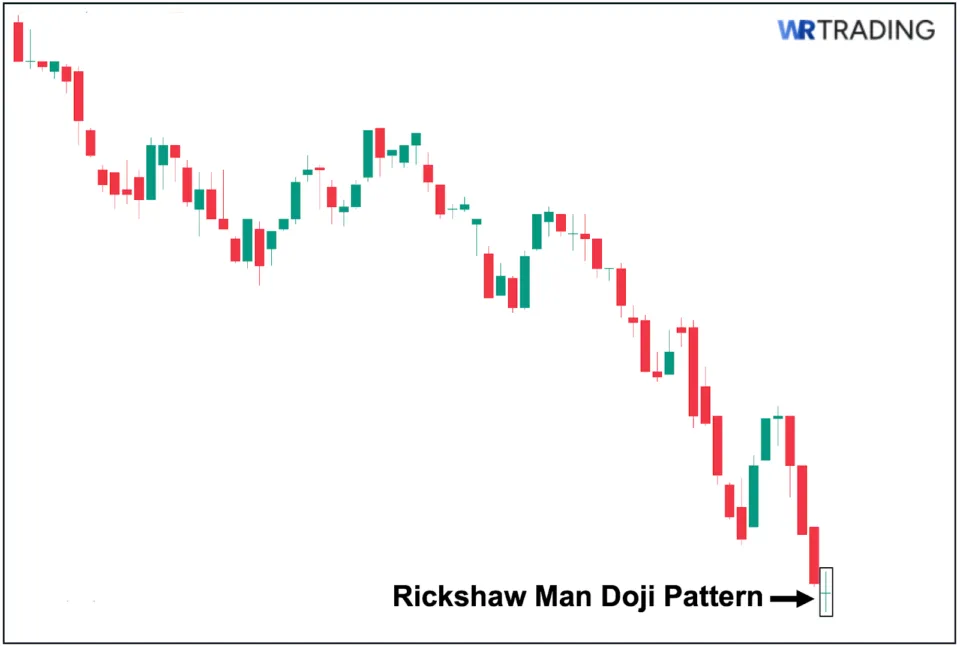
First, you need to ensure that the rickshaw man doji emerges during an active trend: either an uptrend or a downtrend. It is essential to note that if you observe the pattern during a non-trending (sideways-moving) period, it becomes practically insignificant, as market sentiment already reflects market indecision. As an example, we can see above a valid rickshaw man doji, since it appeared during an active trend, specifically, at the bottom of an ongoing downtrend.
Step 2: Wait for a Reversal Confirmation Candle to Identify Your Entry
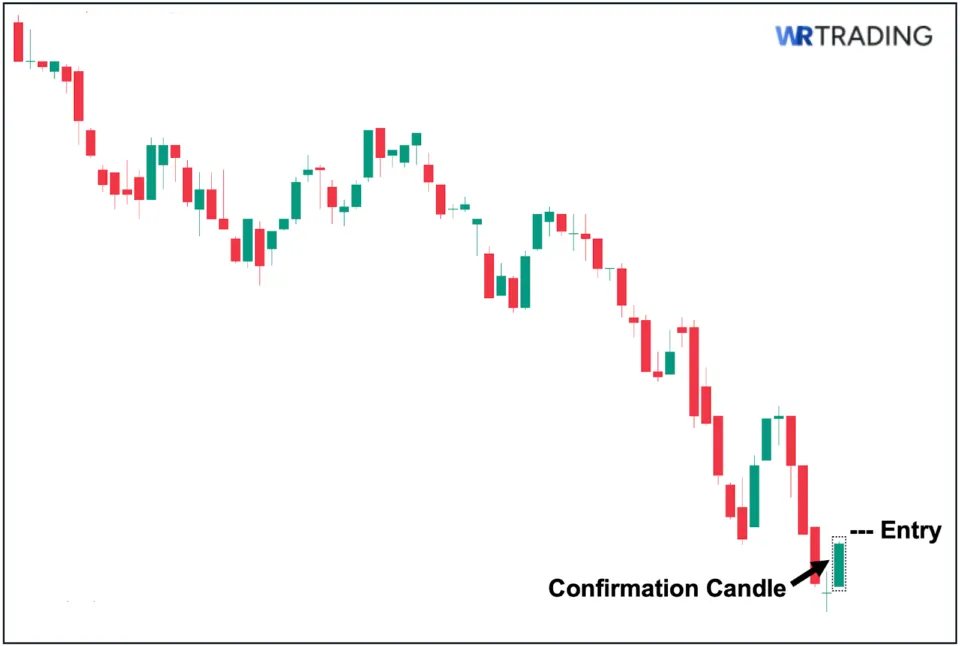
Second, if you intend to use the rickshaw man doji as part of a trend reversal strategy, then waiting for a confirmation signal to appear first is non-negotiable. To illustrate, we can see above that the rickshaw man doji formed at the lowest point of the downtrend. The ideal scenario in this case is if a clear confirmation candle follows it.
In this case, that ideal scenario occurred, as a long-bodied bullish candle closed above the pattern immediately after, serving as the needed confirmation signal that market sentiment may have shifted. With this confirmation in place, you can then decide on your specific entry point. At this stage, we recommend either of the following options:
- Aggressive Entry – Placing your long order at the closing price of the confirmation candle.
- Conservative Entry – Placing your long order after the price breaks further above the high of the confirmation candle (as an added layer of assurance).
(Learn To Trade And Read Candlestick Patterns Like A Pro)
Step 3: Determine Your Stop Loss (SL) Level
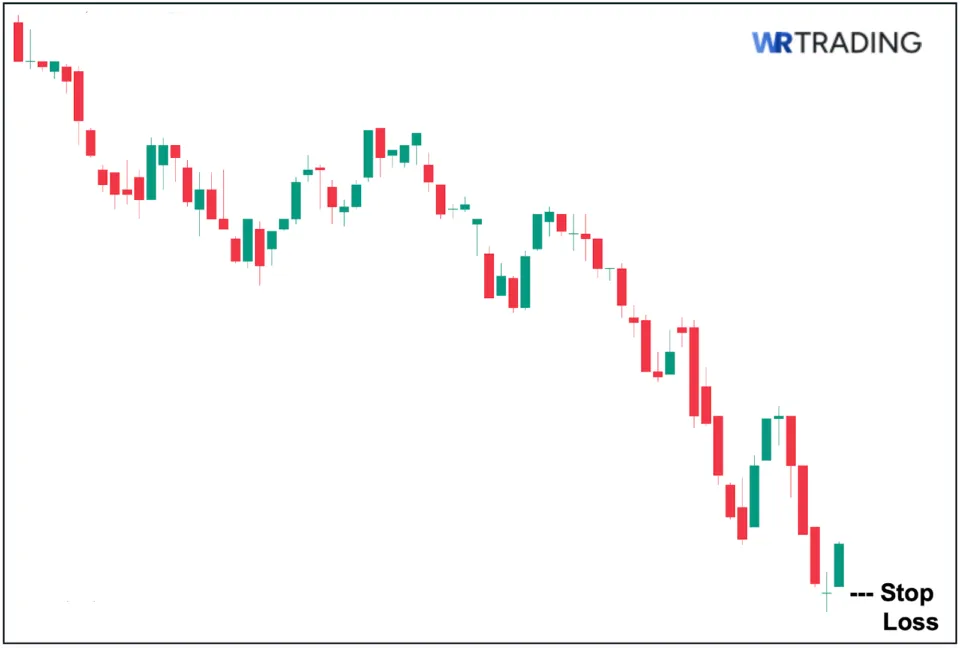
Third, after you identify your viable entry point, you then need to determine your definitive stop-loss point where you will, without hesitation, exit the trade if it goes against your favor. In this particular scenario, if the downtrend continued instead of leading to a trend reversal. For your stop loss, we suggest adopting either a:
- Tighter Stop Loss – Placing your stop loss just below the low of the confirmation candle (see the image above for illustration).
- Wider Stop Loss – Placing your stop loss below the low of the rickshaw man doji.
Step 4: Set Your Target Price (TP)
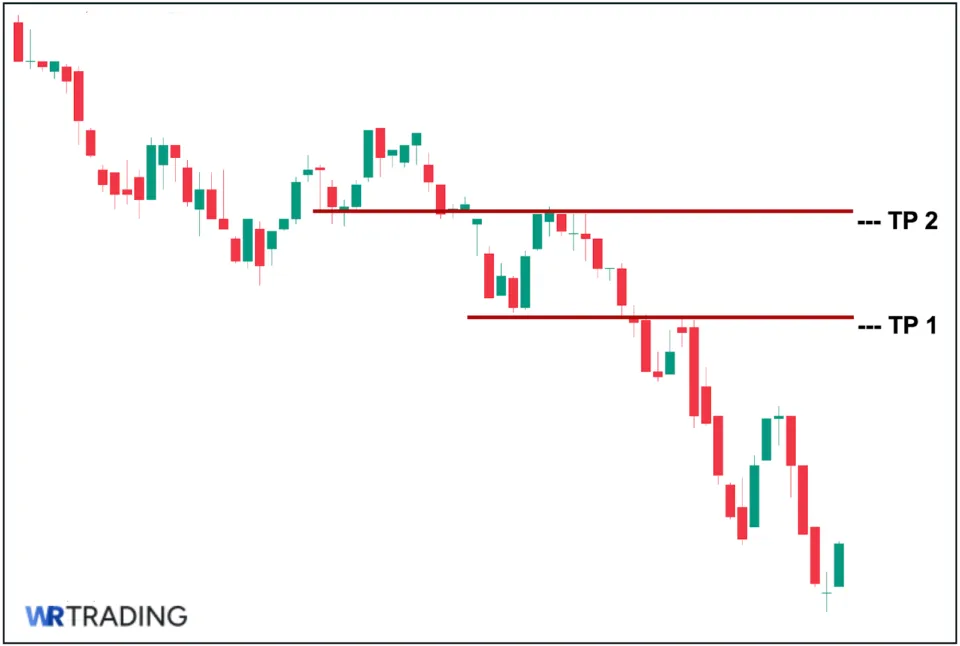
Fourth, you then need to determine your target price/s where you will place your sell orders if price moves in your favor. In this specific case, if the rickshaw man doji successfully leads to a bullish trend reversal.
In this step, we recommend selling in tranches, allowing you to capture higher profit potential if the bullish rally extends beyond your first target price. To illustrate, you can observe that we placed two target prices (TPs) above. We based these TPs on key structural levels where price may encounter significant selling pressure, which could prevent further upward price rally.
Step 5: Open the Trade
The final step is to officially open the trade by carefully following the first four steps we outlined. Namely: first, confirm that the pattern is valid; second, determine your entry point; third, place your stop-loss order; and fourth, set your target price levels.
Additionally, we highly recommend only taking trades with a reward-to-risk ratio of at least 2:1. This means the distance between your entry and your first target price should be at least twice the distance between your entry and your stop-loss level.
Is the Rickshaw Man Doji Bullish or Bearish?
Similar to its parent pattern, the long-legged doji, the rickshaw man is classified as a neutral or indecisive pattern. Hence, it is neither bullish nor bearish. In fact, due to its structure, it is considered one of the most neutral doji variants, as the equal length of its upper and lower wicks reflects a state of market equilibrium where neither buyers nor sellers successfully swayed the price in their favor. This is why it is widely considered a reflection of “true” market indecision and cannot be reliably used to signal a clear direction on its own.
(Learn To Trade And Read Candlestick Patterns Like A Pro)
Best Trading Strategies for the Rickshaw Man Doji:
The following are three of the best trading strategies to utilize alongside the rick-shaw doji pattern:
1. Trading the Rickshaw Man Doji with RSI
RSI Settings: Default (14 SMA, 2 Standard Deviation)
First, the rickshaw man doji can be paired with RSI divergence to point to a potential trend reversal. Simply put, RSI divergence occurs when the RSI moves in the opposite direction of price, hinting that the trend momentum may be weakening. In technical analysis, this divergence is widely considered a leading indicator that can anticipate a potential shift in trend before price action decisively confirms it.
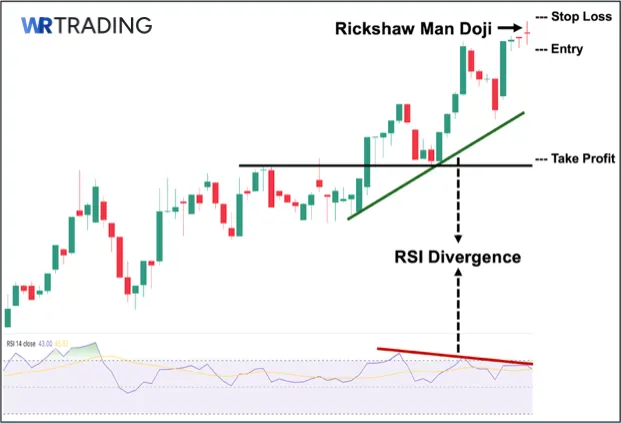
In the chart above, while price continues to make higher highs, the RSI starts forming lower highs, making a bearish divergence. The appearance of the rickshaw man doji at this point adds a visual confirmation of uncertainty in the current trend. Its symmetrical wicks highlight a moment of true indecision, reinforcing the idea that buyers may be losing control since it used to drive price action .Hence, when this pattern aligns with RSI divergence, the probability of a reversal increases significantly.
How to Trade (Trade Setup):
- Entry: Place your entry just below the rickshaw man doji’s low (remember, wait for a confirmation candle to first appear).
- Stop Loss: Place your stop loss just above the rickshaw man doji’s high.
- Take Profit: Place your TP a few ticks above (before) the nearest key structural level.
2. Trading the Rickshaw Man Doji with Moving Average
MA Settings: Simple Moving Average (MA Length: 50)
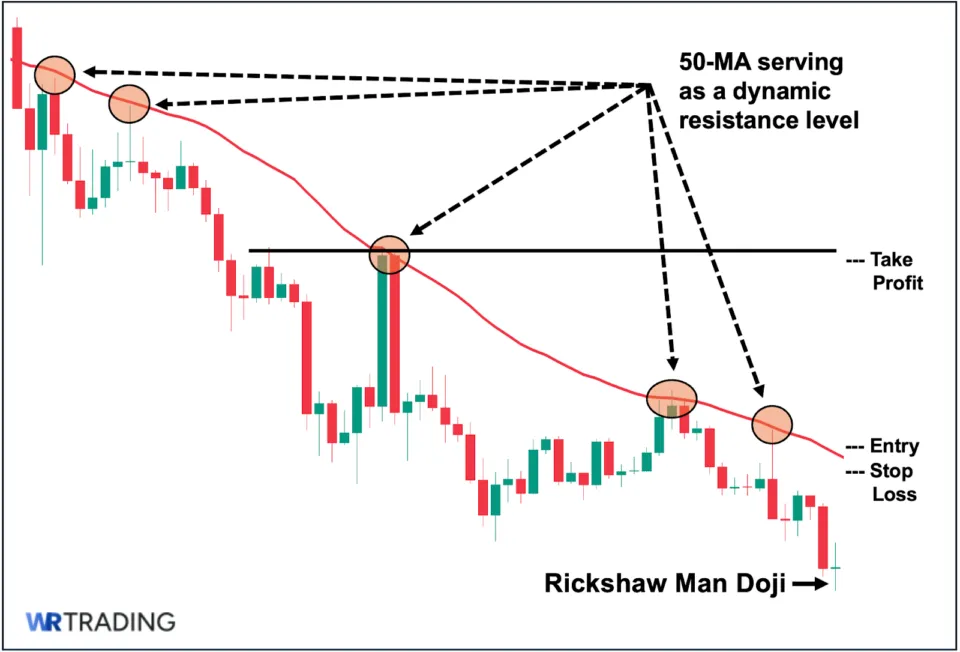
Second, the 50-day simple moving average can be used to identify dynamic areas where price may encounter strong support or resistance, depending on the trend direction. In an uptrend, the 50 MA often acts as a floor that keeps price from breaking lower. In a downtrend, it typically functions as a ceiling that caps upward moves.
In our example above, the market has been trending downward. For the rickshaw man doji to lead to a successful reversal, a clear and decisive break above the 50 MA would be required. That said, this is not easily achieved, as historical price action shows that the 50 MA has repeatedly held firm as a key resistance level. This reinforces its importance. While the appearance of a rickshaw man doji suggests growing indecision, it is not enough by itself. You’ll want to wait for price to convincingly break through the 50 MA before considering any reversal setup.
How to Trade (Trade Setup):
- Entry: Place your entry just above the 50 MA line. The price needs to break this resistance level first to confirm a potential bullish trend reversal.
- Stop Loss: Assuming price successfully closes above the 50 MA line, place your stop loss just below this line, as a move back below the 50 MA would invalidate the potential trend reversal.
- Take Profit: Place your TP a few ticks just below (before) the nearest key structural level.
3. Trading the Rickshaw Man Doji with Market Structure
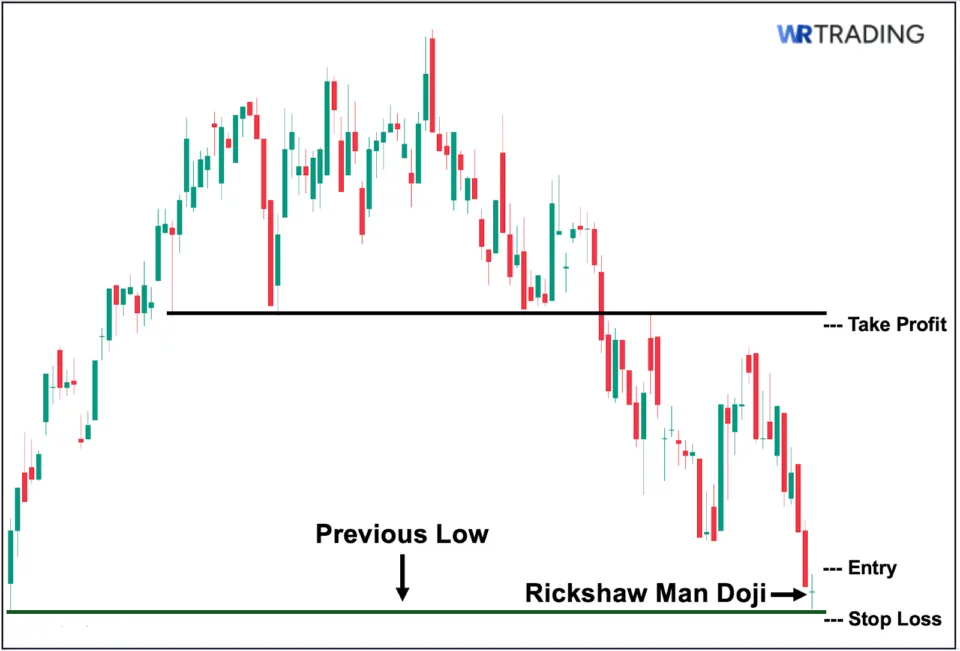
Finally, you can also apply a simple structural approach to technical analysis by considering the broader market context in which the rickshaw man doji appears. This can be done by literally zooming out on the price chart and evaluating whether the pattern aligns with historically significant/key levels. Unlike technical indicators, analyzing market structure provides a more direct view of how price has reacted to key zones in the past.
In the chart above, the lower wick of the rickshaw man doji touches a well-established support level. Looking back, we can see that this level has held and even triggered a bounce to an uptrend. With this in mind, the appearance of the rickshaw man doji at this level reinforces the likelihood of price respecting that support once again, making a potential reversal more probable than a break below this key support line.
How to Trade (Trade Setup):
- Entry: Place your entry just above the rickshaw man doji’s high (remember, wait for a confirmation candle to first appear).
- Stop Loss: Place your stop loss a few ticks below the major key support level (previous low).
- Take Profit: Place your TP a few ticks just below (before) the nearest key structural level.
(Learn To Trade And Read Candlestick Patterns Like A Pro)
What is the Success Rate of the Rickshaw Man Doji?
As a general guideline, the rickshaw man doji should never be used in isolation, as it does not offer any clear bullish or bearish directional bias and may simply signal a pause before the prevailing trend continues. This is especially true as the pattern reflects market equilibrium or “true” indecision. That said, if the pattern is immediately followed by a strong confirmation tool or candle suggesting a potential trend reversal, the success rate of that reversal playing out generally falls within the 50–60% range.
Still, the rickshaw man doji should not be treated as a standalone reversal signal. The uncertainty it introduces, while valid, must be backed by strong confirmation before traders can conclude that market sentiment has truly shifted and that the established trend is at risk of collapsing.
What are the Pros and Cons of the Rickshaw Man Doji?
Pros
- Reflects volatility and market equilibrium at the same time
- Reflects a point of “true” indecision
- Represents the calm before a decisive market move
Cons
- Complete lack of directional bias
- Practically unactionable without external confirmation
- Rare appearance
What are the Advantages of the Rickshaw Man Doji Pattern?
Here are the notable advantages of using the rickshaw man doji as part of your trading strategy:
- Reflects volatility and market equilibrium at the same time: First, the rickshaw man is a unique doji variant that reflects both balance and volatility simultaneously. Ironically, those two qualities are often contradictory: the more volatile the market is, the less balance we tend to see, and the more balance we observe, the less volatile the market usually is. This is why capturing both in a single pattern offers a particularly meaningful insight into price behavior.
- It reflects a point of “true” market indecision: Second, unlike its parent pattern, the long-legged doji, the rickshaw man marks a “true” period of complete market indecision. This is visually illustrated by the pattern’s inherent characteristic of having symmetrical upper and lower wicks, which makes its slim body centered. This perfect symmetry reflects a balanced struggle between buyers and sellers, with neither side able to gain even the slightest upper hand.
- It can represent the calm before a decisive market move: Third, due to its high volatility, the rickshaw man often marks the “calm” before price moves decisively in one direction: either continuing the prevailing trend or leading to a reversal. This makes it a valuable pattern to watch for potential turning points, especially when the pattern is supported by a confirmation signal.
What are the Disadvantages of the Rickshaw Man Doji Pattern?
Here are the key disadvantages you need to be aware of when using the rickshaw man doji:
- A complete lack of directional bias: First, while being perfectly balanced provides a meaningful insight into market psychology, the symmetrical wicks reflect absolutely no directional bias. The thing is, this is not always advantageous, as in some trade setups, it can be more helpful to have even a slight hint of directional bias. In such cases, a long-legged doji (where the wick length leans more to one side) may, in fact, offer clearer context for planning your trade.
- It is practically unactionable without external confirmation: Second, since it has zero directional bias at all, it is perhaps the most indecisive doji variant that absolutely, at no point in time, should be used without an additional confirmation signal. Without it, the pattern offers no real “edge,” and acting on it prematurely can easily lead to misjudged entries or false signals, even more so than with other doji types.
- It rarely shows up during typical trading sessions: Third, in terms of practicality, since it is a sub-variant of the long-legged doji, the rickshaw man doji appears far less frequently on the chart. Its strict requirement for symmetrical upper and lower wicks makes it much more uncommon compared to other doji types, limiting its availability and potential use in day-to-day chart analysis.
Can the Rickshaw Man Doji Produce False Signals?
Yes, the rickshaw man doji, like any other candlestick pattern, can produce false signals. As a matter of fact, on its own, and without the support of a confirmation tool or a follow-up candle, it is an extremely indecisive pattern and should not be used as a standalone signal for a trend reversal or even to suggest a clear price direction, as it will most likely result in mixed signals at best. Moreover, even when the pattern is paired with confirmation tools (such as technical indicators or a confirming candle), the signal can still fail, as no pattern is ever 100% reliable.
What are the Alternatives to the Rickshaw Man Doji Pattern?
The following are two potential alternatives to the rickshaw man doji pattern:
1. Long-Legged Doji
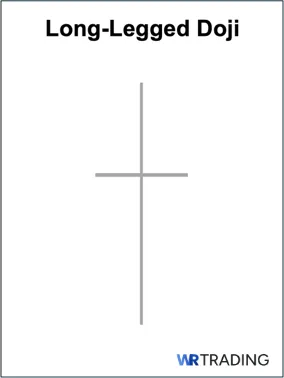
The long-legged doji is technically the “parent” pattern of the rickshaw man doji, as the rickshaw man is a subvariant of the long-legged doji. In fact, the only differentiating factor is that while the rickshaw man requires symmetrical upper and lower wick lengths, the long-legged doji, though also relatively long, does not require its wicks to be equal in length.
This makes the long-legged doji more flexible. Similar to the rickshaw man, the long-legged doji also reflects an elevated level of volatility, though it does not necessarily reflect market equilibrium between buyers and sellers.
2. High Wave Doji
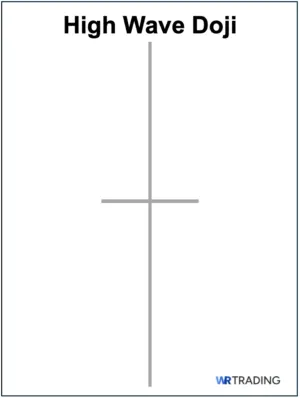
A high wave doji features exaggerated upper and lower wicks, even noticeably longer than the usual rickshaw man and long-legged dojis. As you can imagine, its sheer size and extreme wick length make it visually stand out on the price chart. Of all the doji variations, the high wave doji is, without a doubt, the most visually striking.
In fact, while both the rickshaw man and long-legged dojis already reflect relatively high levels of volatility, the high wave doji takes this even further, signaling the most extreme degree of intraday volatility among all doji types.
What Other Types of Dojis Exist?
Aside from the rickshaw man doji, here are the other types of doji patterns that you will see on a price chart:
| Doji Type | Description |
|---|---|
| Four Price Doji | The four-price doji is a one-candle neutral pattern in which the opening, high, low, and closing prices are all identical or equal. Hence, the four-price doji appears as a thin horizontal line or a minus sign (–) on the price chart, as it has no real body and no upper or lower wicks. |
| Dragonfly Doji | The dragonfly doji looks like the capital letter “T.” The pattern has extremely small or no upper wick at all, while having a long lower wick/shadows. |
| Gravestone Doji | The gravestone doji is the complete opposite of the dragonfly doji and resembles an inverted capital letter “T.” The pattern features a long upper wick/shadow, accompanied by an extremely small or nonexistent lower wick/shadow. |
| Tri-Star Doji | The tri-star doji is an incredibly rare formation consisting of 3 dojis occurring after each other. This type of doji usually appears when volatility and liquidity in a particular asset are both extremely low. |
Learn Pattern Trading with the WR Trading Mentoring
As we have covered, the rickshaw man doji stands out as a unique doji variant that simultaneously reflects relatively high volatility as well as a point of “true” indecision due to its symmetrical upper and lower wicks. In our mentoring class at WR Trading, we dive deeper into much more niche use cases and interpretations of various doji patterns, including the rickshaw man, and demonstrate how to tailor your trading approach depending on the specific financial instrument you prefer to trade, such as indices and forex.
(Learn To Trade And Read Candlestick Patterns Like A Pro)
Rickshaw Man: A Moment of Balance During High Volatility
To conclude, the rickshaw man doji is a unique subvariant of the long-legged doji that captures both elevated volatility and true market indecision. Its defining feature is the symmetrical length of its upper and lower wicks, which reflects a “near-perfect” balance between buyers and sellers, with neither side able to exert control over the price. Because of this, it stands out as one of the most neutral candlestick patterns that can appear on a chart. While it does not point to any specific direction on its own, it can still serve as an early warning sign, particularly if it is supported by a confirmation signal, such as a technical indicator or the following candle.
In our experience, the rickshaw man pattern appears much less frequently compared to its parent pattern, the long-legged doji. In practice, however, we treat and interpret the rickshaw man practically the same way as the long-legged doji. In fact, it is not necessarily a “better” version, since depending on the chart, it may actually be more helpful if the price leans slightly to one side rather than being perfectly balanced.