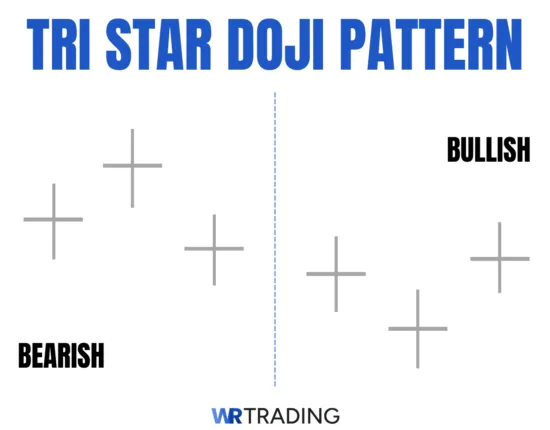
The tri-star doji is a three-candle reversal pattern composed of three consecutive doji candles that reflects an extended period of uncertainty and a likely loss of momentum in the prevailing trend. Notably, the appearance of three dojis in a row with noticeable gaps from each other is extremely rare. Furthermore, the pattern has two variants: a bullish tri-star doji and a bearish tri-star doji. The bullish tri-star doji appears at the bottom of a downtrend and consists of 3 small doji candles that visually resemble a small letter “v.” In contrast, the bearish tri-star doji appears at the top of an uptrend and is composed of 3 small doji candles that resemble an inverted small letter “v.”
From our trading experience, while both the bullish tri-star doji and the bearish tri-star doji are technically considered trend reversal patterns, they tend to be less decisive than other 3-candle patterns, such as the morning star and evening star, or even 2-candle patterns like the bullish and bearish engulfing. This is primarily because the tri-star doji is composed entirely of three doji candles, which, by nature, are indecisive. In fact, unlike the previously mentioned patterns, where the reversal is often driven by a swift and decisive shift in market sentiment, the reversal signal from the tri-star doji arises from the loss of momentum in the existing trend. Hence, we still strongly recommend waiting for a confirmation candle before using the pattern in isolation.
(Learn To Trade And Read Candlestick Patterns Like A Pro)
What is a Bullish Tri-Star Doji?
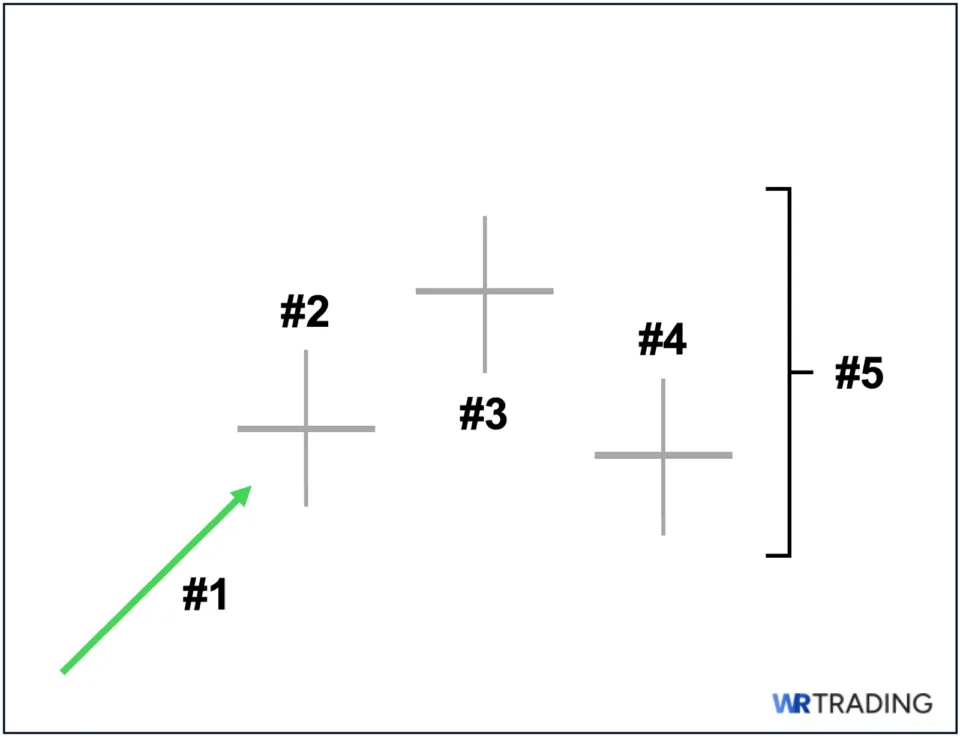
The bullish tri-star doji reflects a prolonged period of uncertainty and indecision, as well as fading bearish momentum. It appears at the bottom of a downtrend and consists of 3 consecutive small doji candles. The 1st doji is fairly ordinary, but is quickly followed by a 2nd doji that gaps down and marks a new low for the downtrend. This is then followed by a 3rd doji that gaps up, reversing the prior move. Together, the 3 dojis visually form a small letter “v” or a structure similar to a Morning Star pattern, but with all 3 candles being dojis.
Key Facts of The Bullish Tri Star Doji Candlestick Pattern:
- Type of Pattern: Bullish Reversal Pattern
- Pattern Construction
- 1st Candle: A small doji that forms after a sustained downtrend
- 2nd Candle: A small doji that gaps down below the 1st doji
- 3rd Candle: A small doji that gaps up above the 2nd doji
- Trend Prior to the Pattern: Must appear at the bottom of an ongoing downtrend to be valid
- Trend Forecast: A potential trend reversal from a downtrend to an uptrend
- Opposite Pattern: The “bearish tri-star doji,” which is a tri-star doji variant that appears at the top of a prevailing uptrend and signifies a potential bearish trend reversal.
- Stop Loss Placement:
- Aggressive/Tighter Stop Loss: A few ticks below the low of the confirmation candle that immediately follows the pattern
- Conservative/Wider Stop Loss: A few ticks below the lower wick of the 3rd doji in the tri-star pattern
What is a Bearish Tri-Star Doji?
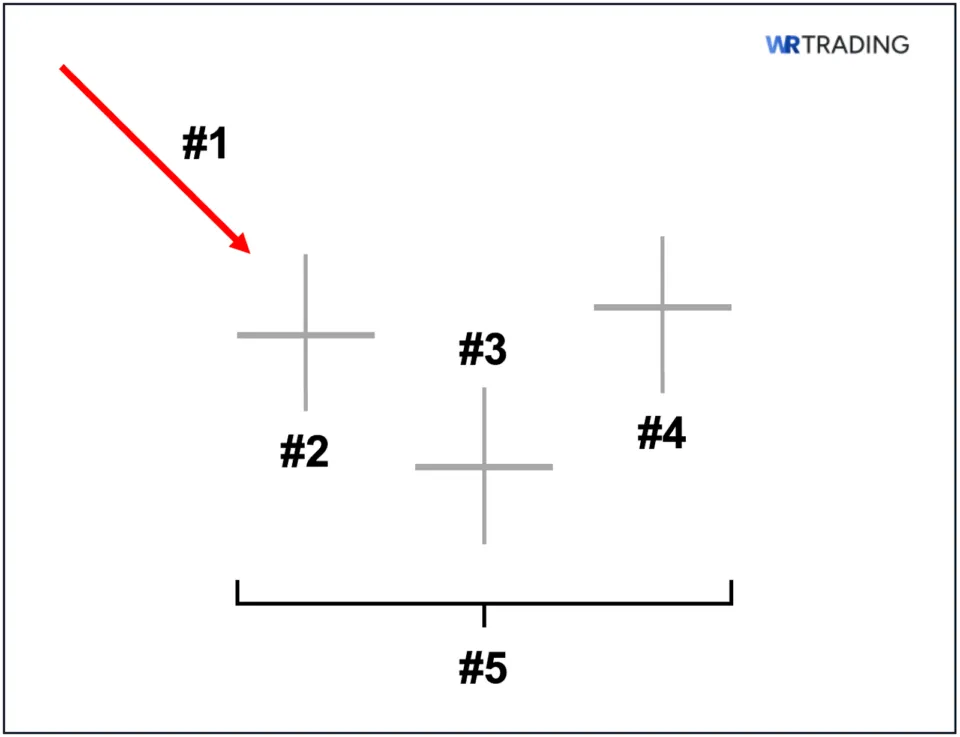
The bearish tri-star doji reflects an extended period of indecision and uncertainty, as well as fading bullish momentum. It emerges at the top of a prevailing uptrend and consists of 3 consecutive small doji candles. The 1st doji is not particularly special, but is quickly followed by a 2nd doji that gaps up and makes a new high for the uptrend. This is then followed by a 3rd doji that gaps down, reversing the prior move. Together, the 3 dojis visually resemble an inverted small letter “v” or a structure similar to a Morning Star pattern, but with all 3 candles being dojis.
Key Facts of The Bearish Tri Star Doji Candlestick Pattern:
- Type of Pattern: Bearish Reversal Pattern
- Pattern Construction
- 1st Candle: A small doji that forms after a sustained uptrend
- 2nd Candle: A small doji that gaps up above the 1st doji
- 3rd Candle: A small doji that gaps down below the 2nd dog
- Trend Prior to the Pattern: Must appear at the top of a prevailing uptrend to be valid
- Trend Forecast: A potential trend reversal from an uptrend to a downtrend
- Opposite Pattern: The “bullish tri-star doji,” which is a tri-star doji variant that appears at the bottom of an ongoing downtrend and signifies a potential bullish trend reversal.
- Stop Loss Placement:
- Aggressive/Tighter Stop Loss: A few ticks above the high of the confirmation candle that immediately follows the pattern
- Conservative/Wider Stop Loss: A few ticks above the upper wick of the 3rd doji in the tri-star pattern
(Learn To Trade And Read Candlestick Patterns Like A Pro)
How Does the Tri-Star Doji Form?
The tri-star doji forms over a span of three trading sessions. Its position on the chart depends on the variant of the pattern. For the bullish tri-star doji, it appears at the bottom of a downtrend, forming over three periods, each represented by a doji candle, and visually resembles a small letter “v.” On the other hand, the bearish tri-star doji forms at the top of a prevailing uptrend, also over three periods, each represented by a doji candle, and visually resembles an inverted small letter “v.”
What Does the Tri-Star Doji Pattern Mean?
The meaning of the tri-star doji pattern centers on its role as a potential trend reversal signal. While it can be either bullish or bearish (depending on its location in the trend), its underlying message is one of prolonged indecision. The pattern consists of three consecutive doji candles, each reinforcing uncertainty, and together suggesting that the prevailing trend may be losing momentum.
Here’s a deeper look into the market psychology behind its interpretation from a technical analysis perspective:
- 1st candle meaning: The 1st doji appears after a strong trend (downtrend in the case of a bullish tri-star, or uptrend in the case of a bearish tri-star). The appearance of this doji signals the initial hesitation. From a market psychology standpoint, the momentum that once pushed the trend is starting to fade.
- 2nd candle meaning: The 2nd candle is also a doji, but what makes it unique is its tendency to gap away from the first (either downward in a bullish tri-star: creating a new low; or upward in a bearish tri-star: creating a new high). This visual gap heightens the sense of uncertainty and instability in the market. In market psychology, this doji, while still moving in the direction of the trend, reinforces that neither buyers nor sellers are confident enough to decisively drive price in a clear direction, further weakening the case for continuation of the existing trend.
- 3rd candle meaning: The 3rd doji also gaps away from the second candle, but this time, in the opposite direction. In a bullish tri-star, it gaps up; in a bearish tri-star, it gaps down. This final doji essentially seals the pattern’s message: the market has now entered a state of exhaustion, and the trend is struggling to continue. Hence, while it is still a doji and therefore not decisive on its own, the combined structure of these 3 consecutive dojis across 3 sessions reflects deep uncertainty and a lack of conviction from either side.
Despite its rare structure and psychological weight, the tri-star doji is relatively not a strong reversal signal. This is especially the case when compared with other, much more decisive patterns, such as the morning or evening star, where the third candle is a strong confirmation candle. In contrast, the tri-star’s 3rd candle (being a doji) ends in indecision, not strength.
Hence, the pattern still requires a confirmation candle. For the bullish tri-star, this would be a relatively long-bodied bullish candle that closes decisively. On the other other, for the bearish tr-star, this would be a relatively long-bodied bearish candle that closes decisively.
How to Identify the Tri-Star Doji Pattern?
For a candlestick formation to be considered a “valid” tri-star doji pattern, it needs to meet these key characteristics when it forms:
Bullish Tri-Star Doji Pattern
- Chart Placement: It must form at the bottom of an ongoing downtrend. Any candlestick formation that looks like the bullish tri-star doji pattern but appears during either an uptrend or a non-trending (sideways) period is invalid.
- First Candle: A small doji that forms after a sustained downtrend.
- Second Candle: A small doji that gaps down below the 1st doji
- Third Candle: A small doji that gaps up above the 2nd doji
- Overall Appearance: Three consecutive small doji candles that visually resemble a small letter “v” or a structure similar to a Morning Star pattern, but with all three candles being dojis.
Bearish Tri-Star Doji Pattern
- Chart Placement: It must form at the top of a prevailing uptrend. Any candlestick formation that looks like the bearish tri-star doji but appears during either a downtrend or a non-trending (sideways) period is invalid.
- First Candle: A small doji that forms after a sustained uptrend.
- Second Candle: A small doji that gaps up above the 1st doji
- Third Candle: A small doji that gaps down below the 2nd doji
- Overall Appearance: Three consecutive small doji candles that visually resemble an inverted small letter “v” or a structure similar to an Evening Star pattern, but with all three candles being dojis.
(Learn To Trade And Read Candlestick Patterns Like A Pro)
What is an Example of the Bullish Tri-Star Doji Pattern?
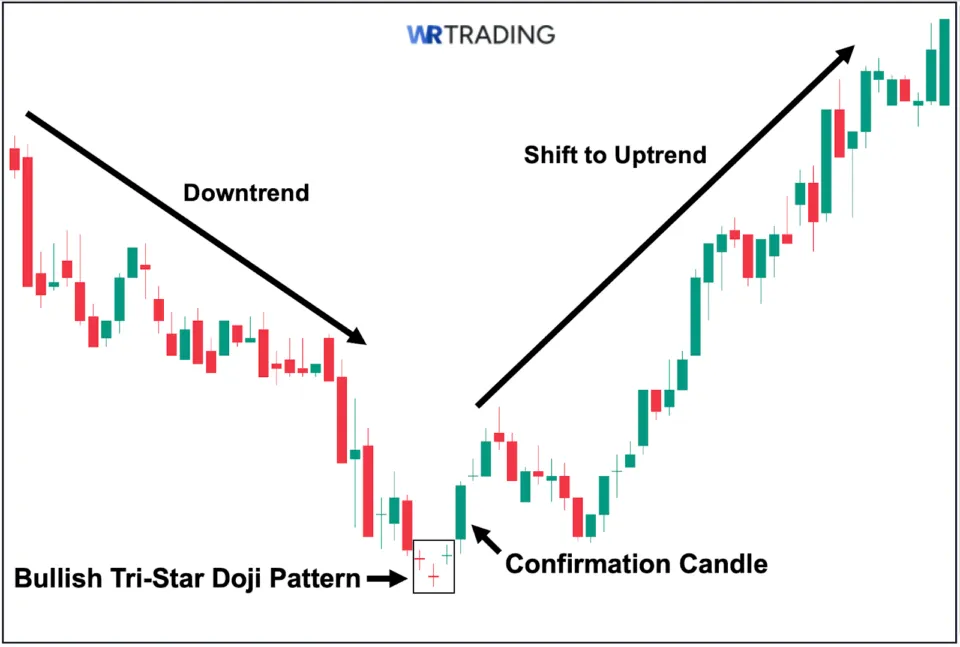
Here is an example of a valid bullish tri-star doji pattern that can appear on a price chart. As we can observe, there was a strong ongoing downtrend before the pattern ultimately formed. Then, over the course of three trading sessions, the market produced three consecutive doji candles at the bottom of the trend. We can also notice that these dojis appeared with slight gaps between them, visually forming a subtle “v” shape, which is a key characteristic of the bullish tri-star doji.
The pattern signaled that the prior selling momentum was beginning to fade, and that sellers were slowly losing control of the price, indicating a potential trend reversal may be on the way. That said, since the tri-star is not a strong standalone reversal signal on its own. For it to become a reliable signal, a confirmation candle must follow. In this case, the confirmation came in the form of a long-bodied bullish candle that closed further above the high of the doji cluster. This strong close officially signaled a shift in market sentiment as buyers regained control. As shown in the chart, this ultimately transpired, and the trend shifted to an uptrend.
What is an Example of the Bearish Tri-Star Doji Pattern?
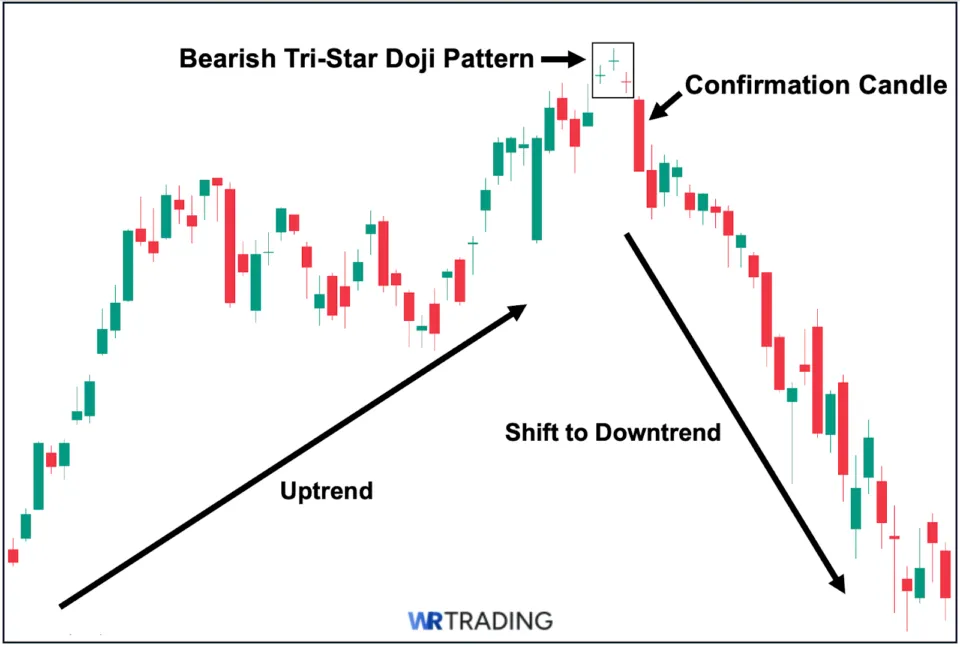
Shown above is an example of a valid bearish tri-star doji pattern that can emerge on a price chart. As we can see, there was a prevailing uptrend before the tri-star pattern formed at the top of the trend. Then, over the next three trading sessions, three consecutive doji candles emerged. Notably, the second and third dojis also show small gaps from their previous closes, further emphasizing instability in market sentiment.
Nevertheless, the tri-star doji is not a strong reversal pattern on its own, and for it to lead to a successful trend reversal, it must then be followed by a clear confirmation candle. In this case, confirmation came immediately from the next candle, which is a long-bodied bearish candle that closed strongly further below the entire tri-star pattern. This candle effectively confirms that market sentiment may have officially shifted. As it turned out, we can see that the signal proved accurate, and the price entered into a sustained downtrend afterward.
How to Trade the Tri-Star Doji Pattern: A Comprehensive Guide
Here is a simple 5-step process you can follow to start using the Tri-Star Doji pattern to trade various financial instruments, including popular ones: forex, stocks, and crypto.
(Learn To Trade And Read Candlestick Patterns Like A Pro)
Step 1: Identify a Valid Tri-Star Doji Pattern
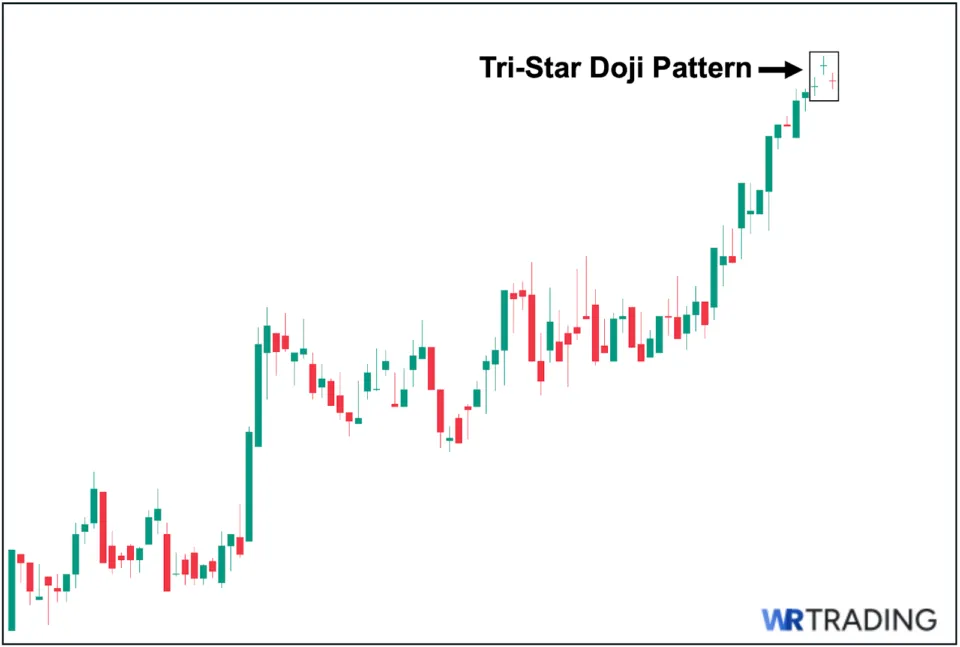
First, you need to ensure that the tri-star doji pattern forms during an active trend, either at the top of an uptrend (for bearish tri-star doji) or at the bottom of a downtrend (for bullish tri-star doji). Note that this is important because spotting this pattern in a non-trending (sideways) market renders it practically useless. In sideways conditions, market indecision is already expected, so the presence of three dojis has little value from a technical analysis standpoint.
In contrast, we can see above a valid tri-star doji pattern, since it emerged after a strong and sustained uptrend. Specifically, three consecutive doji candles appeared at the top of the trend.
Step 2: Wait for a Reversal Confirmation Candle to Identify Your Entry
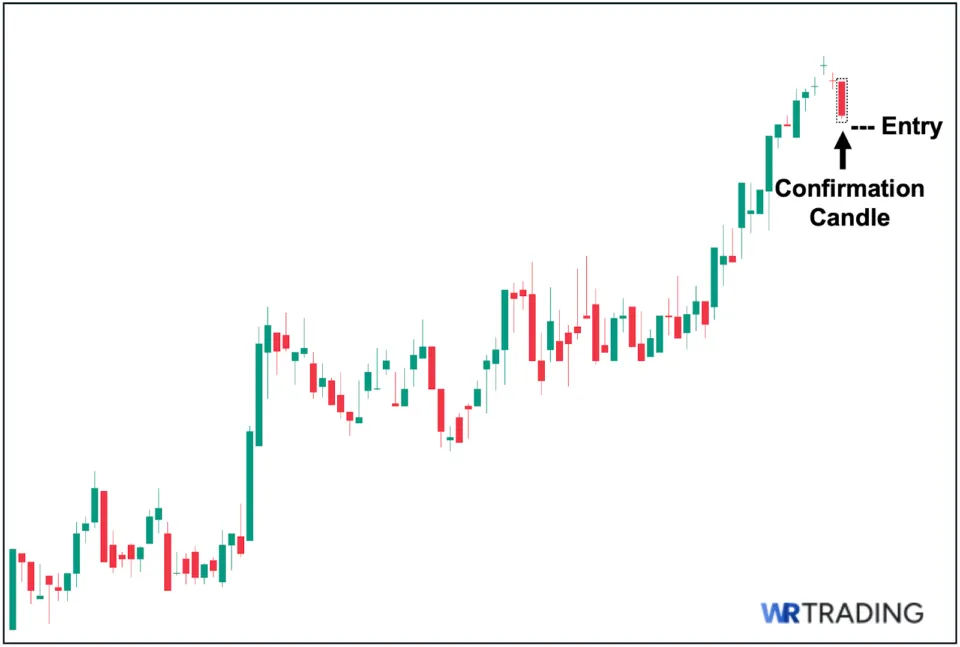
Second, if you intend to use the tri-star doji as part of an established trend reversal strategy, then waiting for a confirmation signal is crucial. As we can see in the chart above, the tri-star doji pattern formed after a sustained uptrend, with three consecutive doji candles appearing at the very peak. In this case, the ideal scenario is for a decisive bearish confirmation candle to follow the pattern, signaling that a likely trend reversal may be underway.
In this case, that ideal scenario played out, as a long-bodied bearish candle closed decisively below the pattern immediately after, acting as the confirmation signal that market sentiment may have indeed shifted from bullish to bearish. With this confirmation in place, you can now consider your entry strategy. At this point, we recommend either of the following options:
- Aggressive Entry – Placing your long order at the closing price of the confirmation candle.
- Conservative Entry – Placing your long order after the price breaks further below the low of the confirmation candle (as an added layer of assurance).
Step 3: Determine Your Stop Loss (SL) Level
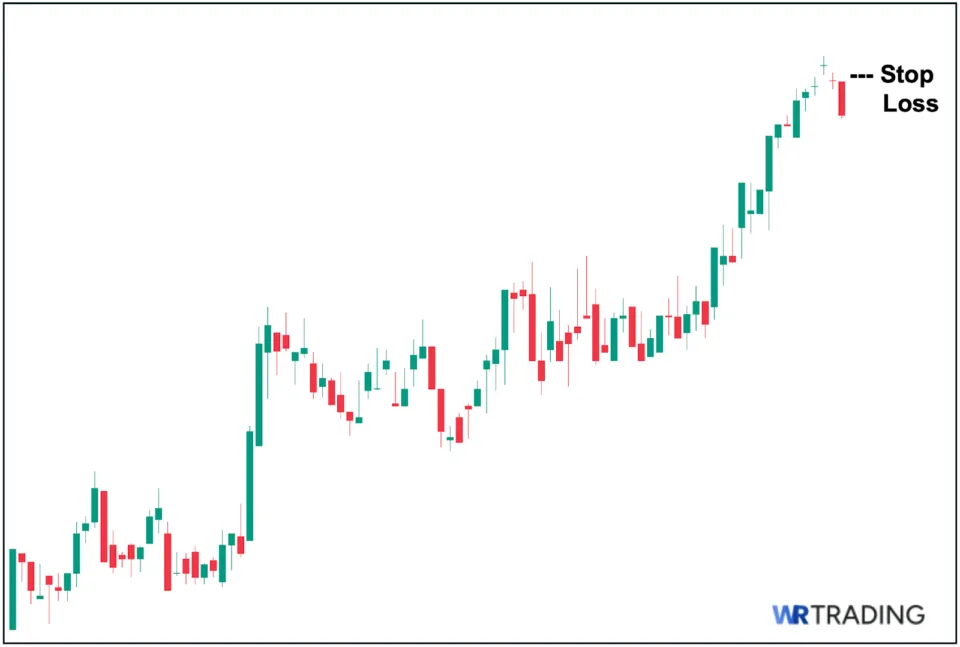
Third, after pinpointing a viable entry point, the next step is for you to determine a clear stop-loss level (a price point where you will, without hesitation, exit the trade if it moves against you). This is essential for protecting your capital, especially in a setup like the tri-star doji, whose standalone reliability is questionable.
In this particular scenario, if the pattern proved to be simply a pause at the top of the uptrend and would eventually continue rather than reverse, the trade would have failed. Hence, to manage your downside risk, we suggest implementing one of the following stop-loss placement options:
- Tighter Stop Loss – Placing your stop loss just above the high of the confirmation candle (see the image above for illustration).
- Wider Stop Loss – Placing your stop loss above the high of the tri-star doji’s 3rd candle.
Step 4: Set Your Target Price (TP)
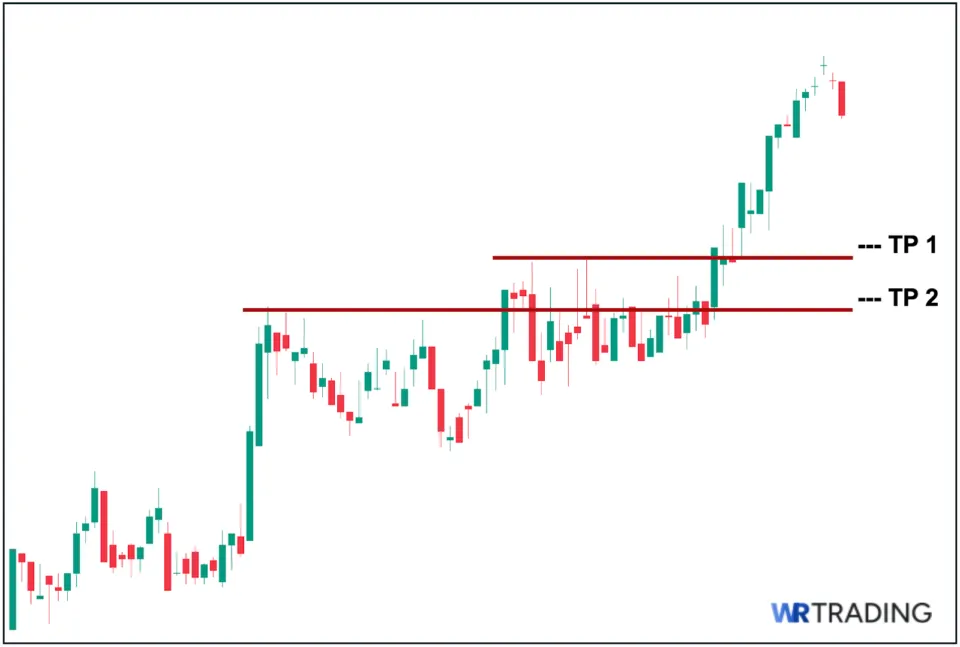
Fourth, you then need to determine your target price or prices (TPs), essentially the levels at which you plan to secure your profits if the trade moves in your favor. In this specific case, if the tri-star doji pattern successfully leads to a sustained bearish trend reversal.
At this stage, we also recommend selling in tranches (as illustrated above), as this would allow you to capture more profit if the downward pressure continues beyond your initial target. As illustrated, we suggest placing at least 2 target prices (TPs) based on key structural price levels where the price may encounter buying pressure or slow down. These structural levels help ensure that your exits are based on logical market behavior rather than doing guesswork.
Step 5: Open the Trade
The last step is to finally/officially open the trade by simply following the first four steps we outlined. Namely: first, confirm that the tri-star doji pattern is valid; second, determine your entry point based on the confirmation candle; third, place your stop-loss order at a logical level to manage downside risk; and fourth, set your target price levels on key structural price zones.
Furthermore, we strongly recommend only taking trades with a reward-to-risk ratio of at least 2:1. This means that the distance between your entry and your first TP level should be at least twice the distance between your entry and stop-loss level. Maintaining this ratio helps ensure that your profitable trades more than make up for (or offset) any losses over time.
Is the Tri-Star Doji Bullish or Bearish?
Unlike other doji patterns, which are inherently neutral, the tri-star doji can (while not completely decisive) be either bullish or bearish, depending on where it forms in the trend. Remember that if the tri-star doji forms after a sustained downtrend, we then classify it as a bullish tri-star doji, as it suggests that selling momentum may be weakening and a potential reversal to an uptrend could eventually follow. Conversely, when the pattern appears at the top of an uptrend, we classify it as a bearish tri-star doji, as it implies that buying pressure is now fading and a reversal to the downside may soon follow.
(Learn To Trade And Read Candlestick Patterns Like A Pro)
The Best Trading Strategies for the Tri-Star Doji:
The following are three of the best trading strategies to utilize alongside the tri-star doji pattern:
1. Trading the Tri-Star Doji with RSI
RSI Settings: Default (14 SMA, 2 Standard Deviation)
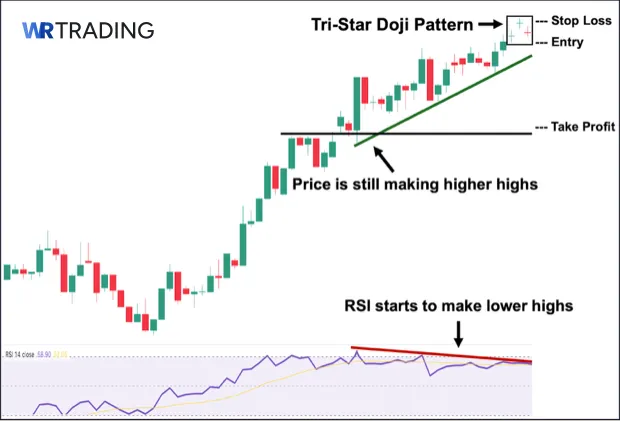
First, the tri-star doji pattern can be paired with RSI divergence to further strengthen its potential as a trend reversal signal. An RSI divergence happens when the RSI moves in the opposite direction of the price. When this happens, the momentum behind the current trend may be weakening. In technical analysis, this type of divergence is widely regarded as a leading indicator, as it suggests a possible reversal before the price action confirms it.
To illustrate, we can observe in the chart above that while price continues to make higher highs, the RSI begins forming lower highs, creating a bearish divergence. In this case, the emergence of the tri-star doji serves as confirmation that a potential trend reversal may be underway. In other words, if we see a tri-star doji pattern and open the RSI indicator and see a divergence, then that adds another layer of confidence that a trend reversal may likely occur.
How to Trade (Trade Setup):
- Entry: Place your entry just below the low of the tri-star doji’s 3rd candle (remember, wait for a confirmation candle to first appear).
- Stop Loss: Place your stop loss just above the high of the tri-star doji’s 3rd candle.
- Take Profit: Place your TP a few ticks above (before) the nearest key structural level.
2. Trading the Tri-Star Doji with Moving Average
MA Settings: Simple Moving Average (MA Length: 50)
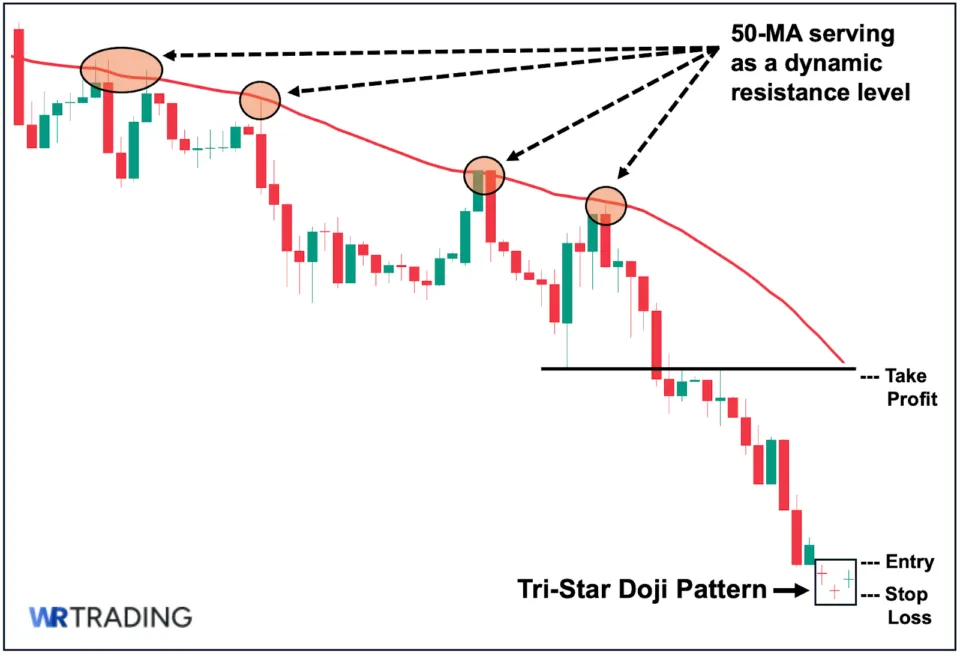
Second, the 50-day simple moving average (50 MA) can also be used to identify a medium-term dynamic support zone (during an uptrend) or resistance zone (during a downtrend). In a prevailing uptrend, the 50 MA often acts as a support level, preventing the price from falling lower. In a downtrend, it can serve as a resistance level, preventing the price from going further.
In the example above, we can see that the price has been on an established downtrend, as the 50 MA has repeatedly prevented further bullish rallies beyond it. Hence, it will most likely serve as the “ceiling” for any potential bullish rally caused by the tri-star doji pattern. Having said this, if we are to proceed with this trade, then we must keep a close eye on the 50 MA, especially when the price is nearing it, as it will likely serve as a major resistance level.
How to Trade (Trade Setup):
- Entry: Place your entry just above the high of the pattern’s 3rd candle.
- Stop Loss: Place your stop loss just below the low of the pattern’s 3rd candle.
- Take Profit: Place your TP a few ticks just below (before) the 50-MA. As the MA will most likely serve as a major resistance, seeing how it has served as the ceiling beforehand, preventing price from moving above it.
3. Trading the Tri-Star Doji with Market Structure
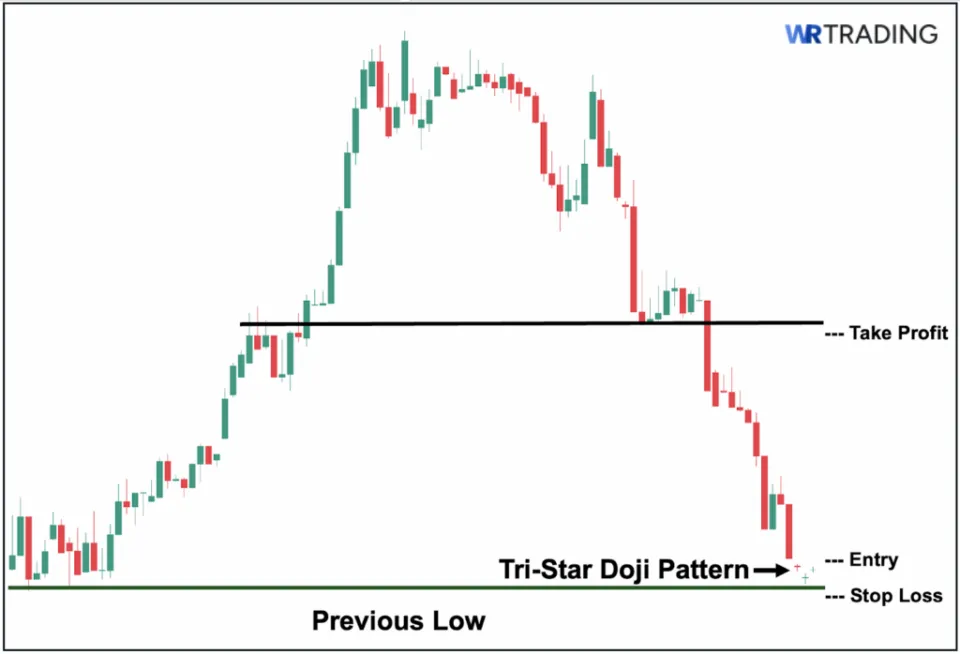
Finally, you can also apply a fundamentally structural approach to technical analysis by considering the broader market context in which the tri-star doji appears. This involves zooming out on the price chart and assessing whether the pattern aligns with any historically significant levels, such as prior major support or resistance levels. Compared to other technical indicators, focusing on market structure provides a more direct and unfiltered view of how prices have actually moved in the past.
To illustrate, in the chart above, we can see that the lowest wick of the tri-star doji cluster aligns with a well-established support level (previous low). Furthermore, we can observe that this level has also successfully held in the past and even triggered a strong bullish bounce, leading to an eventual uptrend. With this in mind, the appearance of the tri-star doji at this zone strengthens the case that buyers may once again step in, making a potential trend reversal more likely than a break below this support line (previous low).
How to Trade (Trade Setup):
- Entry: Place your entry just above the high of the tri-star doji’s 3rd candle (remember, wait for a confirmation candle to first appear).
- Stop Loss: Place your stop loss a few ticks below the major key support level (the previous low).
- Take Profit: Place your TP a few ticks above (before) the nearest key structural level.
(Learn To Trade And Read Candlestick Patterns Like A Pro)
What is the Success Rate of the Tri-Star Doji Pattern?
While the tri-star doji is technically considered as a reversal pattern, it is not a decisive reversal pattern when viewed in isolation, especially when compared to much stronger patterns such as the morning star and evening star. That said, if the tri-star doji is immediately followed by a strong confirmation candle, the success rate of a reversal playing out typically falls within the 50–60% range.
This percentage can be improved further when the pattern is supported by other technical confirmation tools, such as an RSI divergence or a relevant moving average. Still, it’s important to keep in mind that the reliability of the tri-star doji ultimately depends on the market environment, the asset being traded, and, of course, the overall strength of your trade setup.
What are the Pros and Cons of the Tri-Star Doji?
Pros
- Stands out due to its unique appearance
- Can pinpoint overextended trends
- Psychologically significant
Cons
- Extremely rare
- Not a reliable standalone signal
- Subjective wick and gap criteria
What are the Advantages of the Tri-Star Doji Pattern?
Here are the notable advantages of using the tri-star doji as part of your trading strategy:
- Stands out due to its unique appearance: First, despite being extremely rare, its unique appearance makes it stand out on the chart. Hence, it is relatively easy to identify and potentially use it in a trade. In contrast, other patterns, especially most doji variants (which are one-candle patterns), are relatively more difficult to identify immediately.
- Can pinpoint overextended trends: Second, due to its significance in reflecting a loss of momentum, the pattern is often highly useful when it appears during an overextended trend (a trend that continues despite the lack of any new catalyst).
- Psychologically significant: Third, the tri-star doji also reflects a valuable market psychology, as it represents a prolonged indecisive action from both buyers and sellers, with neither party taking control of the price. In fact, the reason the pattern is considered a reversal pattern is not because of the sudden shift in market sentiment, but rather due to the slow yet continuous loss of momentum of the party that you expect to control the trend.
What are the Disadvantages of the Tri-Star Doji Pattern?
Here are the key disadvantages you need to be aware of when using the tri-star doji:
- Extremely rare: First, the mere fact that the tri-star doji appears extremely rare already limits its practical application, as it is unlikely to be seen regularly. Hence, this makes it unwise to base your trading strategy around it, as you cannot reliably count on it to show up on a regular basis.
- Not a reliable standalone signal: Second, despite technically being considered a “reversal pattern,” the tri-star doji is relatively weaker compared to more well-known patterns such as bullish and bearish engulfing, as well as morning and evening stars. This is due to the fact that, unlike the mentioned patterns, the tri-star doji is composed of 3 dojis, which are inherently indecisive. Hence, we highly discourage using it without complementary technical confirmation tools.
- Subjective wick and gap criteria: Third, there is really no universally agreed-upon standard for the gap size and even the wick size of the 3 dojis. Hence, this can lead to inconsistent or even inaccurate interpretations. In fact, if you search the tri-star doji and click the “image” portion in Google search, you will see a wide variation of what is considered a “tri-star doji.”
Can the Tri-Star Doji Produce False Signals?
Yes, similar to any other candlestick pattern, the tri-star doji is not immune to producing false signals. This holds true even though it is often viewed as an extremely rare occurrence. In fact, due to it being a relatively weaker reversal pattern (when compared with other, much stronger patterns), it tends to produce false signals, particularly when viewed on its own and without any confirmation.
Regardless, even if it is followed by a confirmation candle or is supported by another technical confirmation tool, it’s important to understand that no candlestick pattern in technical analysis, including the tri-star doji, can guarantee 100% accuracy or reliability. At the end of the day, and as part of normal trading, they can and they will produce false signals.
What are the Alternatives to the Tri-Star Doji Pattern?
The following are arguably two stronger potential alternatives to the tri-star doji pattern:
1. Evening Doji Star
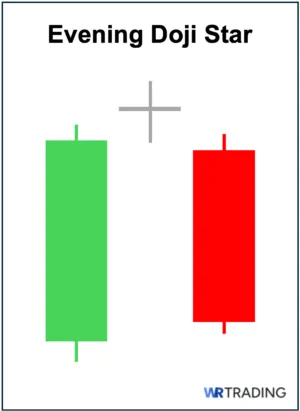
First, unlike the bearish tri-star doji, the evening doji star is a much stronger bearish reversal pattern that signals the potential end of the ongoing upward trend (uptrend). The pattern consists of a long-bodied bearish candle (1st candle), a doji (2nd candle), and a long-bodied bullish candle (3rd candle). Moreover, the evening doji star typically appears more often on the price chart compared with the bearish tri-star doji.
2. Morning Doji Star
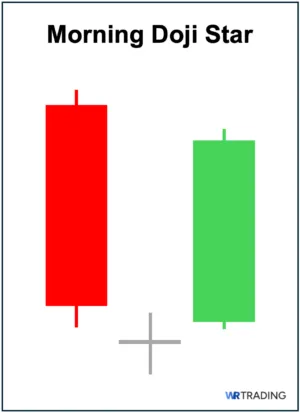
Second, compared with the bullish tri-star doji, the morning doji star is a far more decisive bullish reversal pattern that signals the potential end of the ongoing downward trend (downtrend). The pattern consists of a long-bodied bearish candle (1st candle), a doji (2nd candle), and a long-bodied bullish candle (3rd candle). Moreover, the morning doji star typically appears more often on the price chart compared with the bullish tri-star doji.
What Other Types of Dojis Exist?
Aside from the tri-star doji, here are the other types of doji patterns that you will see on a price chart:
| Doji Type | Description |
|---|---|
| Long-Legged Doji | First, the long-legged doji is one of the most common types of doji, featuring relatively long wicks, especially when compared to a standard doji, which has shorter wicks. |
| Rickshaw Man Doji | Second, the rickshaw man is technically a subvariant of the long-legged doji. Yet, unlike most long-legged dojis (which have uneven upper and lower wicks), the rickshaw man features symmetrical or nearly identical upper and lower wicks. |
| Four Price Doji | Third, the four-price doji is a unique type of doji in which the opening, high, low, and closing prices are all identical. Hence, it appears as a thin horizontal line or a minus sign (–) on the price chart, as it has no real body and no upper or lower wicks. |
| Dragonfly Doji | Fourth, the dragonfly doji essentially looks like the capital letter “T” because it has an extremely small or no upper wick at all, while featuring a relatively long lower wick. |
| Gravestone Doji | Fifth, the gravestone doji is the complete opposite of the dragonfly doji and resembles an inverted capital letter “T.” The pattern features a long upper wick or shadow, accompanied by an extremely small or nonexistent lower wick or shadow. |
| High Wave Doji | Sixth, a high wave doji has “exaggerated” wicks/shadows on both sides (even much bigger than long-legged or rickshaw man dojis). Hence, this makes it literally stand out on a price chart. |
Learn Pattern Trading with the WR Trading Mentoring
As we’ve explored, the tri-star doji is, without a doubt, one of the rarest candlestick patterns you will find on a price chart. While we have laid out some of the best practices in this guide, we take a much more nuanced and deeper approach to more advanced strategic applications of patterns like the tri-star doji in our trading mentoring program at WR Trading. Here, we also teach you how to customize your trading approach based on the specific asset class you trade, whether it’s forex, indices, or commodities, so you can confidently integrate these patterns into your overall trading strategy.
(Learn To Trade And Read Candlestick Patterns Like A Pro)
Tri-Star Doji: A Triple Warning of Fading Momentum
All in all, the tri-star doji is one of the rarest and most distinctive candlestick patterns in technical analysis. Composed of three consecutive doji candles, it reflects an extended period of market indecision, pointing to the fact that neither buyers nor sellers are in active control of price. This prolonged hesitation, especially when it occurs after a strong trend, can serve as a warning sign that the current momentum is starting to waver.
Nevertheless, while the tri-star doji technically carries a reversal signal depending on its position (bullish when it appears at the bottom of a downtrend or bearish when it merges at the top of an uptrend), it should never be used in isolation as it is not a decisive pattern on its own. Instead, a clear confirmation signal, such as a strong follow-through candle or supporting technical indicator, is essential before you consider trading it.
In our trading practice, we treat it with the same level of caution as other indecisive formations and rely heavily on the context and confirmation to determine its validity. In addition, we always check the volume of the three dojis as this can reveal the tendency of the pattern, whether it might just be an extended pause or a precursor to a full-blown trend reversal.