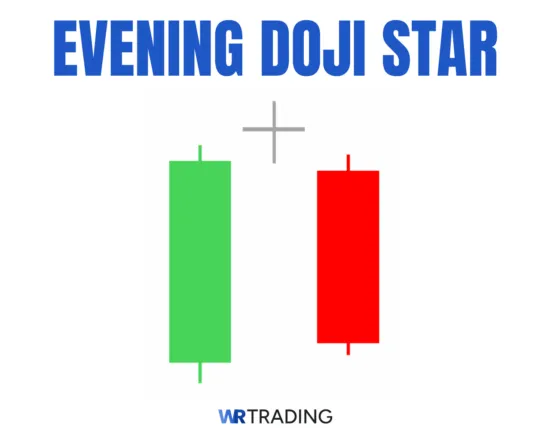
The Evening Doji Star is a three-candle bearish reversal pattern that points toward the likely end of a prevailing bullish trend (uptrend). It is composed of a long-bodied bullish candle (1st candle), a doji (2nd candle), and a long bearish candle (3rd candle). The pattern is considered to be a stronger variant of the classic Evening Star formation, where instead of simply having a short-bodied candle, the second candle is a doji, a point of “true” market indecision. Hence, the pattern’s meaning reflects the gradual shift in market sentiment from bullish (first candle), to indecisive (second candle), and ultimately to bearish (third candle), making it a rare yet extremely valuable signal for a reversal strategy.
Here’s the Key Facts and Pattern Specifications of the Evening Doji Star:
- Type of Pattern: Bearish Reversal Pattern
- Pattern Construction
- First Candle: A long-bodied bullish (green) candle
- Second Candle: A doji (a candle which lacks a body)
- Third Candle: A long-bodied bearish (red) candle
- Trend Prior to the Pattern: A strong uptrend
- Trade Forecast: A potential trend reversal from uptrend to a downtrend
- Opposite Pattern: “Morning Doji Star,” which is a strong bullish reversal pattern
- Stop Loss Placement
(Learn To Trade And Read Candlestick Patterns Like A Pro)
How Does the Evening Doji Star Form?
The evening doji star is a three-candlestick pattern that forms at the top of a prevailing uptrend. It is composed of a long-bodied bullish candle (1st candle), a doji (2nd candle), and a long bearish candle (3rd candle). Hence, the pattern spans three candlestick periods (e.g., three days on a daily chart or three hours on an hourly chart).
Note: As a bearish reversal pattern, any candlestick formation that resembles or “looks like” the evening doji star but appears during a downtrend is invalid, since the prevailing trend is already bearish. Likewise, if it appears during a non-trending (sideways-moving) period, it is also invalid, since there is no active trend to reverse to begin with.
What Does the Evening Doji Star Pattern Mean?
The evening doji star pattern signifies the likely end of an ongoing uptrend and a potential sudden shift towards a bearish trend (downtrend). To break it down further, here’s the comprehensive market psychology behind its interpretation in technical analysis:
1st candle meaning: As a long-bodied bullish candle, it reflects a strong buying pressure that points to a continuation of the ongoing uptrend. Furthermore, in market psychology, it illustrates buyers’ decisive control of price action.
2nd candle meaning: As a doji, the 2nd candle, which initially opens even higher (i.e., making a gap up) made it seem like the price will likely continue the bullish rally. That said, despite the buying pressure, the candle ultimately closes at the same price it opens with.
In market psychology, this illustrates the struggle of control for price’s direction. It shows uncertainty of where the price may go next as the selling pressure is strong enough to halt the bullish rally. Nevertheless, in technical analysis, this is not a decisive indication that price will indeed start a bearish reversal, as a doji, by nature, is indecisive.
3rd candle meaning: Finally, the third candle, a long-bodied bearish candle closing below the 50% of the first (bullish) candle, acts as the “confirmation” that the market sentiment has officially shifted from bullish to bearish. This is because the 3rd candle essentially erased much of the 1st candle’s gain. Hence, in market psychology, it illustrates how sellers have overwhelmed buyers and are now decisively controlling the price action.
How to Identify the Evening Doji Star Pattern?
Being a unique variation of an already rare pattern (i.e., the evening star), the evening doji star is among the rarest and most elusive candlestick formations you will see in a chart. That said, for it to be a valid evening doji star, here’s the characteristics that it must possess when it formed:
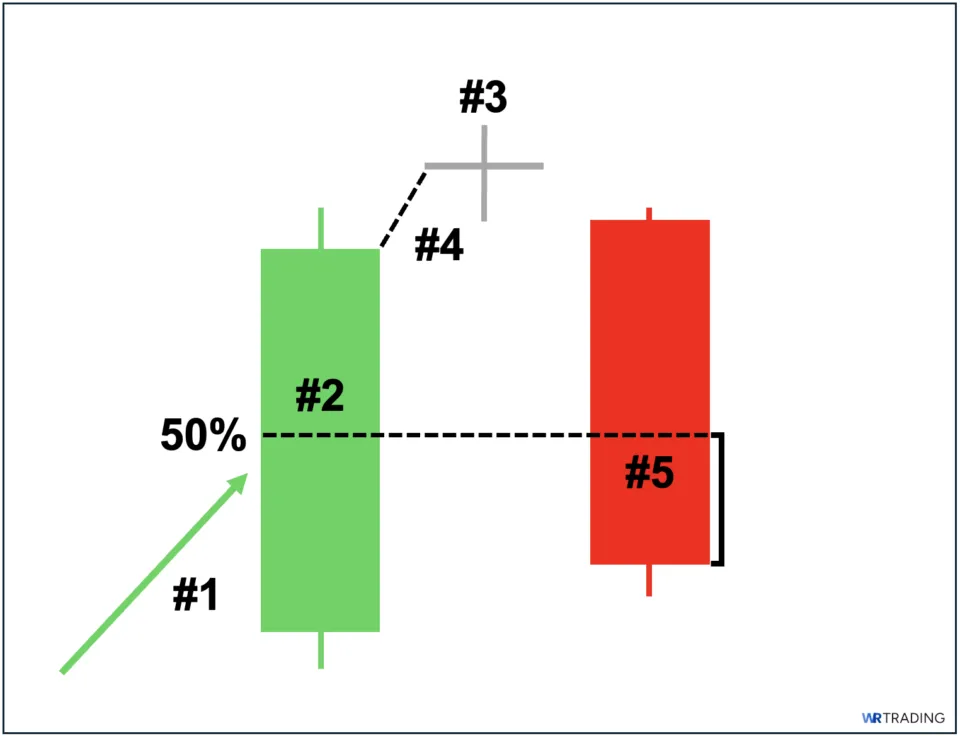
- Chart Placement: First of all, a valid evening doji star pattern must occur (be structured) at the top of a prevailing uptrend. Otherwise, if it formed during a downtrend or sideways-moving period, then it is completely invalid. Therefore, only search for the pattern’s characteristics on charts that are clearly trending upwards.
- First Candle: It must be a relatively long-bodied green/white (bullish) candle.
- Second Candle: It must be a doji (a candle which lacks a body).
- Second Candle’s Gap Up: The 2nd candle’s opening price must be noticeably above the first candle’s closing price, creating a visually-identifiable gap.
- Third Candle: It must be a relatively long-bodied red/black (bearish) candle. It also needs to close below the halfpoint (50%) of the first candle’s body.
Unlike the first five characteristics, a gap down on the third candle (where its opening price is noticeably lower than the second candle’s closing price) is not technically required for the pattern to be valid. Nevertheless, it is often considered a “bonus” confirmation if it occurs, as it highlights the decisive control of sellers from opening to closing
(Learn To Trade And Read Candlestick Patterns Like A Pro)
What is an Example of the Evening Doji Star Pattern?
In this example, we can observe a strong prevailing uptrend. Then, an evening doji star pattern, exhibiting all five characteristics required for validity, suddenly formed at the top of the trend. In this case, the pattern serves as a reversal signal that the uptrend may be ending and could mark the beginning of a bearish trend. This scenario ultimately played out, as a downtrend eventually followed.
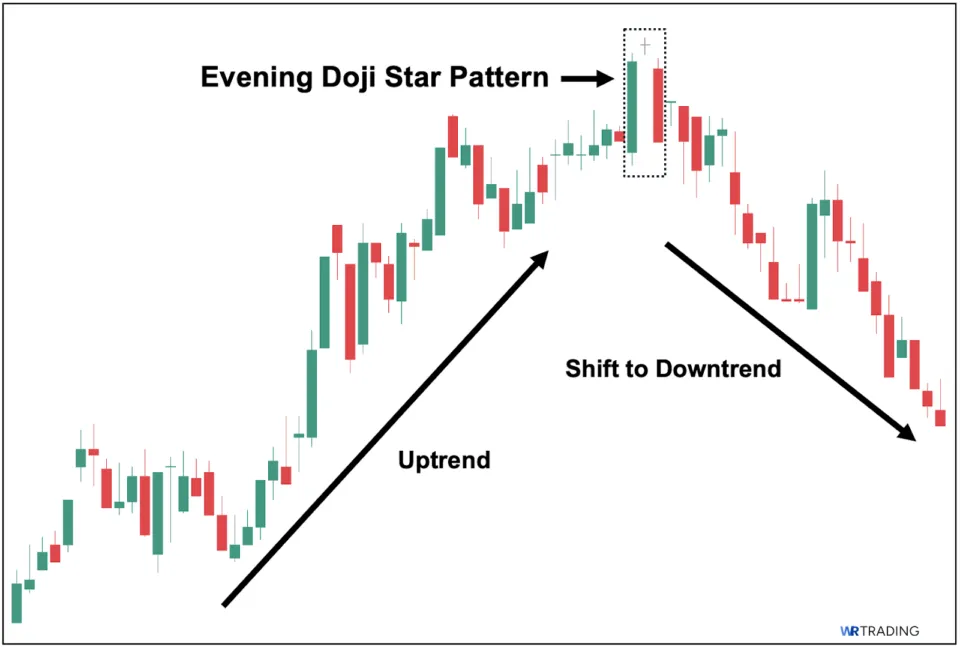
This makes the evening doji star a valuable signal for a reversal strategy that can be applied across different asset classes (e.g., forex, stocks). Visually, the pattern’s doji (as shown in the example above) marked the turning point in market sentiment, shifting from clearly bullish (1st candle) to suddenly bearish (3rd candle).
How to Trade the Evening Doji Star Pattern: A Comprehensive Guide
Here is a simple 5-step process you can follow to start trading stocks, forex, and others using the evening star pattern:
Step 1: Identify a Valid Evening Doji Star Pattern – When Does It Appear?
First and foremost, you need to ensure that you’re identifying a valid evening doji star pattern. As a bearish reversal pattern, the most important criterion is that it must appear at the top of an established uptrend.
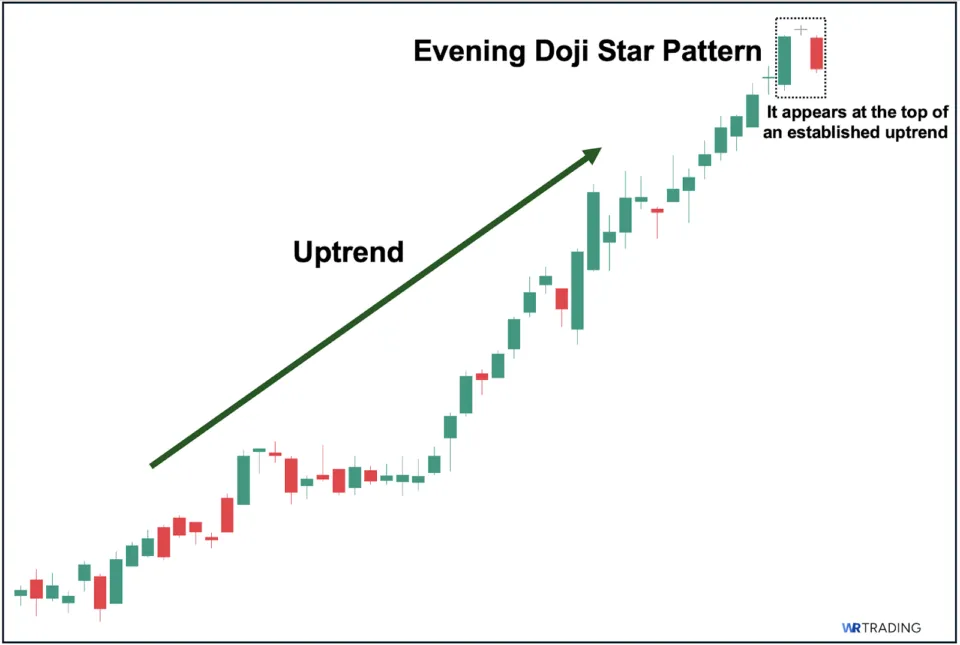
Hence, you should only look for this pattern on upward-moving price charts and ignore any candlestick formation that resembles it but appears either during a downtrend (since the trend is already bearish, so it’s just a sign of trend continuation) or sideways market (since there is no trend to reverse to begin with).
Step 2: Determine Your Entry Point and Position Size
Second, once you’ve confirmed that the pattern is valid, the next step is to determine your position size (the capital you allocate to the trade) and your entry point for a potential short position. For your entry, you can choose between:
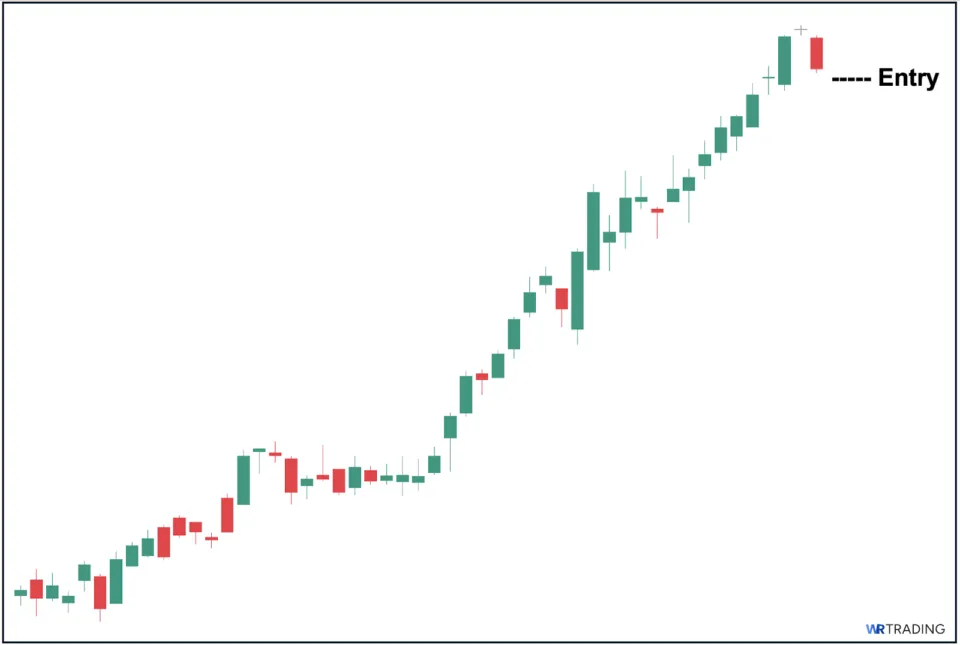
1. Aggressive Entry – This involves placing a short position at the close of the pattern’s third candle. In this case, you’re anticipating that the bearish (red) third candle will immediately trigger a successful reversal into a downtrend.
This type of entry offers higher profit potential if the pattern does indeed lead to a decisive bearish reversal. That said, it also carries more risk if the price fails to reverse immediately, or worse, if the next candle turns out to be a strong bullish (green) candle, which effectively invalidates the pattern and instead points to the continuation of the existing uptrend.
2. Conservative Entry – In contrast to the first type of entry, a conservative entry waits for the price to break below the low of the pattern’s third candle (see image above) to confirm the strength of a potential bearish move.
This lowers the risk that the evening doji star is merely a false bearish reversal signal. Nevertheless, if the price moves aggressively downward immediately, you may be left with a suboptimal entry point and reduced profit potential.
Step 3: Determine Your Stop Loss (SL) Level
Third, after identifying your entry, you must then determine your Stop Loss point where you will exit the trade to cut your losses if the price moves upward instead. Here, you can choose either:
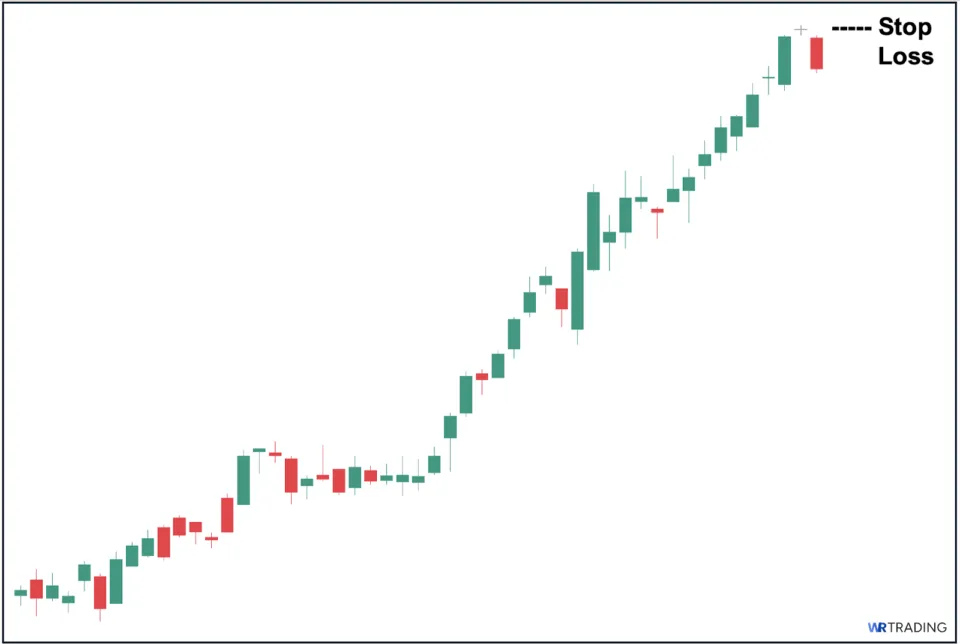
1. “Tighter” Stop Loss – This involves placing your stop loss (exit) order just above the third candle’s high (see above image for illustration).
2. “Wider” Stop Loss – On the other hand, you can instead place your stop loss (exit) order just above the high of the second candle (the pattern’s doji).
A tighter stop loss reduces the amount of risk you take (since it’s closer to your entry), but it can also be triggered prematurely if the price makes large swings before transitioning into a decisive downtrend. In contrast, a wider stop loss lowers the chance of being triggered prematurely but comes at the cost of a greater downside risk, since it’s placed farther from your entry.
Step 4: Set Your Target Price (TP)
Fourth, you also have to identify your target price/s where you will exit the trade if the trade goes in your favor. We recommend selling in trances (i.e., having more than one TP) so you can capture a larger profit potential in case the downtrend extends significantly.
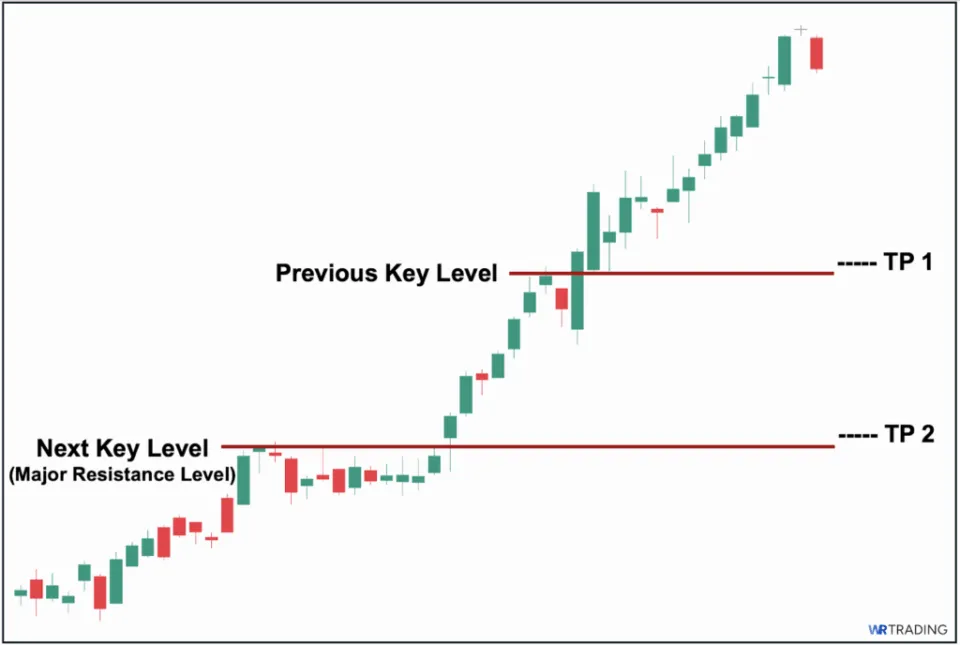
To illustrate, you can see in the image above that we placed two TPs. Note that it’s crucial your TPs are based on an objective metric such as price structures, potential key levels where price may encounter significant buying pressure that could prevent further continuation of downward price movement.
Step 5: Open the Trade
Lastly, after you pinpointed your entry, stop loss, and target prices, the final step is to officially open the trade at your selected entry point and set up your stop loss and target prices orders. In this way, you will prevent a potential emotional or impulsive response if you entered the trade with no plans (i.e., no stop loss and target prices).
For your trading strategy, we also recommend that you only take positions with at least a 1:2 risk-reward ratio, meaning the potential upside is at least 2x the potential downside if the trade does not go in your favor.
Is the Evening Doji Star Bullish or Bearish?
The evening doji star is explicitly bearish by nature, as it is universally recognized as a bearish reversal pattern. It reflects a gradual shift in market sentiment, from bullish (first candle), to indecisive (second candle), and ultimately to bearish (third candle). Hence, the pattern’s underlying meaning and market psychology reinforce this thesis.
(Learn To Trade And Read Candlestick Patterns Like A Pro)
What Are the Best Trading Strategies for the Evening Doji Star?
If you’re looking to use the evening doji star pattern to trade different asset classes, such as stocks and forex, here are three of the best technical analysis strategies you can incorporate into your trading approach:
1. Trading the Evening Doji Star with RSI
RSI Settings: Default (14 SMA, 2 Standard Deviation)
First, you can complement the evening doji star with the RSI indicator, specifically as a divergence tool. In technical analysis, when the RSI deviates against the direction of the price movement (in this case, the RSI trends lower as price makes higher highs), it could be a sign of weakening momentum and a potential upcoming trend reversal. Hence, this makes the evening doji star and RSI combination incredibly advantageous to use.
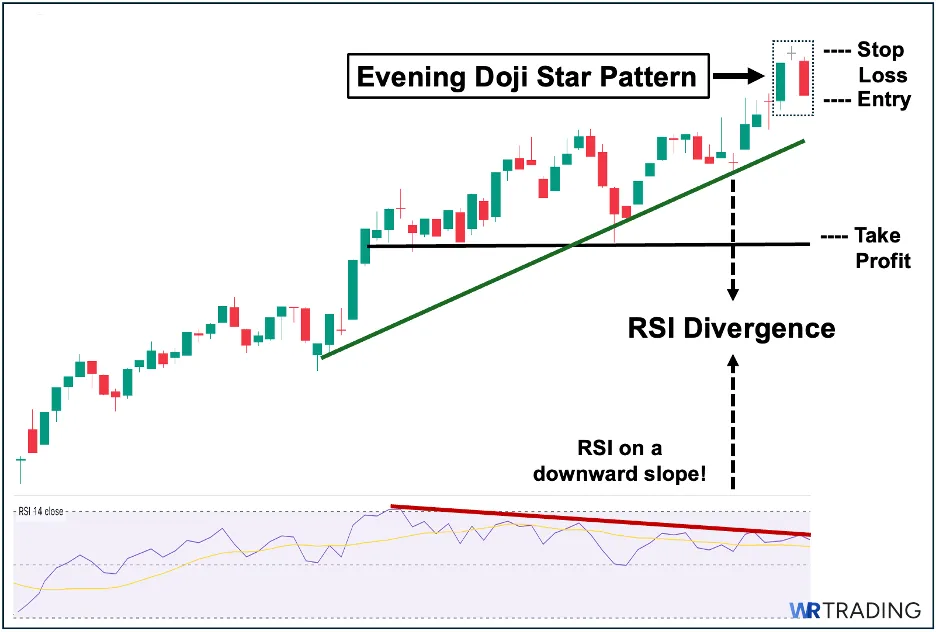
As shown, we can clearly see a strong uptrend as the price continuously makes higher highs. Then suddenly, a doji occurred at the top of the trend, and is followed by a bearish candle. This formed the evening star pattern. If we check the RSI, we could see that it has been making lower highs. Hence, the pattern essentially serves as a “confirmation” that a bearish trend reversal will likely follow soon after.
How to Trade (Trade Setup):
- Entry: Place your entry just below the low of the evening doji star’s third candle.
- Stop Loss: Place your stop loss just above the high of the evening doji star’s third candle
- Take Profit: Place your TP just above the nearest key structural level.
2. Trading the Evening Doji Star with Volume
Volume Settings: Default (MA Length: 20)
Compared with other technical indicators, volume is one of the few that is completely independent of price. Hence, using it in combination with price can help us improve our interpretations, as volume gives a candlestick pattern an added meaning and significance.
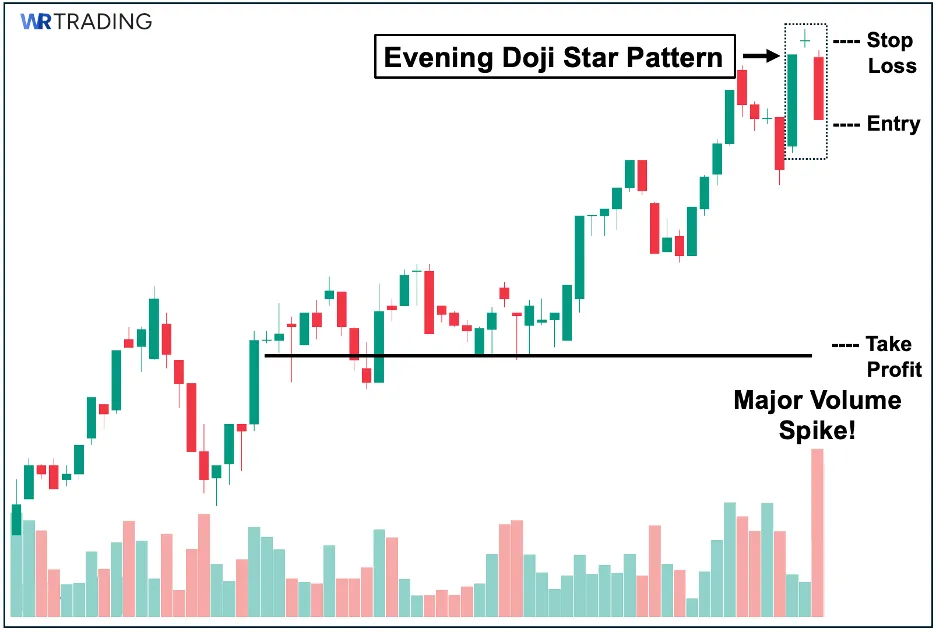
As shown in the image above, we can see a prevailing uptrend. Suddenly, a doji occurred at the top, and was then followed by a bearish candle. This formed the evening star pattern. If we check the volume below, we can see a sudden spike in the pattern’s third candle. This above-average volume serves as confirmation of significant selling pressure and bearish momentum that could ultimately lead to a downtrend.
How to Trade (Trade Setup):
- Entry: Place your entry just below the low of the evening doji star’s third candle.
- Stop Loss: Place your stop loss just above the high of the evening doji star’s third candle.
- Take Profit: Place your TP just above the nearest key structural level.
3. Trading the Evening Doji Star with Market Structure
Lastly, one of the best technical analysis approaches is to trade the evening doji with consideration of the overall market structure. This is done by literally zooming out the chart to see if the price is approaching a key structural level. Unlike using technical indicators that could provide key price levels, the historical price structure is a static form of resistance that tends to become more significant as time passes by.
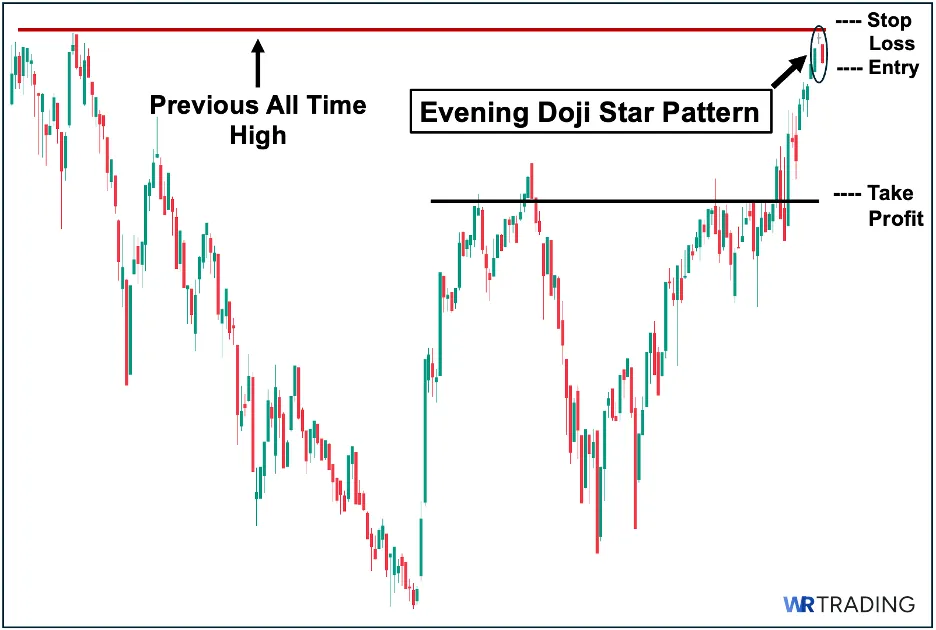
As illustrated, the price hit an all-time high (the peak) but was unable to sustain this bullish momentum, leading to a major downtrend that followed. After the price recovered, it then led to a renewed bullish rally (uptrend) to try and break the all-time high. However, at the top, a doji occurred, and was then followed by a bearish candle, forming an evening star pattern.
This combination of price failing to break through a major resistance level, along with the formation of an Evening Star pattern, makes a compelling case for bearish confirmation. It signals that buyers are once again unable to sustain the bullish momentum needed to break resistance, while growing bearish sentiment could fuel a potential trend reversal into a downtrend.
How to Trade (Trade Setup):
- Entry: Place your entry just below the low of the evening doji star’s third candle.
- Stop Loss: Place your stop loss above the all-time high resistance level.
- Take Profit: Place your TP just above the nearest key structural level.
(Learn To Trade And Read Candlestick Patterns Like A Pro)
What is the Success Rate of the Evening Doji Star?
Typically, the evening doji star pattern has a success rate of around 50-60%. That said, the pattern’s success rate ranges depending largely on the asset class, market environment, and your trade setup. This makes it difficult to identify the pattern’s precise success rate because of the many factors that can influence its success rate. In general, its success rate can improve when the pattern’s appearance is supported by complementary technical indicators (e.g., volume, RSI).
What are the Pros and Cons of the Evening Doji Star?
The following are the key pros and cons of using the evening doji star:
Pros
- One of the most reliable candlestick patterns
- Visually represents the gradual shift in market sentiment
- Synergizes well with other technical confirmation tools
Cons
- Infrequent appearance on price charts
- Does not always provide a viable/optimal entry
- Less reliable on lower time frames
What are the Advantages of the Evening Doji Star Pattern?
Here are the key advantages of using the evening doji star as part of your trading strategy:
1. One of the most reliable candlestick patterns
Compared with other candlestick patterns, a valid evening doji star is widely considered as one of the most accurate and strongest reversal patterns. In addition, the pattern works well across different asset classes such as stocks and forex.
2. Visually represents the gradual shift in market sentiment
The evening doji star vividly represents the shift in market sentiment, from bullish (its first candle), to indecisive (its second candle being a doji), and to bearish (its third candle). Hence, the pattern helps in understanding the overall prevailing market sentiment.
3. Synergizes well with other technical confirmation tools
Not only is it a reliable candlestick pattern on its own, it also synergizes with complementary technical tools such as volume and divergences from oscillators such as RSI and Stochastics. These potential synergies further improve its reliability.
What are the Disadvantages of the Evening Doji Star Pattern?
Here are the key disadvantages you need to be aware of when incorporating the evening doji star:
1. Infrequent appearance on price charts
Despite being widely considered as one of the most reliable candlestick patterns, you will rarely see the evening doji star in a price chart in the first place. This rare occurrence limits its potential use case in a reversal strategy as you cannot always count on it to appear.
2. Does not always provide a viable/optimal entry
Since one of the criteria for a valid evening doji star pattern is that it must have a long-bodied third candle, this can inadvertently lead to suboptimal entry points, as the third candle’s closing price may move too far from its highest price. This means that if you place an entry order at the close and set your stop loss order above the third candle’s high, the potential risk-reward ratio can be undesirable.
3. Less accurate on lower time frames
The evening doji star is an example of one of the candlestick patterns that become significantly less accurate when it appears on lower time frames (e.g., hours, minutes), particularly if the asset has low volatility and liquidity in the first place.
Can the Evening Doji Star Pattern Make False Signals?
Yes, the evening doji star, like any other candlestick pattern, can still produce false signals. This holds true despite its reputation as one of the most reliable reversal patterns, largely due to it being an extremely rare variation of the classic evening star and seldom seen on price charts. Remember, no candlestick pattern is 100% reliable or accurate, even when supported by complementary technical analysis tools. Note that we only deal with probabilities in trading, not certainty.
(Learn To Trade And Read Candlestick Patterns Like A Pro)
What are the Alternatives to the Evening Doji Star Pattern?
Here are three examples of bearish reversal patterns you can choose to use instead of an evening doji star:
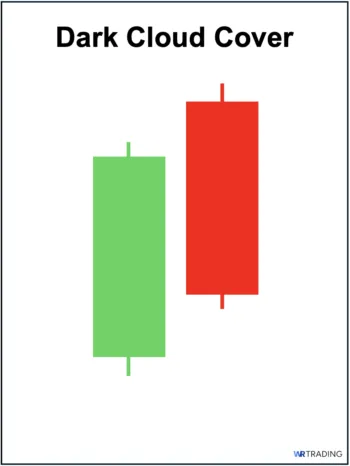
1. Dark Cloud Cover Candlestick Pattern
Compared with the evening doji star, the dark cloud cover is a two-candlestick bearish reversal pattern consisting of a long-bodied green candle, followed by a long-bodied red candle that closes below the midpoint (50%) of the first candle’s body. The pattern illustrates unexpected strong selling pressure, where the second candle wipes out a significant portion of the gains made by the first candle.
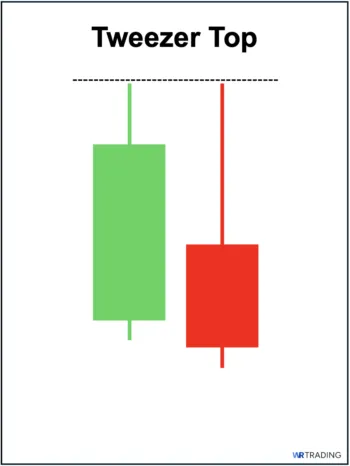
2. Tweezer Top Candlestick Pattern
Unlike the evening doji star, the tweezer top is a two-candlestick bearish reversal pattern consisting of two candles with identical or nearly identical highs. The pattern signifies the presence of a substantial selling pressure (a potential key resistance area) at the top preventing the price from making further bullish move.
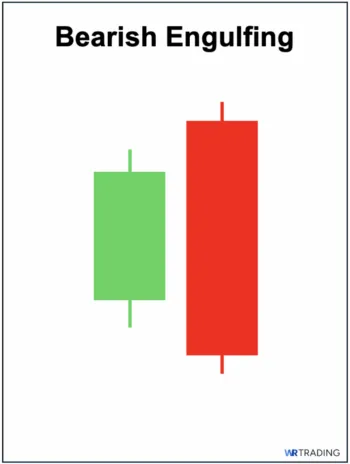
3. Bearish Engulfing Candlestick Pattern
In contrast with the evening doji star, the bearish engulfing is a two-candlestick bearish reversal formation consisting of a small bullish candle followed by a long-ranged bearish candle that entirely covers or the first candle within its body. The pattern shows the decisive shift in market sentiment from bullish to bearish as sellers have completely overwhelmed the buyers.
In our free Candlestick Patterns PDF, you can find more accurate formations for your trading.
What Other Types of Dojis Exist?
Here are the other types of dojis that can appear on a price chart and of which you can use:
- Standard Doji: The standard doji has relatively short symmetrical wicks that make it look like a cross or a plus sign. As a candlestick pattern, the standard doji reflects a neutral market sentiment.
- Rickshaw Man Doji: Similar to a standard doji, the rickshaw man has symmetrical upper and lower wicks. However both of its wicks are significantly larger than those of a standard doji.
- Long-Legged Doji: Similar to the rickshaw man, the long-legged doji also has long wicks on both sides, however, one of its wicks (either upper or lower) is noticeably larger than the other.
- Dragonfly Doji: The dragonfly doji looks like the capital letter “T.” It has extremely small or no upper wick at all while having a long lower wick.
- Gravestone Doji: The gravestone doji is the reverse of the dragonfly doji and looks like an inverted capital letter “T.” It has a long upper wick while having an extremely small or no lower wick at all.
- Four-Price Doji: A four-price doji looks like a minus sign or a hyphen. It does not have any wicks at all since its open, high, low, and close prices are all similar.
- High Wave Doji: A high wave doji has exaggerated wicks on both sides, even much bigger than long-legged or rickshaw man dojis. This makes it literally stand out on a price chart.
- Tri-Star Doji: The tri-star doji is an extremely rare formation consisting of 3 dojis appearing after each other. This type of doji usually occurs when volatility and liquidity in an asset are both extremely low.
Learn Pattern Trading with the WR Trading Mentoring
Trading the evening doji star pattern can become tricky during volatile market periods, such as what we are experiencing right now. That said, in this turbulent time, the evening doji star remains one of the many candlestick patterns we use to trade different asset classes, including forex and stocks. Hence, if you want to want to master candlestick patterns and learn how we adapt on different market conditions, you may join our mentoring class at WR Trading
(Learn To Trade And Read Candlestick Patterns Like A Pro)
Conclusion Evening Doji Star is an Elusive but Powerful Reversal Signal
To sum up, the evening doji star pattern is an undeniably strong bearish reversal formation that only shows up on rare occasions. This presents a dilemma where, although it is widely considered a reliable reversal signal, its few and far between appearances make it a scarce opportunity that traders must patiently wait for. That said, the best approach is to be fully prepared to utilize it effectively when it does appear.