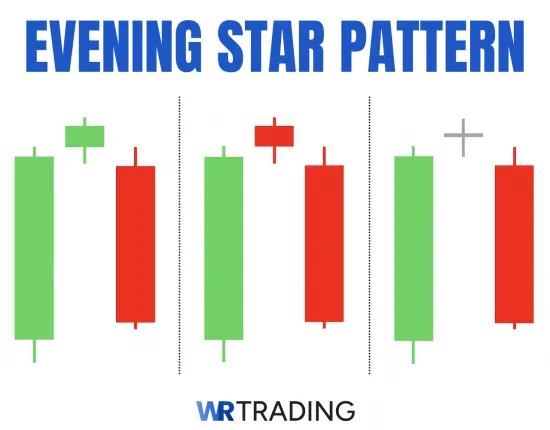
The Evening Star is a bearish reversal candlestick pattern that signals the potential end of an existing uptrend. The pattern consists of three candlesticks: a long green/white candle (1st candle), a short-bodied candle (2nd candle), and a long red/black candle (3rd candle), occurring at the top of an established uptrend. As a reversal pattern, it illustrates a decisive shift in market sentiment from bullish to bearish, potentially leading to a sustained downward move.
How The Evening Star Candlestick Pattern Is Structured:
- Type of Pattern: Bearish Reversal Pattern
- The pattern consists of three candles:
- First Candle: A long-bodied bullish (green) candle
- Second Candle: A short-bodied candle (or a doji, which lacks a body)
- Third Candle: A long-bodied bearish (red) candle
- Trend Prior to the Pattern: An established uptrend
- Trade Forecast: A potential trend reversal from an uptrend to a downtrend
- Opposite Pattern: “Morning Star,” which is a bullish reversal pattern
- Stop Loss Placement: above the second (conservative/wider) or third (aggressive/tighter) candle’s high
What Does the Evening Star Pattern Mean in Technical Analysis?
The evening star pattern indicates the potential end of an existing uptrend and points to a possible transition into a downtrend. Compared with other candlestick patterns, which occur more frequently, you will rarely see an evening star appear in a price chart. This makes it one of the most elusive candlestick patterns.
Here’s the market psychology behind its interpretation in technical analysis:
- 1st candle meaning: In technical analysis, the first candle, being a large bullish candle, reflects a strong buying momentum and clearly points to a continuation of the ongoing uptrend. In market psychology, it shows how buyers are in dominant control of price action.
- 2nd candle meaning: The second candle, which initially opens even higher (making a gap up), supports the first candle’s thesis that price will likely continue the bullish rally. However, despite the buyers’ efforts to push the price much higher, the candle ultimately closes near the opening price (or at the same price in the case of a doji).
In market psychology, this reflects the uncertainty of where the price may go next as the selling pressure is strong enough to halt the bullish rally. That said, in technical analysis, this is not a strong enough indication that price will indeed start reversing as it can technically be viewed as simply a “pause” within the uptrend.
How The Evening Star Candlestick Pattern Is Structured:
- Type of Pattern: Bearish Reversal Pattern
- The pattern consists of three candles:
- First Candle: A long-bodied bullish (green) candle
- Second Candle: A short-bodied candle (or a doji, which lacks a body)
- Third Candle: A long-bodied bearish (red) candle
- Trend Prior to the Pattern: An established uptrend
- Trade Forecast: A potential trend reversal from an uptrend to a downtrend
- Opposite Pattern: “Morning Star,” which is a bullish reversal pattern
- Stop Loss Placement: above the second (conservative/wider) or third (aggressive/tighter) candle’s high
- 3rd candle meaning: The third candle, being a large bearish candle closing below the midpoint of the first (bullish) candle, serves as the “confirmation” that the market sentiment has, in fact, shifted. This is because it essentially erased much of the first candle’s gain. In market psychology, this indicates that sellers have overwhelmed buyers and now control price action.
How to identify the Evening Star Candlestick Pattern?
To identify a valid evening star formation, here are its 5 essential characteristics:
- Chart Placement: The evening star pattern must occur at the top of an established uptrend.
- First Candle: A long-bodied green/white (bullish) candle.
- Second Candle: The pattern’s “star” is a short-bodied candle (or even a doji, which lacks a body). Note that its colour is irrelevant, and it may have either a short or a long wick.
- Third Candle: A long red/black (bearish) candle that must close below the midpoint (50%) of the first candle’s body.
- Second Candle’s Gap Up: The opening price of the second candle must be above the first candle’s closing price, creating a noticeable gap.
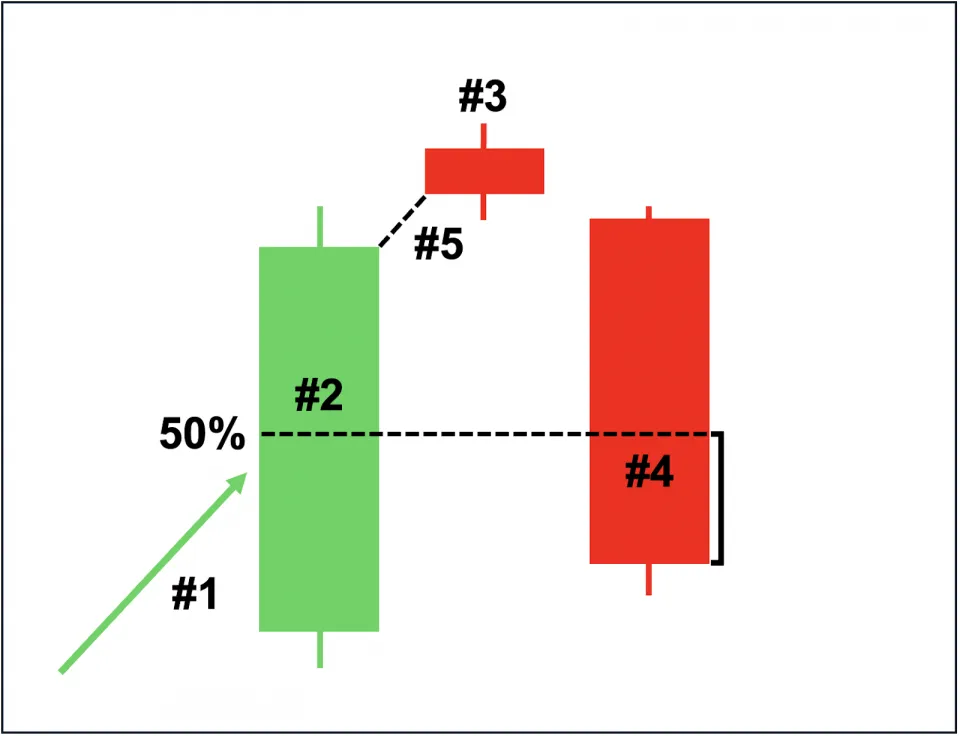
Note: Ideally, the third candle opens below the second candle’s closing price (i.e., creating a gap down), but this is not essential. The more important thing is that the third candle’s closing price must fall below the midpoint of the first candle’s body (see point #4).
Are there different types of the Evening Star Pattern?
Yes, the evening star has 3 types or variations. These differences stem from its second candle’s appearance. Depending on the relative location of the opening and closing prices of the pattern’s second candle, the “star” can appear:
a) First variant – green if the closing price is higher than the opening price,
b) Second variant – red if the closing price is lower than the opening price,
c) Third variant – grey (doji) if the opening and closing prices are identical.
The third variant is also called the “Evening Doji Star” and is largely viewed as a stronger bearish reversal signal compared to the first and second evening star variants.
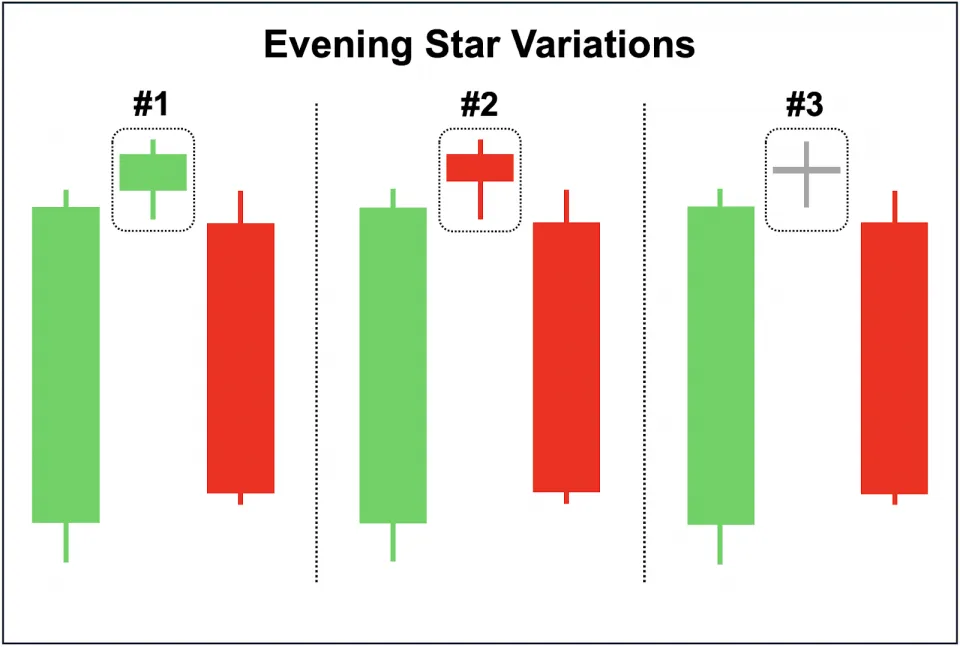
That said, remember that the color of the second candle does not affect the validity of the evening star pattern and it can have either a small or a long wick.
Is the Evening Star Pattern Bullish or Bearish?
The Evening Star Candlestick Formation is bearish and a reversal pattern that signals the potential end of an existing uptrend and the beginning of a possible downtrend.
When does the Evening Star Pattern Occur?
A valid evening star pattern must occur at the top of an established uptrend. Therefore, if you see a candlestick formation that looks like the evening star pattern but occurring either during a downtrend or during sideways (non-trending) period that it is not a valid evening star pattern and must not be used.
(Learn To Trade And Read Candlestick Patterns Like A Pro)
How to Trade the Evening Star Pattern: A Comprehensive Guide
Here is a simple 5-step process you can follow to start trading stocks, forex, and others using the evening star pattern:
Step 1: Identify a Valid Evening Star Pattern – When Does the Evening Star Pattern Appear?
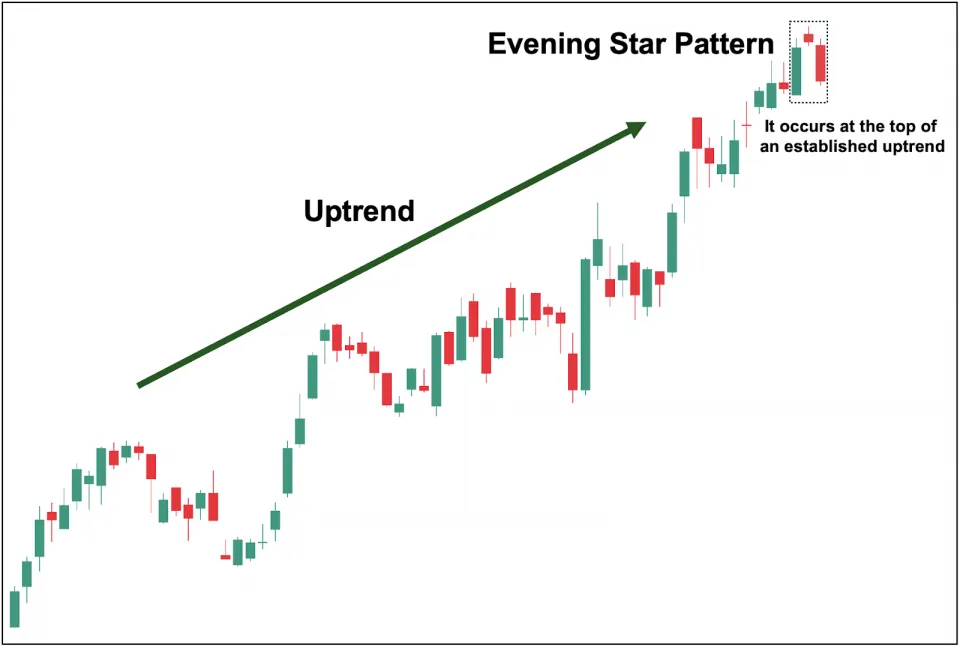
First of all, it is crucial to remember that not all three-candlestick formations that resemble the evening star are valid. Note that an essential requirement for an evening star pattern to be valid is that it must appear at the top of an established uptrend (see above image). Otherwise, it is invalid if you spot the pattern either during a downtrend or a non-trending (sideways) price movement.
This is because the evening star is a bearish reversal pattern. Hence, using it during a downtrend is improper, as market sentiment is already bearish with a downward price trajectory. On the other hand, spotting the pattern during a non-trending (sideways) market is insignificant, as there is no trend to reverse in the first place.
Step 2: Determine Your Entry Point
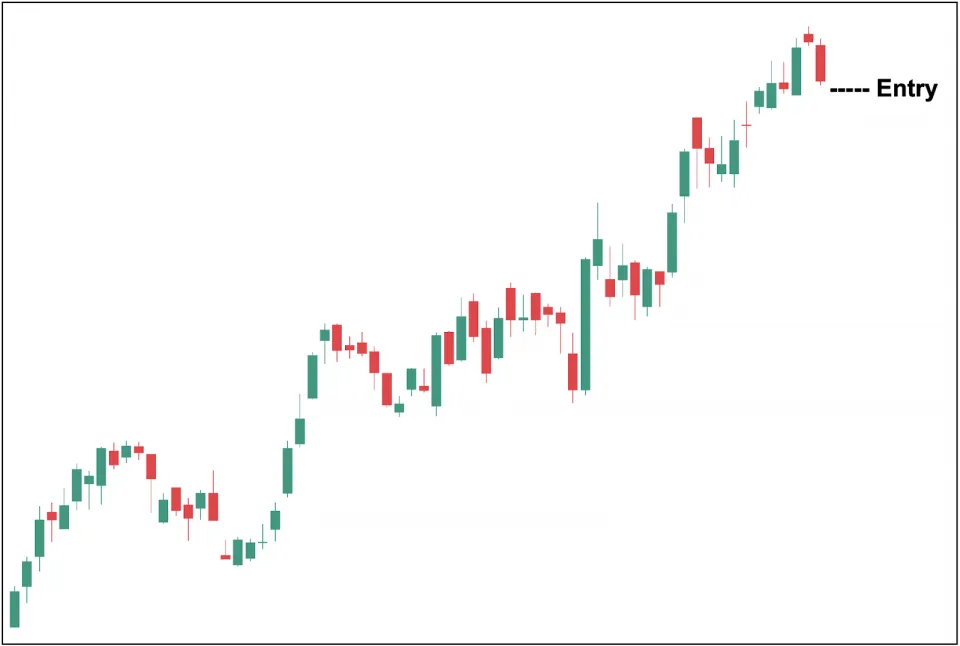
Second, after making sure that the pattern is valid, the next step is to decide where you will place your entry (i.e., a short position). Here, you mainly have 2 options:
1. Aggressive Entry – You enter a short position as soon as the third candle closes. In this scenario, you are confident that the evening star will immediately lead to a bearish countermove.
While you will have a higher upside if price trends lower (especially if it moves down aggressively and immediately), you are also more prone to a false signal if the price ignores the pattern and continues its bullish rally.
2. Conservative Entry – In this approach, you first wait for price to break below the third candle’s low (see above image) to confirm the bearish momentum.
This reduces the risk that the formation may simply be a false signal. However, the trade-off is that you may have a less optimal entry and lower upside potential if price aggressively moves downward immediately.
Step 3: Determine Your Stop Loss (SL) Level
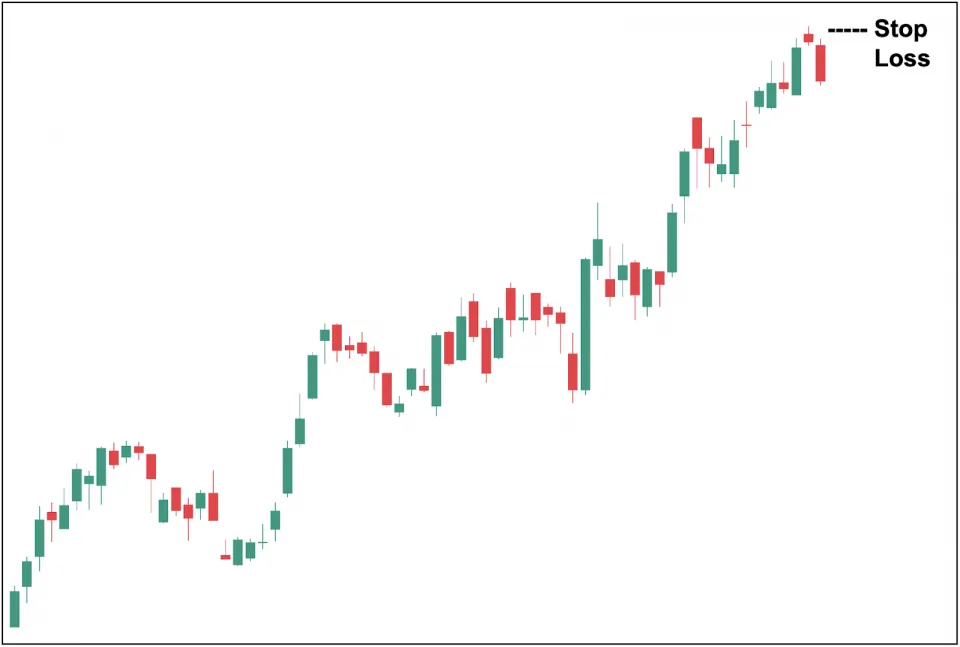
Third, after identifying your preferred entry point, the next step is determining your Stop Loss (SL) level where you will cut your losses if the trade goes against you. Similar to step #2, you primarily have 2 options here:
- Aggressive (Tighter) Stop Loss – You place your SL just above the high of the third candle (see above image). This minimizes the amount of risk you are taking for the trade, but it can also be prematurely triggered if price makes large swings before moving downward.
- Conservative (Wider) Stop Loss – In contrast with the first approach, you can instead place your SL just above the high of the second candle. This reduces the possibility of it being prematurely triggered, but the trade-off is that it increases the risk you are taking for that trade.
Step 4: Set Your Target Price (TP)
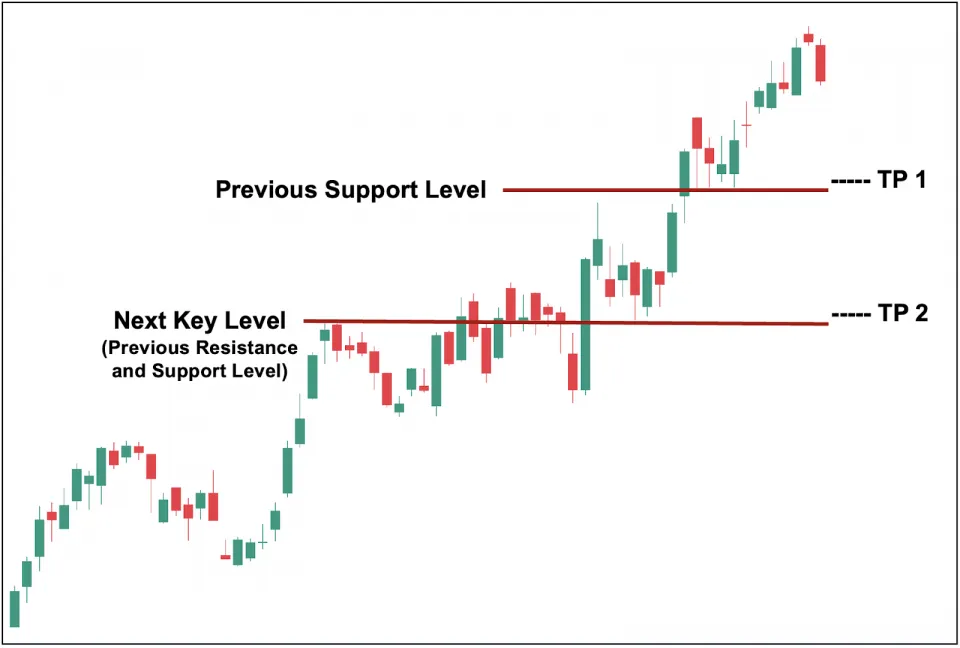
Fourth, you then need to identify where you will exit the trade if it goes in your favor/bias. You can decide whether you prefer to have only one target price to liquidate your position, or sell in tranches (as illustrated in the image above) to take advantage of a more prolonged downward move if ever.
In this step, it is essential to base your target price/s on objective parameters, such as price structures (shown above), where the price is likely to encounter significant market friction or pressure that can prevent further downward move.
TP 1: A few ticks above the nearest structural level (i.e., nearest support level)
TP 2: A few ticks above the next key structural level (i.e., next support level)
Step 5: Open the Trade
Finally, after you clearly identified your entry, stop loss, and target price/s, the last step is to actually open the trade and let it play out. That said, we firmly recommend that you only take trades with at least a 1:2 risk-reward ratio, and the higher the probable reward relative to the risk you take, the better. Never take a trade where you risk more than what you stand to gain.
What are the Pros and Cons of Trading the Evening Star Pattern?
Pros
- Strong bearish reversal pattern
- Easy to pinpoint on a price chart
- Clearly represents market sentiment
- Provides a natural stop loss level
- Works well with confirmation tools
Cons
- A valid evening star appears rarely
- Less reliable without a confirmation tool
- Far less effective on lower time frames
- May not provide optimal entry
- It can and will produce false signals
Here are the key pros of choosing to trade with the evening star pattern:
- Strong bearish reversal pattern: Compared with other candlestick formations, the evening star is widely considered as one of the strongest bearish reversal patterns used to trade forex, stocks, and others.
- Easy to pinpoint on a price chart: Being composed of three candlesticks, the evening star is easy to spot in a candlestick chart when trading stocks, forex, etc.
- Clearly represents market sentiment: The pattern’s appearance gives a clear view of the drastic shift in market sentiment from bullish to bearish.
- Provides a natural stop loss level: The pattern’s second and third candle can be automatically used as the basis of an objective and sound stop loss level.
- Works well with confirmation tools: The evening star can be effectively integrated with confirmation tools such as volume and RSI divergence (we will illustrate this in the latter section).
These are the cons in detail:
- A valid evening star appears rarely: Unlike other candlestick formations that appear more frequently, a valid evening star is much rarer to come by when trading stocks and forex, limiting its practical use case.
- Less reliable without a confirmation tool: Despite being more reliable than other candlestick formations, the evening star’s reliability remains limited if used in isolation.
- Far less effective on lower time frames: The pattern is more effective when it appears on longer time frames. Meanwhile, on shorter time frames (less than a day), it becomes more susceptible to market noise.
- May not provide optimal entry: If the pattern’s third candle closes too low (i.e., making a large gap down and/or a significantly long bearish body), it may not provide an ideal entry relative to the risk.
- It can and will produce false signals: Ultimately, as a candlestick pattern, the evening star is not 100% reliable and it can produce false signals even if it’s used with confirmation tools.
What Is the Success Rate of the Evening Star Pattern?
Generally, the evening star pattern has a success rate of around 55-68%. The pattern’s success rate highly depends on the specific asset class, trade setup, and current market environment. That said, it is difficult to pinpoint its exact success rate due to numerous factors that can influence the pattern’s success rate at any given time. Overall, an evening star’s success rate tends to increase when used with confirmation tools such as volume and RSI divergence.
This is because an above-average volume (preferably at least twice the normal) in the pattern’s third (bearish) candle illustrates how heavy selling pressure overwhelmed buyers, hence confirming the start of bearish momentum. Meanwhile, an RSI divergence occurs when the price forms a higher high leading to the evening star while the RSI forms a lower high, indicating weakening bullish momentum. Both will be illustrated in the section below.
(Learn To Trade And Read Candlestick Patterns Like A Pro)
Can the Evening Star Pattern Produce False Signals?
Yes, despite the fact that the evening star is widely considered to be one of the most reliable bearish reversal patterns, it is not perfect and 100% reliable, and thus it can and will produce false signals like any other candlestick patterns. In fact, even when supported by confirmation tools such as high volume or the presence of an RSI divergence, both of which increase the likelihood of a successful bearish reversal, the pattern can still fail.
Potential Strategies for Trading the Evening Star Pattern
The following are 3 simple potential strategies you can incorporate to trade the evening star pattern:
1. Trading the Evening Star with Volume
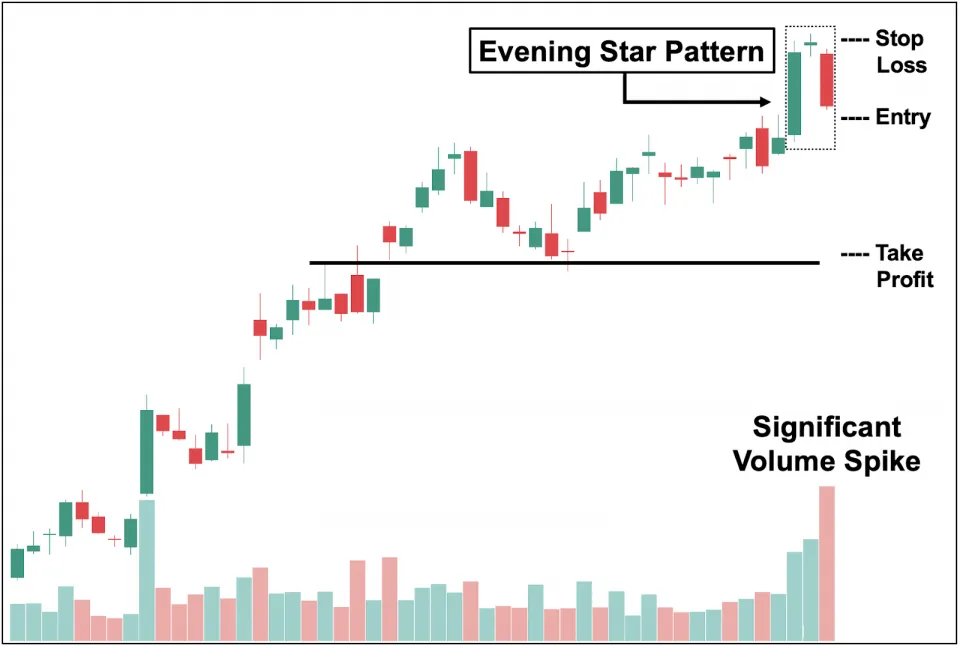
The first strategy you can use is to incorporate volume in your trade analysis. As illustrated above, we can see a valid evening star pattern appearing at the peak of an ongoing uptrend. In this scenario, we can look at the volume to confirm the sell-off needed for a successful reversal to occur.
As shown, we can observe a significant volume spike on the pattern’s third candle. This serves as confirmation of the sell-off and increases the probability that the pattern will lead to a reversal.
Sample Trade:
- Entry: Place your entry just below the low of the evening star’s third candle.
- Stop Loss: Place your stop loss just above the high of the evening star’s third candle
- Take Profit: Place your TP just above the nearest key structural level.
2. Trading the Evening Star with Moving Average
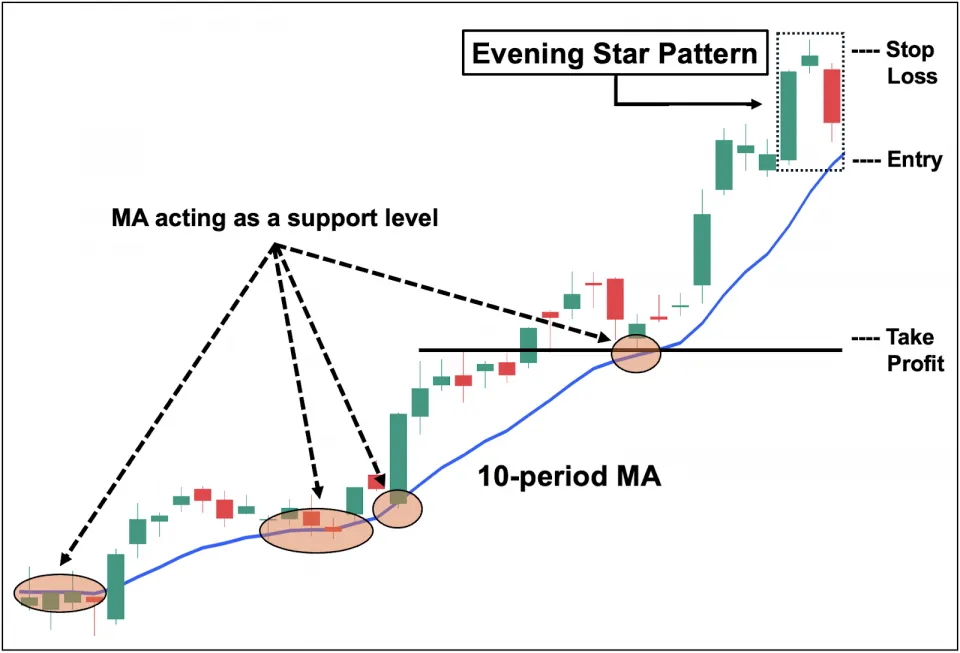
You can also use relevant moving averages (MAs) to help with your trade analysis. As illustrated, we can see an evening star pattern appearing at the peak of an ongoing short-term uptrend. However, instead of just relying on the pattern, we can use a moving average to evaluate the overall trend.
In this example, we used a popular short-term moving average, the 10-day moving average (10 MA), and we can see how it acts as a dynamic support level for the trend. With this in mind, it is prudent to wait for the price to close below this MA before placing a short position to confirm the validity of a potential trend reversal.
Sample Trade:
- Entry: Place your entry just below the 10 MA (the price needs to close below this level first).
- Stop Loss: Place your stop loss just above the high of the evening star’s third candle.
- Take Profit: Set your TP just above the nearest key structural level.
3. Trading the Evening Star with RSI divergence
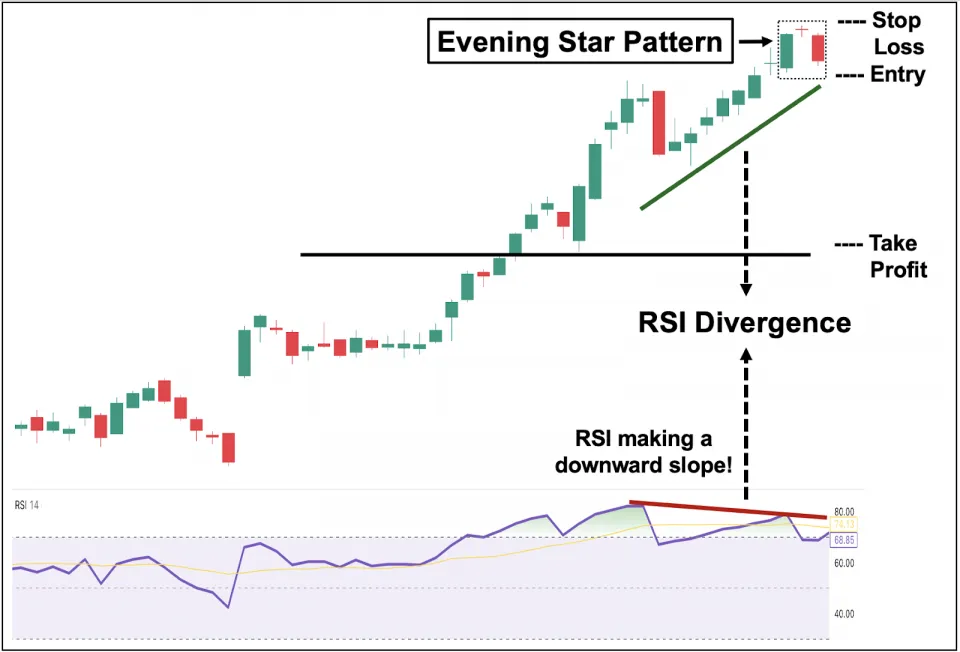
The third strategy involves using the Relative Strength Index (RSI) indicator for its divergence function. As shown, an evening star pattern appeared after an extended uptrend. However, we can observe that while the price forms a higher high (eventually leading to the evening star), the RSI forms a lower high.
This then creates a “divergence,” where the price and RSI go in opposite directions. In such cases, the RSI serves as a leading indicator that signals a weakening bullish momentum, and the evening star, as a bearish reversal pattern, confirms this fading bullish momentum and signals a likely trend reversal.
Sample Trade:
- Entry: Place your entry just below the low of the evening star’s third candle.
- Stop Loss: Place your stop loss just above the high of the evening star’s third candle
- Take Profit: Place your TP just above the nearest key structural level.
Which Indicators Can Be Combined With The Evening Star Pattern?
As we have illustrated above, you can effectively combine the evening star candlestick pattern with various technical indicators. Among these indicators, we highly recommend moving averages and RSI. Below are the specific specifications we like to use:
Moving Average
We recommend the Simple Moving Average (SMA) version. Depending on the length of the trend, here are the MA periods you can consider using:
- 10-period SMA – for high momentum short-term trends
- 20-period SMA – for lower momentum short-term trends
- 30-period SMA – for medium-term trends
- 100-period SMA – for long-term trends
RSI
For identifying divergences, we recommend the default setting of RSI which has a length of 14 SMA with a standard deviation of 2.
What are the Alternatives to the Evening Star Pattern?
Here are 5 bearish reversal candlestick patterns you can use as an alternative to the Evening Star:
1. Tweezer Top
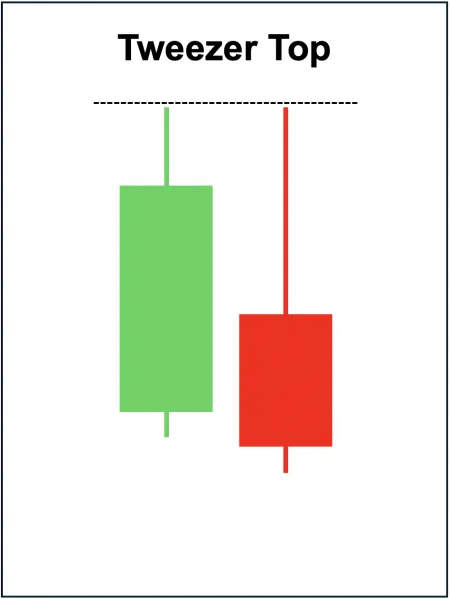
The tweezer top is a two-candlestick bearish reversal pattern that is composed of 2 candles with identical highs (preferably either the first or the second candle has a long wick). Meaning: The pattern illustrates the inability of buyers to break above this significant price level which has now become a key resistance area.
2. Bearish Engulfing
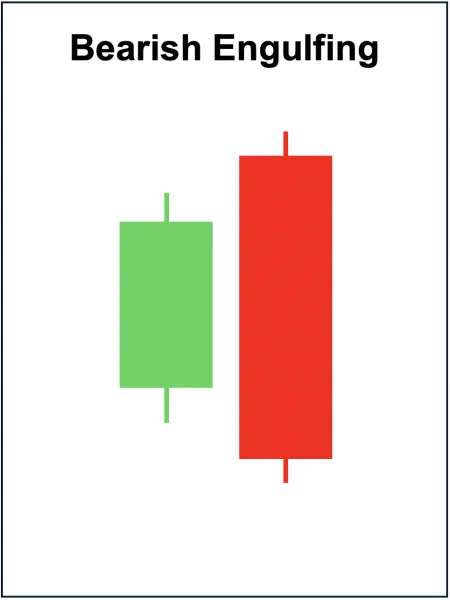
The bearish engulfing is a two-candlestick bearish reversal pattern that is composed of a small bullish candle (first candle) followed by a long-range bearish candle that completely covers or “engulfs” the first candle. Meaning: The pattern illustrates the immediate shift in market sentiment from bullish to bearish and how sellers have suddenly and decisively taken control of price action.
3. Bearish Harami
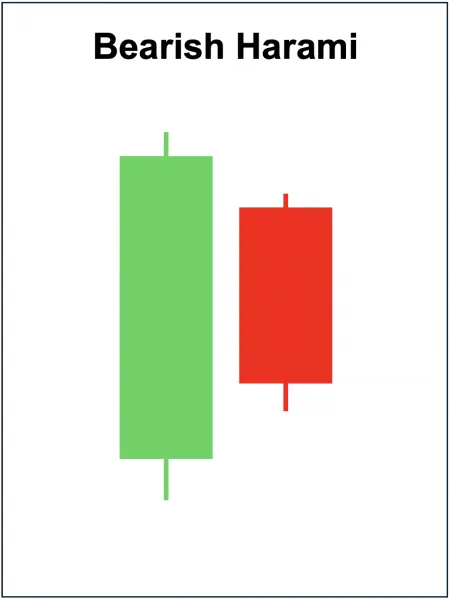
The bearish harami is a two-candlestick bearish reversal pattern that consists of a long-range bullish candle (first candle) followed by a smaller bearish candle (second candle) appearing inside the first candle’s body. Meaning: It illustrates the contrast between the 2 candles, the first candle reflects strong bullish momentum, while the second candle abruptly halts the price advance and hints at a possible brewing selling pressure.
4. Three Black Crows
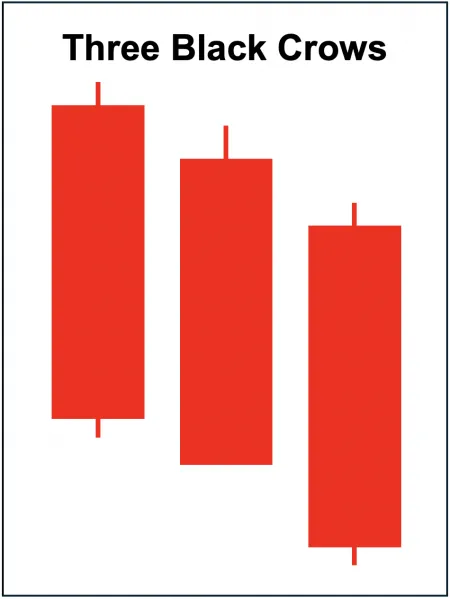
The three black crows is a bearish reversal pattern consisting of 3 successive long-bodied bearish candles with little to no wick that close lower each time (unlike other patterns, which typically include at least one candle with a long wick). Meaning: The pattern indicates an overwhelming bearish sentiment, with sellers controlling price action, suggesting a sustained downward trend.
5. Dark Cloud Cover
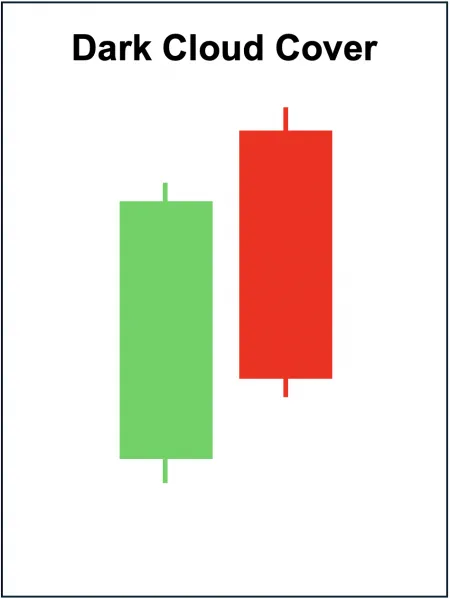
The dark cloud cover is a two-candlestick bearish reversal pattern composed of a long green candle followed by a red candle that closes below the halfway point (50%) of the first candle’s body. Meaning: It illustrates a sudden selling pressure causing the second candle to erase much of the first candle’s gains/price advance.
For more alternatives, check our Candlestick Pattern PDF.
Evening Star vs. Morning Star Pattern
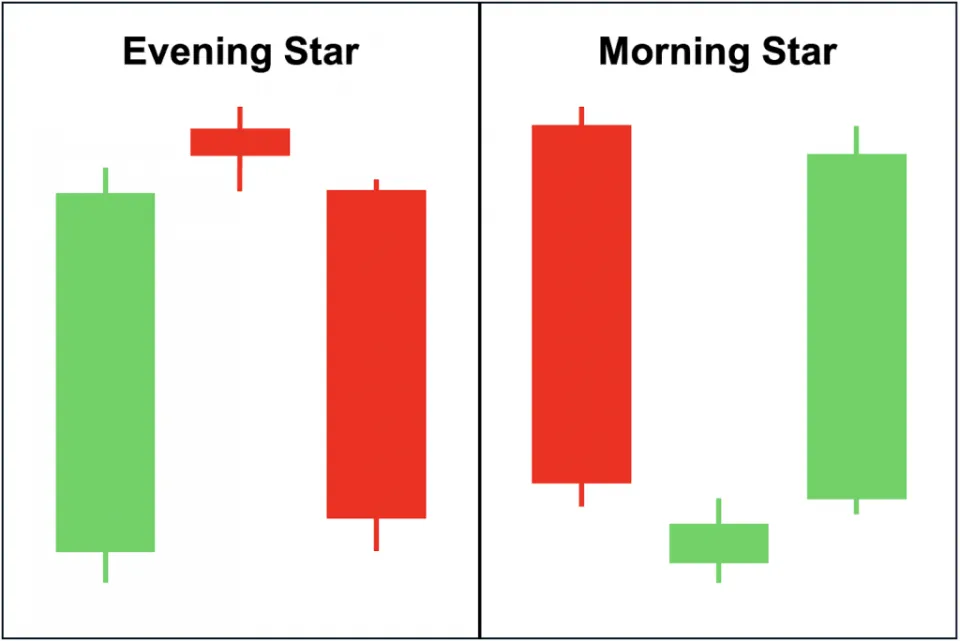
The morning star is the direct counterpart of the evening star, and visually, they look like mirrored versions of each other (see image above). This means that while the evening star is a bearish reversal pattern that forms at the top of an established uptrend, the morning star is a bullish reversal pattern that occurs at the bottom of an ongoing downtrend.
Learn to Trade Patterns with WR Trading Mentoring
The evening star pattern is just one of the tools we use in technical analysis to trade stocks, forex, and many more. It is crucial to remember that there is no “holy grail” in trading and we do not deal with certainties but merely probabilities. In our experience, an essential aspect to hone to become consistently profitable over the long-term is proper risk management.
Hence, if you want to master the nuances of candlestick patterns while sharpening your risk management approach at the same time, you can join our mentoring class at https://wrtrading.com/
(Learn To Trade And Read Candlestick Patterns Like A Pro)