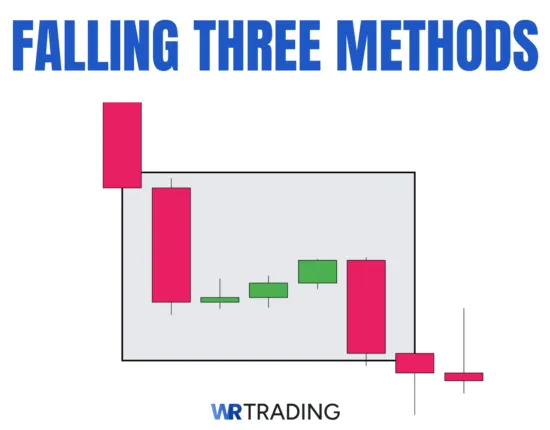
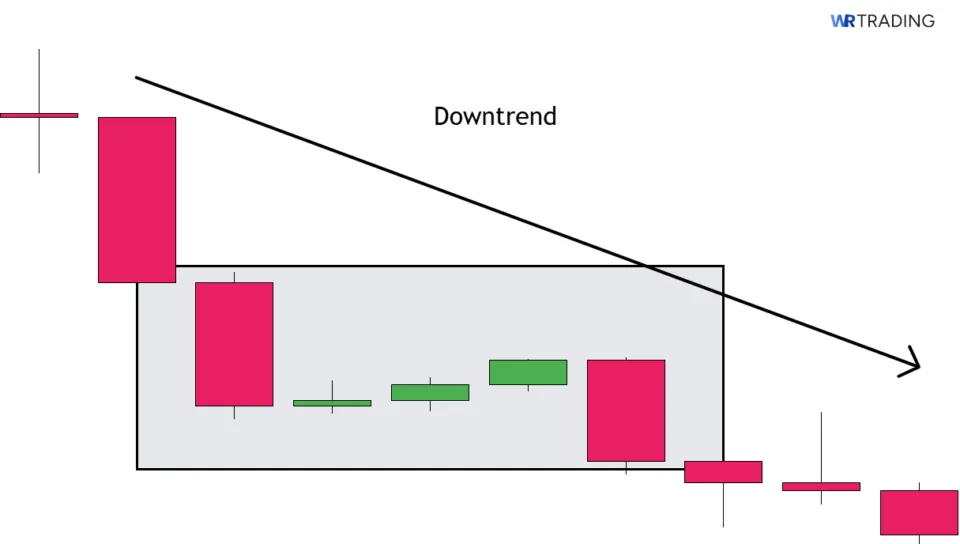
The Falling Three Methods is a bearish continuation candlestick pattern that pops up mid-downtrend. It comprises five candles: a long bearish candle, followed by three smaller bullish or neutral candles, and capped off with another strong bearish candle that closes lower than the first. This formation signals that although buyers briefly attempt a pullback, they cannot reverse the trend.
Therefore, in this article, you’ll get the full picture, not just what the pattern looks like, but what it means in Forex. We’ll break down the psychology behind it, showing how sellers stay in control while buyers fail to flip the trend. You’ll also learn how to trade this pattern. This includes spotting valid setups, timing your entries and exits, and valid alternatives to this pattern.
Key Facts of The Falling Three Methods Candlestick Pattern:
- Construction:
- 1st Candle: This is a long bearish one, which can be red or black.
- 2nd–4th Candles: The following three small-bodied candles, bullish (green/white) or neutral, stay within the range of the first candle.
- 5th Candle: This strong bearish candle closes below the first candle’s close.
- Type of Pattern: Continuation
- Trend Prior to Pattern: Downtrend.
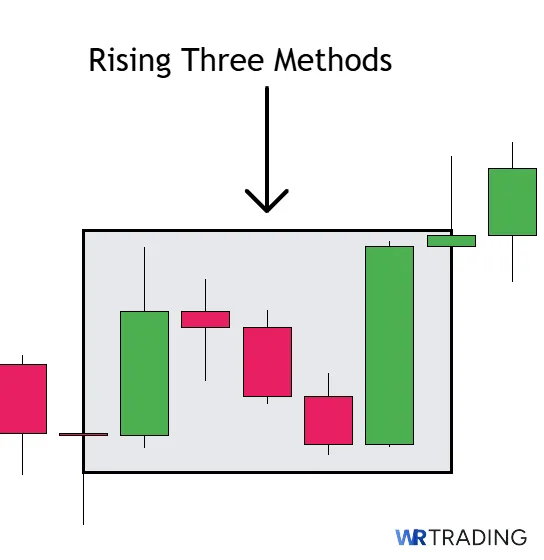
- Opposite Pattern: The Rising Three Methods.
- Entry Options: The entry point is at the close of the fifth candle.
- Stop Loss Placement: Place above the consolidation high (typically above the 2nd candle) to guard against pattern failure.
- Interpretation: The sellers push the price down hard as shown in the 1st candle. So, the buyers try to fight back (middle candles), however, they’re weak and trapped. Therefore, the final bearish candle reflects sellers regaining control after a pause, confirming ongoing bearish dominance.
(Learn To Trade And Read Candlestick Patterns Like A Pro)
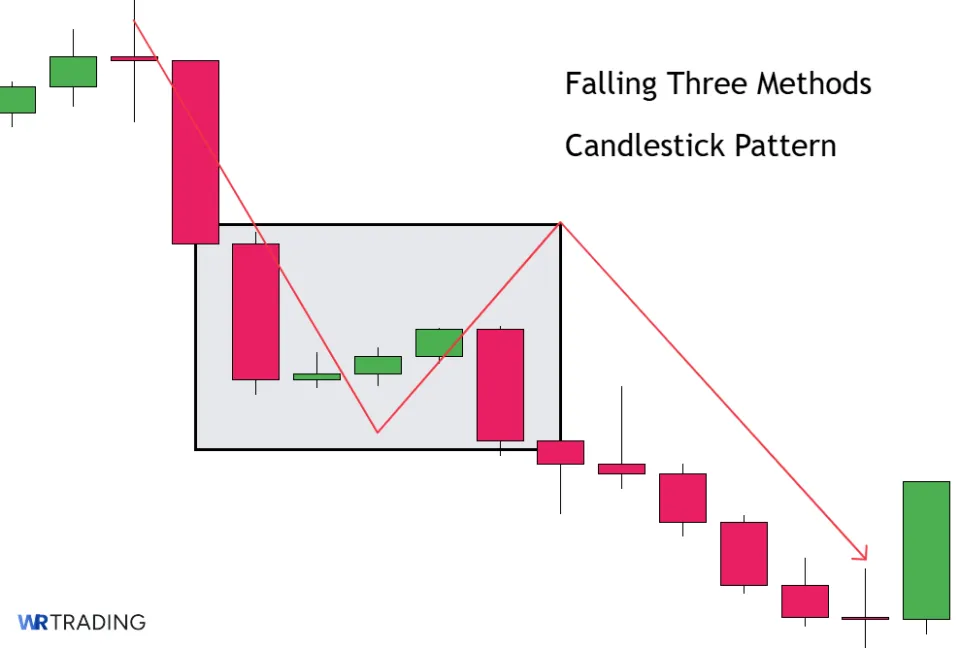
How Is The Falling Three Methods Pattern Formed?
The Falling Three Methods pattern forms within a downtrend and never forms in isolation. So, don’t expect to see it in sideways or choppy markets. This pattern shows up when the market takes a quick breather before continuing to fall. You’ll typically spot this pattern after a strong series of red (bearish) candles, which will hint that sellers are in full control.
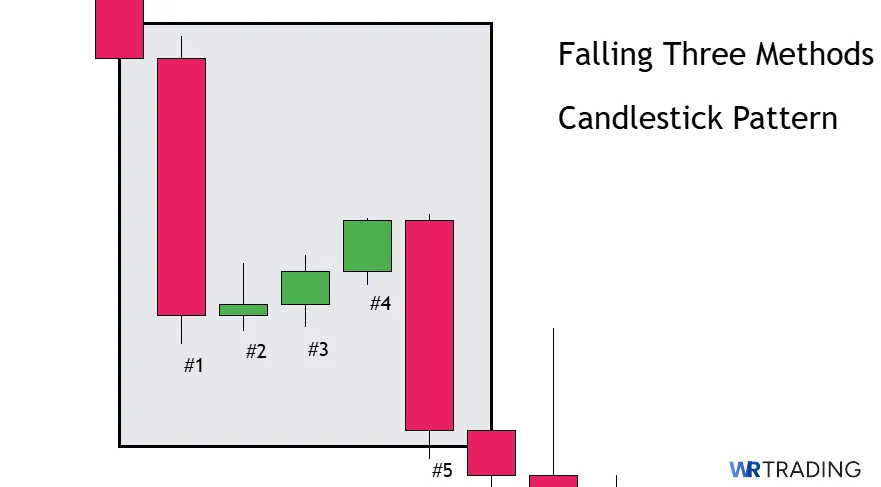
This pattern is made up of five types of candles:
- Candle 1 – Long Bearish Candle: The first candle is a strong red or black candle that shows aggressive selling pressure. It sets the tone and creates the upper boundary of the upcoming consolidation zone.
- Candles 2–4 – Small Bullish or Neutral Candles: These three candles usually lean bullish (green/white) or neutral and show indecision. What matters is that they stay within the range of the first candle, and they shouldn’t break above its high. This phase is a consolidation where buyers try and fail to reverse momentum.
- Candle 5 – Long Bearish Candle: The final candle closes below the close of the first candle, confirming that sellers are back in charge and the downtrend is set to resume.
How Much Time Does It Take To Form The Three Methods Pattern?
The time it takes to form the pattern represents one complete time period of your chosen timeframe. Nonetheless, the pattern takes a minimum of 5 time units to complete.
- On a 1-hour chart, each candle covers one hour. Therefore, the Falling Three Methods would typically take 5 hours to complete.
- Meanwhile, on a daily chart, each candle represents one full trading day, so the pattern would span 5 days.
- On a weekly chart, each candle equals one week, meaning the pattern unfolds over 5 weeks.
The key is not the exact duration, but the sequence and behaviour of candles during an active downtrend. The pattern’s effectiveness is generally considered similar across different time frames. However, some traders prefer to confirm it on higher time frames for more reliable signals.
(Learn To Trade And Read Candlestick Patterns Like A Pro)
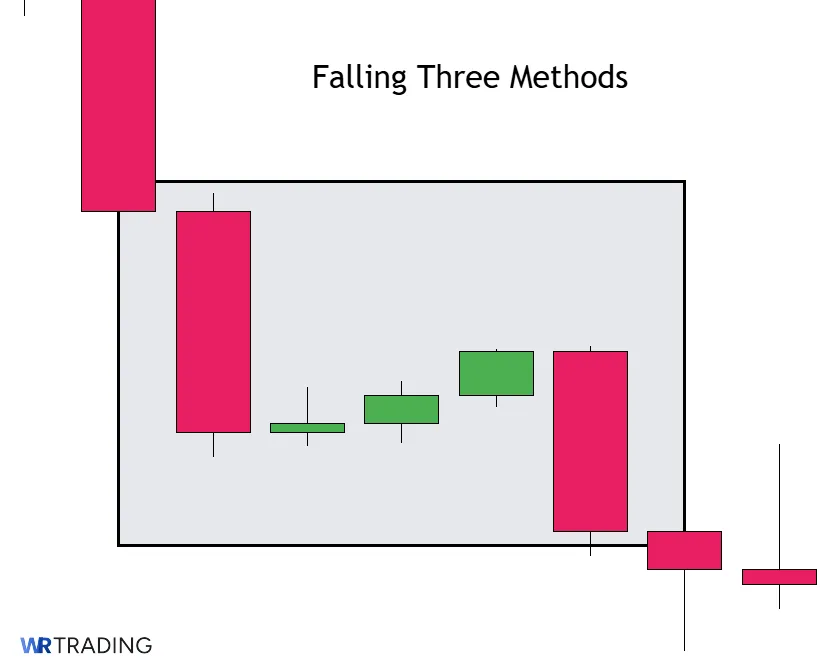
What Does The Falling Three Methods Candlestick Pattern Mean?
The Falling Three Methods pattern reveals a particular market psychology playing out between buyers and sellers during a downtrend. When this pattern manifests, both buyers and sellers react differently to assert themselves in the market.
The buyers try to push prices up during the three small bullish candles but fail to break above the initial bearish candle’s range, indicating weak buying power and hesitation.
The sellers, on the other hand, initially exert strong pressure, then pause during the minor pullback, and finally regain control with renewed selling pressure, confirming the downtrend continuation and encouraging more selling or short positions.
The Falling Three Methods Pattern effectively says: “The market tested the possibility of a reversal, but selling pressure remains dominant.”
Once the pattern is underway, the market influence is limited and almost set in stone.
- The pattern signals to traders that the downtrend is intact despite a temporary bullish pause.
- Sellers are confident and dominant, hence, you’ll see traders often use this pattern to enter or hold short positions.
- The three short candles show that buyers’ attempts to reverse the trend are seen as weak and temporary. This reinforces the bearish sentiment.
- The final bearish candle serves as confirmation that sellers have regained control, increasing the likelihood of further price decline.
What Is An Example Of The Falling Three Methods Pattern?
In early Ocotber 2023, the GBP/USD made a Falling Three Methods Pattern in the H4 chart. Although appearing, the candles between the first and last candles were deemed to be unstable. Nevertheless, it eventually dragged down the price.
Pattern Breakdown:
First Candle (Bearish Initiation):
- Date: October 24, 2023
- Open: 1.2203
- Close: 1.2158
Middle Candles (Temporary Consolidation):
- Dates: October 24-25, 2023
- Price Range: Between 1.2156 and 1.2175
Final Candle (Bearish Continuation):
- Date: October 25, 2023
- Open: 1.2175
- Close: 1.2138
This shows that after a significant drop (first candle), the market experienced a short-lived consolidation (middle candles). The final bearish candle confirms that sellers have regained control, and the downtrend continues.
(Learn To Trade And Read Candlestick Patterns Like A Pro)
How To Identify The Falling Three Methods Pattern?
Although it seems daunting, you can identify this pattern via the following steps in our technical analysis.
Previous Trend Requirement
The most critical prerequisite for identifying a Falling Three Methods pattern is the presence of an established downtrend. So always look for it when the price is making a series of lower highs and lower lows, when the overall market sentiment is bearish, or when momentum indicators confirm downward pressure.
Without this downtrend context, even a formation that visually resembles the Falling Three Methods won’t carry the same predictive power.
Locate the Pattern Structure (Five Candles)
After checking previous trends requirements, proceed to check the pattern structure.
- First Candle: Locate a large bearish candle with a long body (significant difference between open and close). This represents strong selling momentum continuing the downtrend.
- Three Middle Candles: Look for three small-bodied candles following the large bearish candle. Each of these candles should be predominantly small bullish candles must stay within the high-low range of the first bearish candle.
- Final Candle: You should then identify another large bearish candle. This candle closes near or below the close of the first bearish candle and shows renewed selling pressure that overwhelms the temporary buying.
Where to Search For The Pattern
The most effective places to find this pattern include:
- Support Level Breakdowns: Check after price has recently broken through a significant support level and is continuing downward.
- During Pullbacks: Also scan for the pattern during mild retracements in strong downtrends
- After News or Earnings: Check after negative fundamental catalysts when price is declining rapidly
- At the End of the Consolidation Periods: Examine situations where the market has been moving sideways after a downtrend and might be ready to continue lower.
When scanning charts, remember to look for the complete sequence in context. You should also be wary of similar patterns that don’t meet all criteria, as the specifics matter for reliability in stocks.
How To Trade The Falling Three Methods Pattern?
When properly identified and explained, the Falling Three Methods provide a relatively low-risk opportunity with clearly defined parameters for entry, stop loss, and take profit targets.
Trading here involves the following straightforward steps:
- Finding the right setup in a downtrend or near resistance
- Waiting for the pattern to appear
- Entering the trade with a proper stop loss and position sizing
- Optionally waiting for confirmation
- Setting a take-profit target
(Learn To Trade And Read Candlestick Patterns Like A Pro)
1. Find The Right Setup For The Falling Three
You have to look for a clear downtrend with successive lower highs and lower lows. This pattern is a continuation pattern, so it belongs to downtrend contexts, not reversals. Preferably, the pattern should form near a key resistance level or after a strong bearish move, to signify that sellers are likely to push prices lower again.
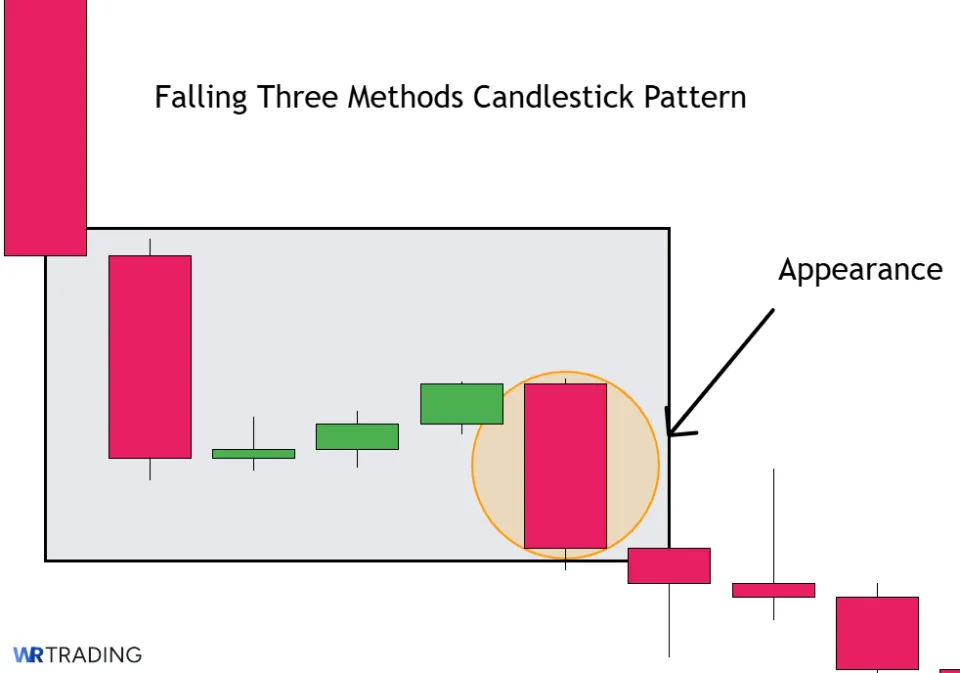
2. Wait For The Appearance Of The Falling Three Candlestick Pattern
Although you might see signs of a forming Falling Three Candlestick pattern, you have to let it appear fully. So, your patience is crucial for the combination of all five candles to form properly. Don’t jump in early, as the pattern is incomplete until the final bearish candle confirms the bearish continuation. Acting on partial patterns often results in false signals and trading losses.
3. Open Your Trade – Entry Point
Now, this is where you begin to act on the pattern. You could enter a short (sell) position after the close of the fifth bearish candle. This confirms that sellers have regained control.
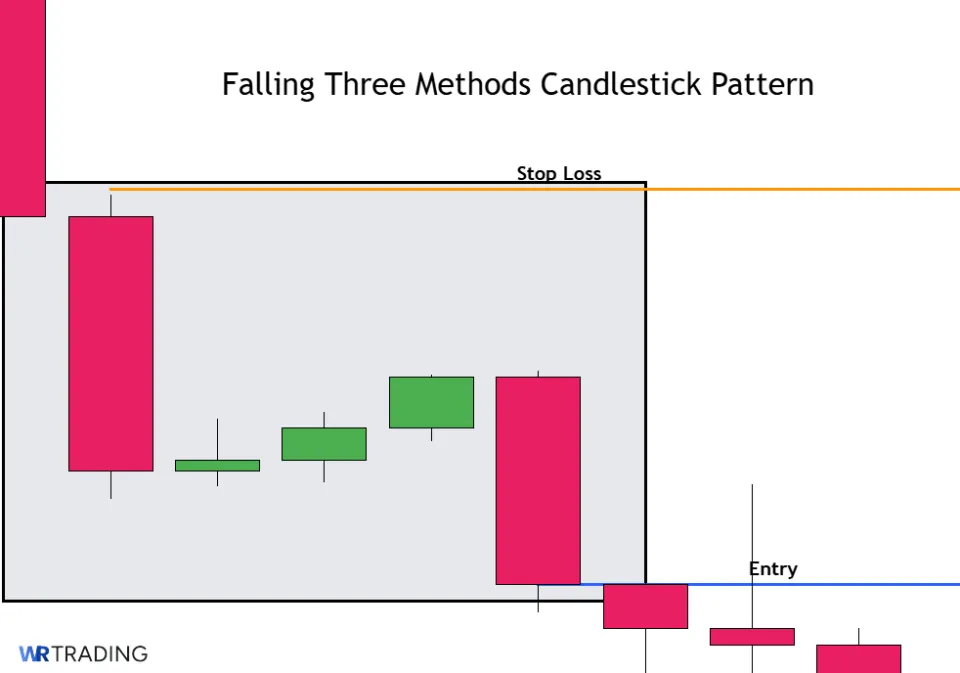
Next, you could also place your stop loss above the highest point of the three small bullish candles to limit risk if the pattern fails. Perhaps that doesn’t suit you, you could adjust your position size based on your risk tolerance and the distance between entry and stop loss.
4. Wait For A Confirmation Or Not
You can either trade the pattern as soon as it completes or wait for additional confirmation. Both approaches have merits. For instance, trading without confirmation has a better entry price and maximises your potential profit. However, you’re open to a slightly higher risk of false signals.
On the other hand, with confirmation, you get higher probability trades and fewer false signals. Nevertheless, you fall at a disadvantage with a less favourable entry price and reduced profit potential. You can confirm the pattern with:
- Momentum Indicators: Bearish readings on RSI, MACD, or Stochastic
- Moving Average Crossovers: Price breaking below key moving averages
- Support Breaks: Price closing below nearby support levels
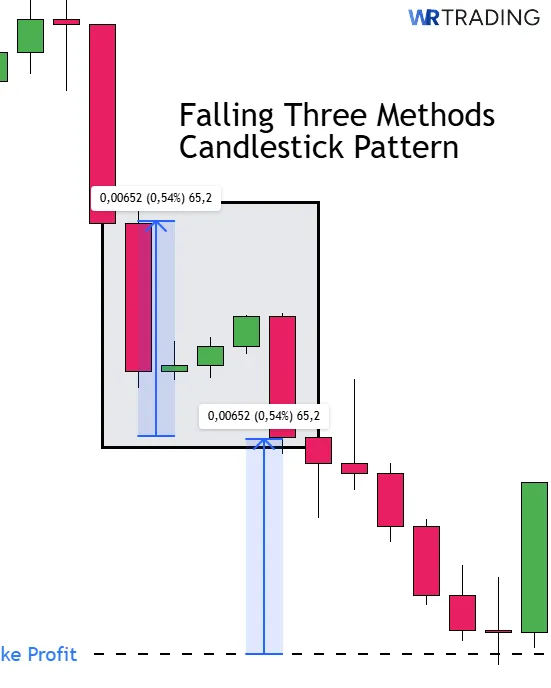
5. Choose Your Trading Take Profit
At this point, you can use multiple take-profit strategies. So, set your take profit near the next significant support level below the pattern. Alternatively, you can use the height of the first bearish candle as a reference to project the expected downward move. Consider using trailing stops to lock in profits if the price continues to decline strongly, going downward.
What Is The Success Rate Of The Falling Three Methods Candlestick Pattern?
The hit rate of the Falling Three Methods candlestick pattern is generally reported in the range of 71% to 75%. However, Thomas Bulkowski, one of the few who have done statistical analysis on candlestick patterns using historical data, states in his study that the Falling Three Methods pattern has a performance rating of approximately 71% for bearish continuation.
The success rate of the Falling Three Methods candlestick pattern can be influenced by several factors. It is crucial to consider these factors for an accurate win rate:
- Market trend strength
- Volume confirmation
- Longer timeframes (daily or higher) tend to yield more accurate signals than intraday charts.
- Additional technical confirmation
- Pattern integrity
What Are The Pros And Cons Of The Falling Three Methods Pattern?
The Falling Three Method pattern has some great pros for traders, as well as cons that you must be wary of.
Pros
- Clear entry and stop-loss points
- High reliability when properly formed
- Works across multiple timeframes
- Provides continuation confirmation in downtrends
Cons
- Relatively rare pattern occurrence
- Requires patience to wait for full formation
- Can produce false signals in ranging markets
- Not ideal for novice traders
What Are The Advantages Of The Falling Three Methods Pattern?
The advantages of this pattern are quite direct, especially when taking into account its clear entry and stop-loss points, high reliability, and application across multiple timeframes.
- Clear Entry and Stop-Loss Points: The pattern provides exceptionally well-defined entry and exit parameters. The entry point after the fifth candle is precise, while the stop-loss placement above the pattern’s high point creates a clear risk boundary. In light of this, much of the guesswork in trade execution is eliminated, which helps maintain disciplined risk management.
- High Reliability When Properly Formed: When the Falling Three Methods appears with all its required elements in an established downtrend, it means you can safely rely on it for trading. The pattern’s structure confirms that selling pressure remains dominant despite temporary buying interest, making it a high-probability setup when fully formed.
- Works Across Multiple Timeframes: Unlike some patterns that perform better on specific timeframes, the Falling Three Methods maintains its effectiveness across daily, hourly, or even 15-minute charts. This versatility allows traders to apply the pattern within their preferred trading timeframe or to use multiple timeframes confirmation for even stronger signals.
- Provides Continuation Confirmation in Downtrends: The pattern serves as excellent confirmation that a downtrend remains intact despite brief countertrend movements. This helps traders distinguish between genuine reversals and mere pullbacks. Therefore, they can maintain profitable positions in established trends rather than exiting prematurely.
What Are The Disadvantages Of The Falling Three Methods Pattern?
While the advantages may be eye-catching to Forex traders, you also have to consider the disadvantages when looking for this pattern in stocks.
- Relatively Rare Pattern Occurrence: One of the most significant drawbacks to this pattern is simply how infrequently it appears in its perfect form. Traders may go weeks or months without seeing a textbook Falling Three Methods pattern. This makes it impractical to rely on as a primary trading strategy.
- Requires Patience to Wait for Full Formation: The pattern takes five candles to completely emerge, hence you have to be quite patient before verifying the pattern and entering a position. More aggressive traders may find this delay difficult. Also, it may result in traders missing some of the potential profit as the market continues moving while the pattern forms.
- Can Produce False Signals in Ranging Markets: In choppy or sideways markets, what initially appears to be a Falling Three Methods pattern may simply be random price action that superficially resembles the pattern. These false signals are particularly common when the market lacks a clear directional bias.
- Not Ideal for Novice Traders: The pattern’s complexity, relative rarity, and need for contextual analysis make it less suitable for beginners. Novice traders may struggle with both identification and execution, potentially leading to frustration and losses until sufficient experience is gained.
(Learn To Trade And Read Candlestick Patterns Like A Pro)
Can The Falling Three Methods Have Failure Signals?
Yes, the Falling Three Methods pattern can fail despite its generally reliable nature. The pattern has a success rate of approximately 71%-75% when formed properly, meaning it can fail in about 30% of cases, especially in certain market conditions. The probability of failure increases when:
- The pattern forms in a weak or sideways market rather than a strong downtrend.
- The final bearish candle does not close below the low of the first bearish candle, thus failing to confirm continuation.
- The three small bullish candles break above the first candle’s high, invalidating the pattern.
- There is weak volume or insufficient selling pressure on the final candle.
Which Indicators Can Be Combined With The Falling Three Methods?
You can combine the Falling Three Methods pattern with technical indicators to improve trade accuracy and reduce false signals. Popular indicators and their typical settings include:
| Indicator | Settings & Description | Role in Confirmation |
|---|---|---|
| Relative Strength Index (RSI) | 14-period RSI; look for values above 50 but below 70 during the pattern formation. Overbought (>70) can reinforce bearish signals. | Confirms momentum; if RSI is not oversold, bearish momentum is intact. |
| Moving Averages (MA) | 50-day or 200-day Simple or Exponential Moving Average; price should be below these MAs during pattern formation. | Confirms overall downtrend context for the pattern. |
| MACD (Moving Average Convergence Divergence) | Standard 12,26,9 settings; watch for bearish crossover or MACD histogram turning negative near the pattern. | Confirms bearish momentum and trend continuation. |
| Volume Indicators (e.g., On-Balance Volume, Volume RSI) | Volume should ideally increase on the final bearish candle to confirm selling pressure. | Validates the strength of sellers and pattern reliability. |
| Bollinger Bands | 20-period, 2 standard deviations; price touching or moving near the lower band after pattern completion. | Indicates strong bearish momentum and potential continuation. |
What Are Alternative Patterns To The Falling Three Methods Pattern?
The Falling Three Methods pattern isn’t the only bearish pattern in the market you can look out for. There are alternatives that you should look out for in Forex, but the following are the most popular ones.
| Pattern Name | Description |
|---|---|
| Bearish Flag | A short consolidation or slight upward retracement after a strong downtrend, forming a rectangular shape. A breakout to the downside signals a continuation of the downtrend. |
| Descending Triangle | A bearish continuation pattern with a flat support line and descending resistance line, showing sellers gaining strength. Breakout below support confirms continuation. |
| Evening Star | A three-candle pattern with a large bullish candle, followed by a small-bodied middle candle, and completed by a bearish candle, signals a potential reversal from bullish to bearish |
| Three Black Crows | Three consecutive long bearish candles with short or no shadows, signalling strong bearish momentum and continuation of the downtrend. |
| Dark Cloud Cover | A two-candle bearish reversal/continuation pattern where a bearish candle opens above the previous bullish candle’s close but closes below its midpoint, indicating sellers overpower buyers. |
What Is The Opposite Pattern Of The Falling Three Methods?
Rising Three Methods is the polar opposite of the Falling Three Methods pattern. Forming during an uptrend, this bullish continuation pattern comprises a big bullish candle followed by three small bearish candles staying within the range of the first candle, and finishes with another large bullish candle. It represents a brief consolidation during an uptrend before bulls regain control and push prices higher.
What Is The Difference Between The Falling Three Methods And The Rising Three Methods?
The Falling Three Methods and Rising Three Methods represent continuation patterns in opposite market directions. While both patterns represent brief consolidations before the primary trend continues, the Falling Three Methods signals bearish continuation in downtrends, whereas the Rising Three Methods indicate bullish continuation in uptrends.
Their structures are similar but inverted, making them complementary patterns for traders following different market directions.
What Are The Limitations Of The Falling Three Methods Pattern?
This pattern, although popular, has limitations you have to be conscious of. These limitations are explained below.
- False Signals
- Subjectivity in Interpretation
- Dependence on Confirmation
- Undefined Price Target
- False Signals: The pattern can be invalidated if the price breaks above the high of the first large bearish candle, signalling that the downtrend may not continue as expected.
- Subjectivity in Interpretation: Traders may perceive the pattern differently, especially regarding the exact placement and size of the three small bullish candles within the first candle’s range. This lack of universal agreement can cause inconsistent application and reduce reliability.
- Dependence on Confirmation: To improve accuracy, traders often need additional confirmation from volume, indicators, or price action beyond the pattern itself. Waiting for confirmation can delay entry and reduce potential profits, while skipping it increases risk.
- Undefined Price Target: The pattern does not provide a precise price target or expected move length, making it challenging for traders to set take-profit levels confidently. This can complicate trade management and exit strategies.
Learn Pattern Trading With The WR Trading Mentoring
Suppose you want to better understand the full extent of trading patterns like candlesticks and elevate your trading skills. WR Trading Mentoring is here to offer you a personalised, expert-led mentorship program. It’s designed to bridge the gap between theory and real market success.
From mastering high-accuracy setups like the Falling Three Methods to spotting breakout patterns before they explode, our mentoring program gives you the tools to turn chart patterns into real trades.
We don’t believe in guesswork; rather, we offer you data-driven pattern trading, showing you how to combine candlestick mastery with smart risk management and market psychology.
How WR Trading Mentoring Helps You
- Find the Right Setups: Learn to spot high-probability pattern setups within strong trends or key market levels.
- Confirm Patterns with Indicators and Context: Use additional tools like volume, moving averages, and RSI to validate candlestick signals.
- Execute Trades with Confidence: Receive guidance on precise entry points, stop loss placement, and take profit targets based on pattern structure and market conditions.
- Manage Risk and Emotions: Develop discipline to stick to your trading plan and avoid emotional mistakes that often undermine pattern trading success.
- Scale Your Trading: Build a repeatable, scalable approach that leverages pattern trading as part of a broader, well-rounded strategy.
(Learn To Trade And Read Candlestick Patterns Like A Pro)
Conclusion: Boost Trading Success with the Falling Three Methods Candlestick Pattern
The Falling Three Methods Candlestick Pattern, although not so common in Forex, has proven to be a reliable pattern that should be taken advantage of when it appears. The pattern is a bearish continuation, however, it has a flip side, the Rising Three Methods, which is more of a bullish continuation.
Nonetheless, figuring out these patterns, especially for a novice trader, would be hard. That’s where we, WR Trading mentorship, come in to guide you effectively through the markets and take advantage of lucrative signals to grow your stocks.