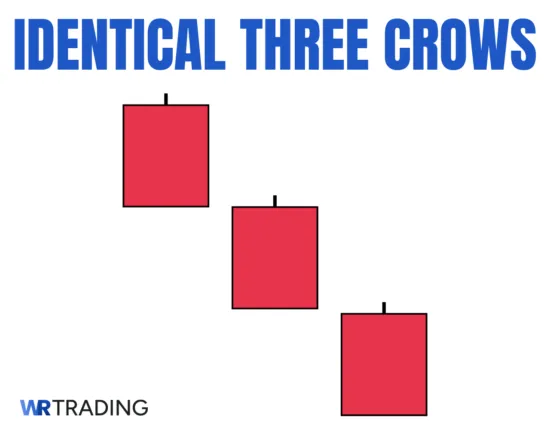
The identical three crows is a rare three-bar reversal pattern that indicates continued bearish momentum. It consists of three identical bearish candles that open within the body of the previous bar and close progressively lower.
The pattern’s meaning lies in exhibiting strong seller dominance and fading bullish attempts. In forex and other financial markets, we’ve seen that spotting the three crows can help traders anticipate further declines. Traders use this pattern within a broader strategy, incorporating various confirmation tools and technical indicators to achieve the most accurate entries.
In this tutorial, the Identical three crows will be fully explained, including the different methods of trading it (with examples) and ways to amplify the chances of success.
Key Facts about how the Identical Three Crows Candlestick Pattern is formed:
- Construction: First to three candles – long-bodied bearish candles
- Type Of Pattern: Reversal
- Trend Prior To The Pattern: Bullish
- Opposite Pattern: Identical three white soldiers
- Entry Options: Break of the third candle’s low; close of the third candle; pullback into the pattern’s range.
- Stop-Loss Options: above the first candle’s high; above the nearest resistance; above the third candle’s high
- Psychology: Sellers taking control and overwhelming buyers
- Success Rate: up to 79%
(Learn To Trade And Read Candlestick Patterns Like A Pro)
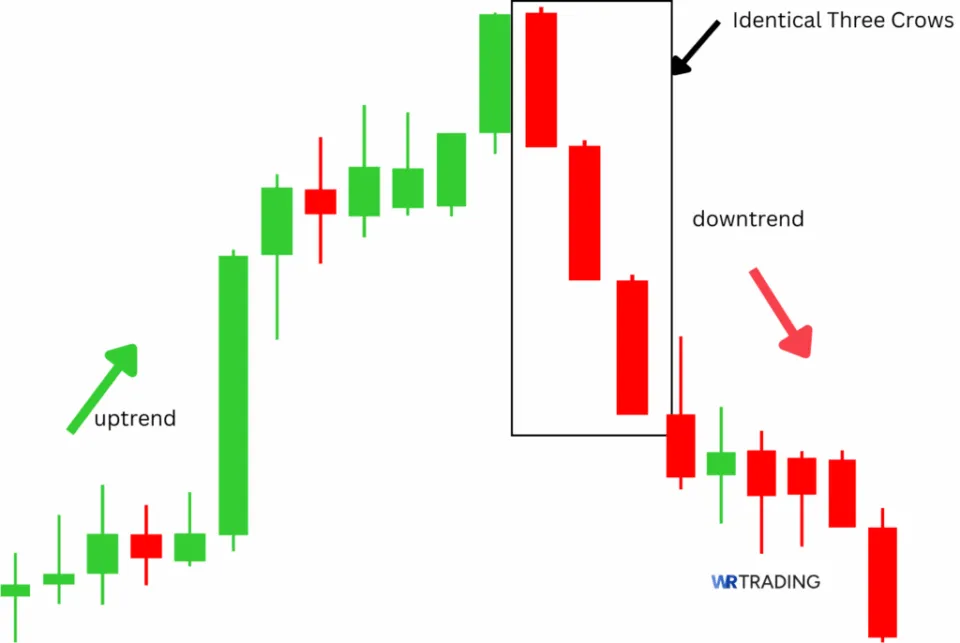
How Is The Bearish Identical Three Crows Pattern Formed?
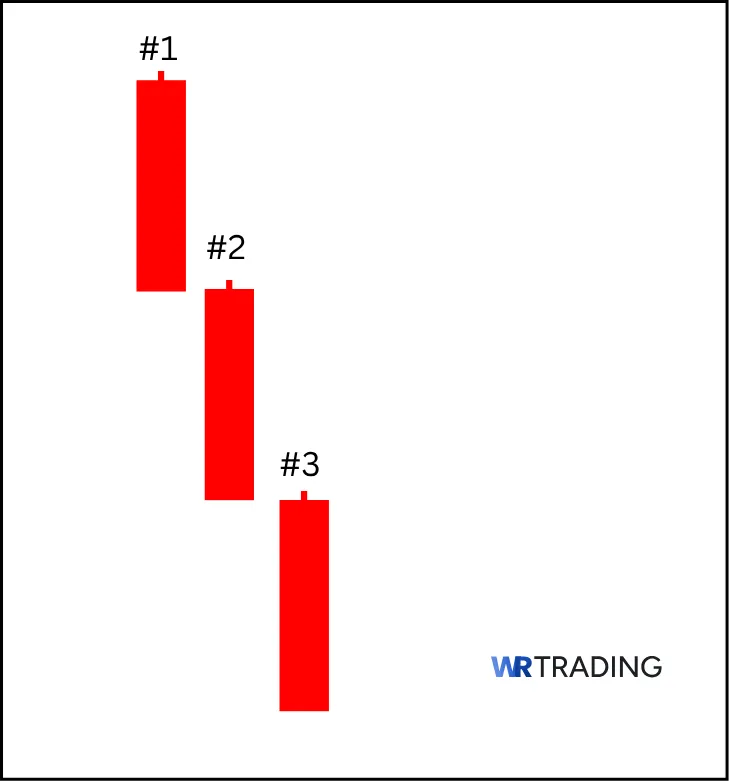
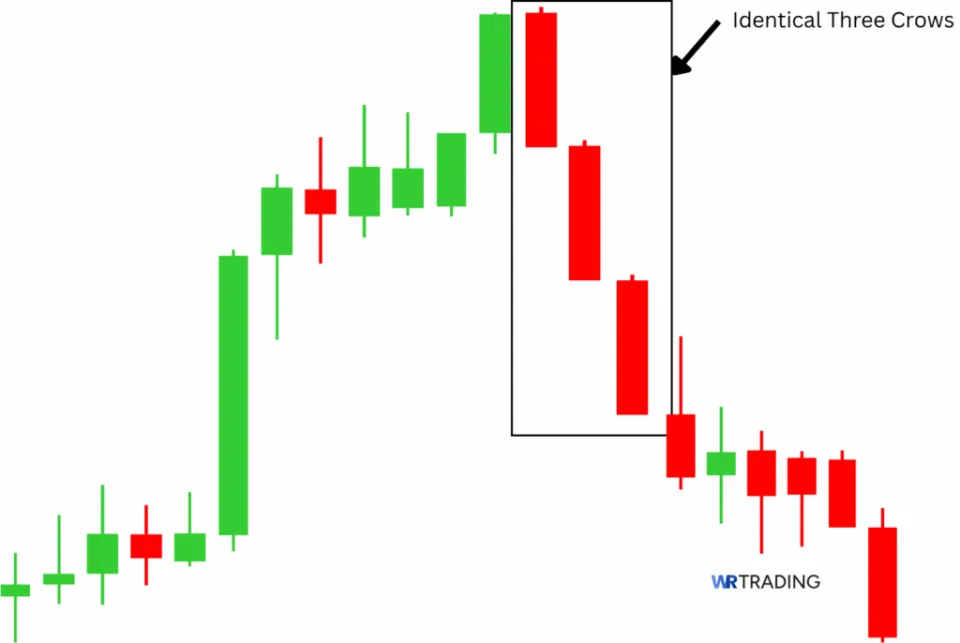
This pattern appears as three consecutive long bearish bars (with little or no shadows) of identical structure after an uptrend or a pullback in a downtrend.
- The first candle signifies a sudden shift in what was previously bullish momentum, indicating that the bears have begun to overpower the bulls.
- The second candle opens within the body of the first and then closes even lower. It is the same in size as the first, reinforcing disciplined selling pressure.
- The third and final candle also exhibits the same attributes, culminating in a firm shift from a bullish to a bearish trend.
The identical three crows can form over any period, depending on the time frame. What’s crucial is that the pattern tells the same story of buyers losing control and sellers dominating.
What Does The Identical Three Crows Candlestick Pattern Mean?
Psychologically, sellers are confidently taking control and overwhelming buyers with this pattern.
The first candle indicates that sellers have found sufficient strength to break below the prior support. As the second candle forms, they double down while buyers fail to mount a defence in hopes of a rebound.
The third candle is the final conviction that momentum is now bearish. Buyers who remain during this time would exit and be reluctant to step in against such relentless selling.
Where Does The Name of The Identical Three Crows Pattern Come From?
The three consecutive bearish candles in this pattern signify the descent of three crows. These birds symbolise misfortune in the financial markets, hence their use to indicate bearish pressure. Meanwhile, the word “Identical” highlights that each candle is equal in size and structure.
(Learn To Trade And Read Candlestick Patterns Like A Pro)
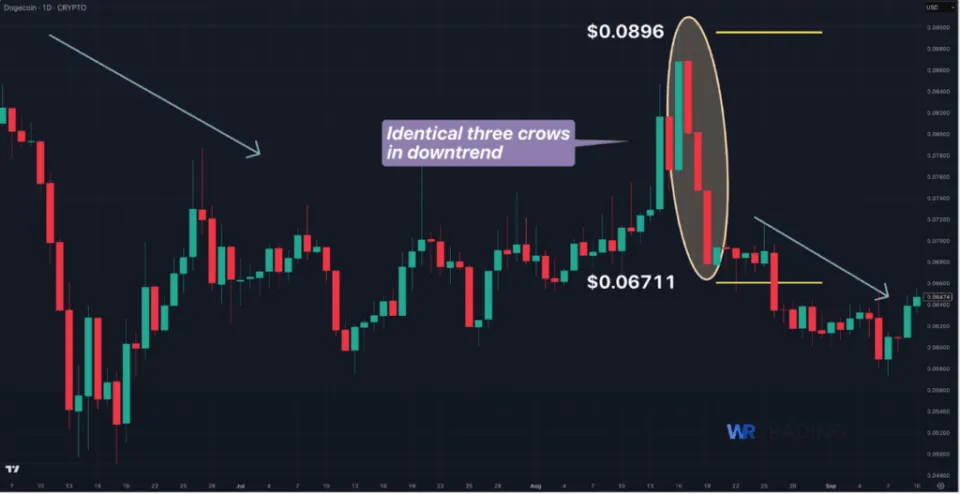
What Is An Example Of The Identical Three Crows Pattern?
Here are two examples of this setup. The first is a downtrend retracement scenario on the daily chart of Dogecoin. We see three long, large red bars between $0.0896 and $0.06711 after an extended pullback.
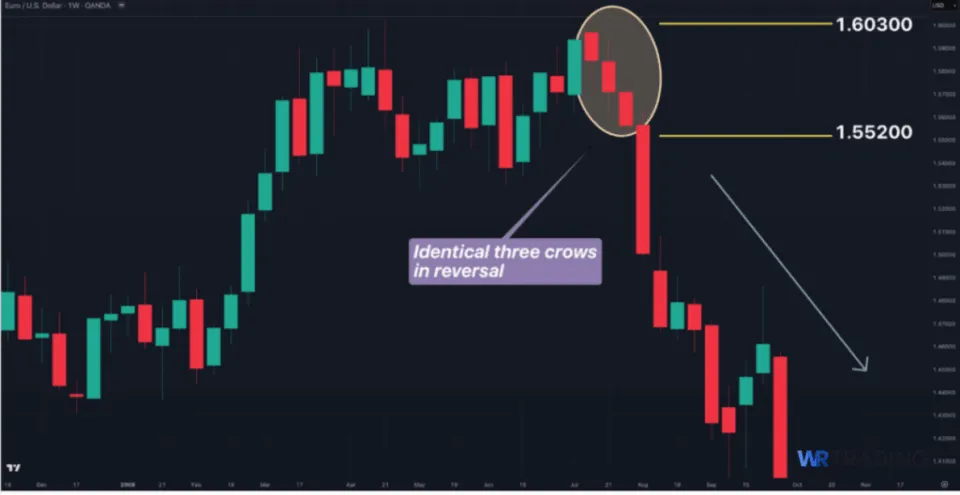
Finally, we have the identical three crows on the weekly chart on EURUSD. This is a reversal setup with the pattern between prices 1.60300 and 1.55200.
How To Identify The Identical Three Crows Pattern
To identify this setup, first look for an uptrend or a pullback of a downtrend. This is where the identical three crows is the most meaningful.
Afterwards, you can scan for an ideal location, usually at a key resistance level. These include horizontal levels, Fibonacci levels, psychological price levels, previous swing highs, supply zones, trendlines, channel boundaries and moving averages.
Importantly, ensure the pattern meets the strict criteria: three consecutive long bearish bars; they should open within or near the previous candle’s body; each candle should have short or no wicks.
These candles don’t need to be perfectly identical in size. So do allow for small variances (but each one should be very similar at a glance).
For additional confirmation:
- Increasing bearish volume occurring while the pattern forms can strengthen the signal
- Overextended technical indication (e.g., the Relative Strength Index coming down from 70 or the pattern forming near the upper Bollinger Bands) is an excellent confirmation layer
(Learn To Trade And Read Candlestick Patterns Like A Pro)
How To Trade The Identical Three Crows Pattern?
A step-by-step approach provides traders with the best chance to identify high-quality setups. Here is a summary of the phases before exploring each one in more detail:
- Find the right setup
- Wait for the appearance of the identical three crows
- Open your trade (entry point)
- Choose the trading take-profit
1. Find the Right Setup For The Identical Three Crows
As a recap of the process explained earlier, here are the main factors to find the ideal setup:
- The identical three crows should appear at the top of a bullish move. Ideally, the price should show signs of exhaustion.
- Some form of key resistance level (the more that align, the better) must be present.
- Higher time frames (from the H4 and above) make it simpler to identify the identical three crows and reduce the level of ‘noise,’ resulting in more powerful setups.
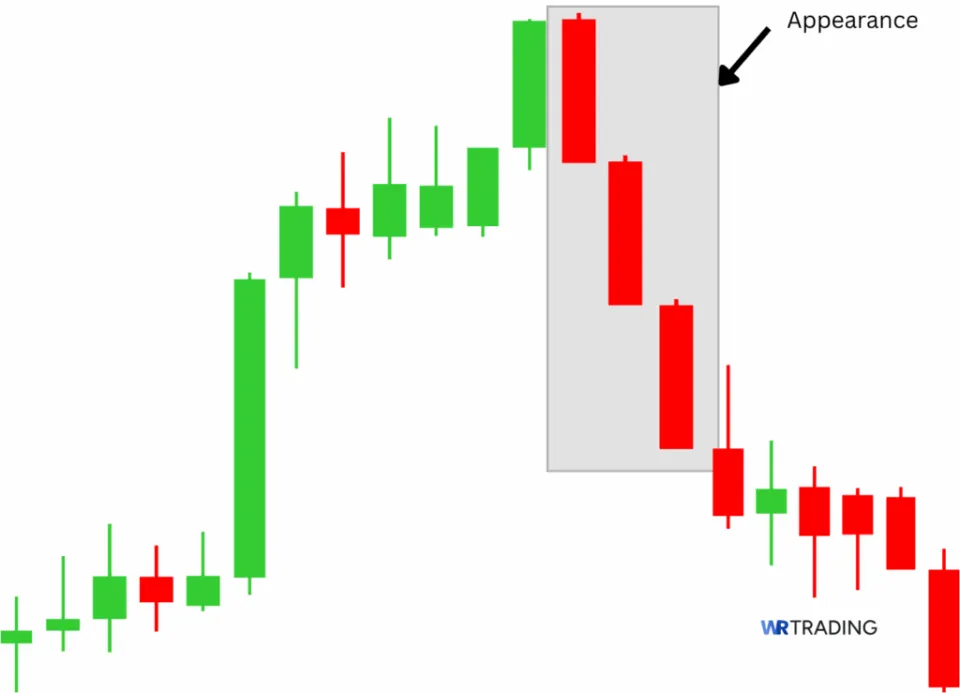
2. Wait For The Appearance Of The Identical Three Crows Candlestick Pattern
By this time, a trader must wait for the pattern to form completely. All three candles must show consistency in size and direction. Once the third candle closes, you now have a valid pattern.
Let’s now explore the different examples of entering the trade.
3. Open Your Trade – Entry Point
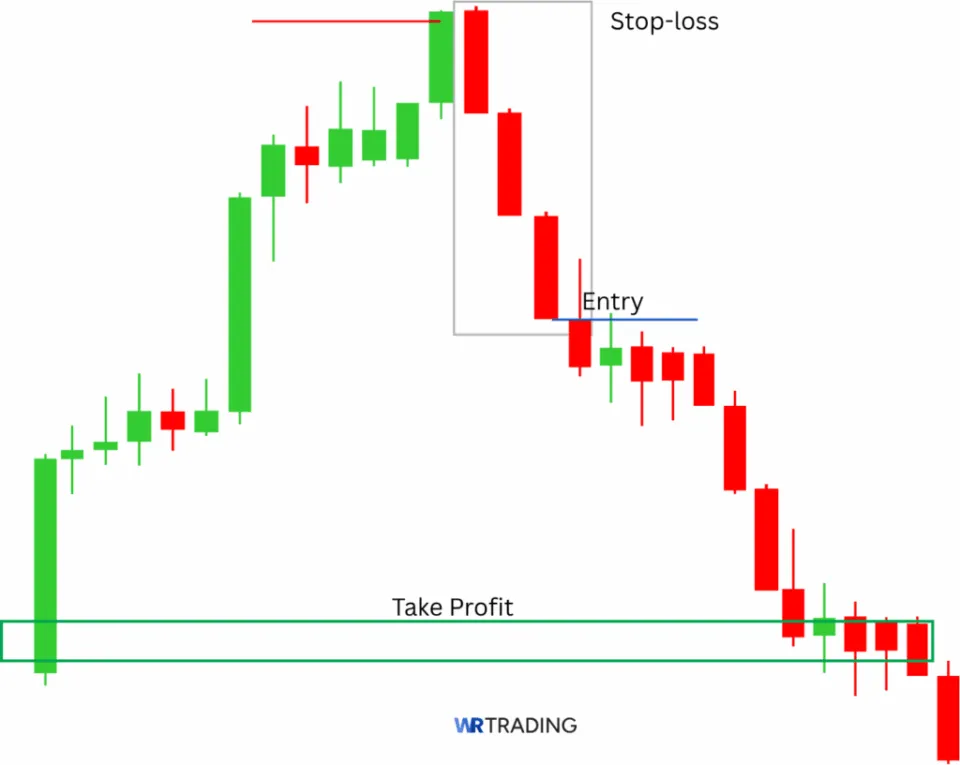
Here are the different types of entry methods for the identical three crows:
- Break of the third candle’s low: This is a conservative and balanced entry where a trader waits for the market to exceed the low of the third bearish candle before the entry.
- Close of the third candle: With this method, you enter immediately after the third candle has closed. It is slightly riskier than the first option (although offers a better price). Still, it can make sense when there is enough conviction in the trade.
- Pullback into the pattern’s range: Occassionally, the price may retrace somewhere in the pattern’s range after it has formed. A 50% level is a decent level to watch and enter. This approach offers the most favourable entry point, but the downside is that there is no guarantee of the minor pullback.
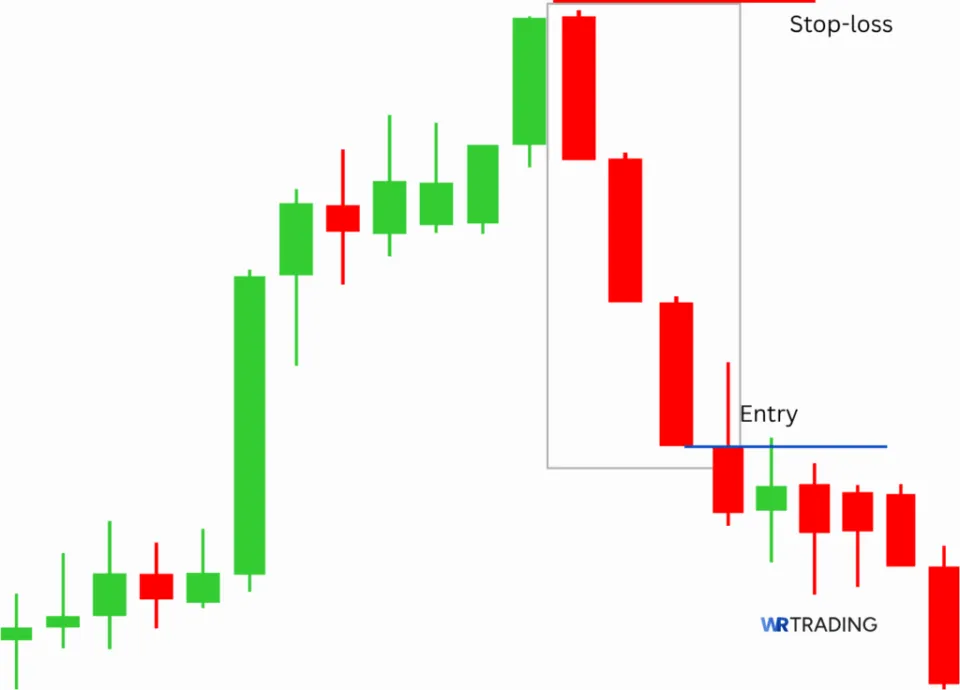
Once you have chosen an entry method, you should have a plan to place your stop loss. Here are the different techniques to consider:
- Above the first candle’s high (standard): Place your stop-loss just above the high of the first candle. This allows room for normal volatility while still invalidating the pattern if breached.
- Above the nearest resistance (technical barrier): Use a nearby resistance level (i.e., horizontal, trendline, Fibonacci level) that price would need to break to invalidate the pattern. This method provides technical protection, but there is a chance of having a wider stop than desired.
- Above the third candle’s high (aggressive): This is a riskier approach where you set the stop loss just above the high of the third candle. While it provides the tightest stop (meaning higher reward potential), there is a chance of a premature exit.
4. Choose Your Trading Take Profit
Gaining the most profit possible is often as tricky as perfecting the entry. Traders should adapt to the current conditions that would occur and use the most appropriate method, such as:
- Nearby key support zones: Consider this classic structure-based method by identifying the closest horizontal support or recent swing low that price is likely to test.
- Fibonacci extension targets: Use Fibonacci retracement levels (like 50, 61.8% and 78.6%) to project where price might go based on the nearest support level.
- Multi-target scaling: Traders can scale out or close parts of their position at different levels to secure some profit while still participating in a potentially large move. An example could be: 50% at first support or 1:1 risk-to-reward; 25% at 1:2 risk-to-reward, or 38.2% Fib; 25% at 1:3 or trailing stop.
- Trailing stops: Use a trailing stop to lock in gains as the price moves in your favour. This can be done above each new lower high or with indicators like moving averages and the Average True Range.
Indicator-based profit taking: There are various indicators to utilise when taking profits. Traders should use at least two indicators to improve reliability. Here are a few examples:
- Relative Strength Index (RSI): consider exiting when the RSI drops below 30 or when there is bullish divergence.
- Moving Average Convergence Divergence (MACD): you could book your profits when the histograms contract or when the MACD line crosses above the signal line.
- Bollinger Bands: secure your gains when the price has exited the lower band and closed back inside.
Finally, each identical three crows setup should show a potential minimum 1:3 risk-to-reward.
(Learn To Trade And Read Candlestick Patterns Like A Pro)
Chart example
Let’s now explore an example that covers various elements of a real identical three crows trade.
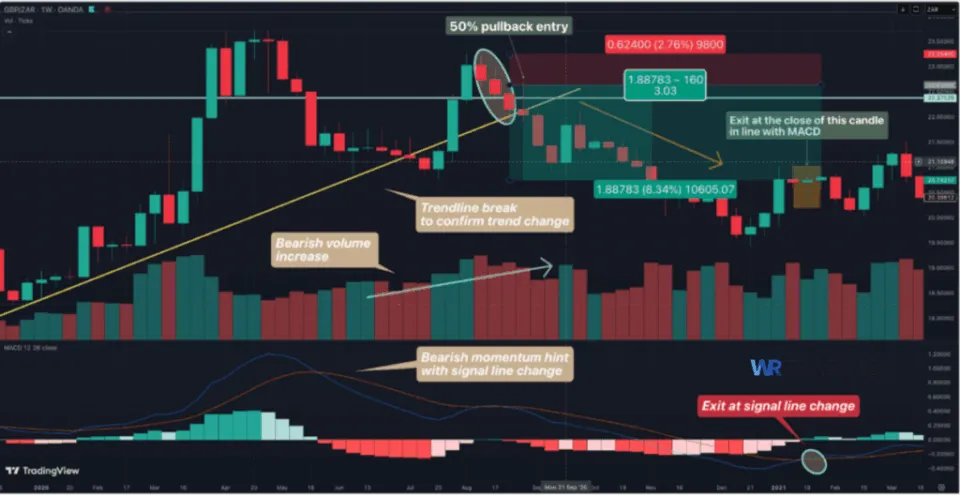
This was a reversal position on GBPZAR, as evidenced by the market breaking the trendline. Although it retraced, the subsequent crows pattern indicated bearish momentum. It formed afterwards to breach the trendline.
Other confirmation factors:
- There was a signal line change on the MACD
- Bearish volume as the market broke the trendline
While a trader could have entered following this pattern, the pullback entry would have been a better option (at the entry price of 22.63000, 50% of the formation).
Your stop loss would have been at 23.25400, the high of the identical three crows. Using the signal line change on the MACD would have provided the optimal exit point (20.74217) at the close of the aligning candle.
What Is The Success Rate Of The Identical Three Crows Candlestick Pattern?
According to Thomas Bulkowski (in his comprehensive Encyclopedia of Candlestick Charts book), the identical three crows setup produced a bearish reversal 79% of the time.
This means that the pattern is quite accurate (maybe up to 79% accurate under the best conditions). Interestingly, the author ranked the identical three crows 24th out of the 103 formations reviewed. They also noted that the pattern rarely appears in the market.
Still, traders should be aware of the factors that influence its effectiveness:
- Pattern location: Traders should ensure the optimal location for the pattern, not weak areas which aren’t structural turning points (like trendlines and key support).
- Candle quality and symmetry: All three candles of the identical three crows should be uniform or very similar in size and not uneven.
- News catalysts: It’s best to avoid trading any chart pattern before a major economic news event, as these periods can bring erratic market movements.
- Volatility conditions: Ensure that above-average volatility is present to increase the likelihood of a quick follow-through. Low volatility environments mean the identical three crows is likely to stall.
Is The Identical Three Crows Candlestick Pattern Suitable For Beginners?
Generally, the identical three crows isn’t suitable for beginners. We believe that while it promotes structured analysis, it is a rare pattern that takes some trading experience to identify correctly. Hence, beginners can easily force similar-looking patterns.
Still, the identical three crows isn’t the most difficult formation to trade. Beginners can grasp the pattern within a year of regular screen time to capitalise on trend exhaustion and momentum shifts.
(Learn To Trade And Read Candlestick Patterns Like A Pro)
What Are The Pros And Cons Of the Identical Three Crows Pattern?
Pros
- High visual clarity and pattern consistency: Once you’ve detected the pattern, the identical three crows offers a clean and clear structure, allowing for a consistent signal.
- Provides statistically backed edge: The identical three crows shows a relatively high success rate based on research.
- Supports disciplined trading through rule-based criteria: As the setup has strict formation rules, the identical three crows encourages discipline and structured decision-making.
Cons
- Low occurrence: The identical three crows seldomly appears, meaning there are fewer opportunities to take advantage of the pattern.
- Requires accurate analysis for reliability: Trading this formation requires excellent technical and contextual analysis, making it more suitable for experienced traders.
- Easily confused with similar patterns: It’s easy to confuse the identical three crows with the three black crows, which has different rules of identification.
Can The Identical Three Crows Have Failure Signals?
Yes, the Identical Three Crows pattern can fail at least 50% of the time. Elements that cause this include a lack of context, a lack of volume and unfavourable market environments. Traders can explore similar alternatives like the evening star and three inside down, which appear more regularly and have proven reliability.
Which Indicators Can Be Combined With The Identical Three Crows to Increase Its Success?
The most suitable indicators should offer insights into momentum, trend and volatility changes. Here are a few to consider, along with their ideal settings.
Moving averages
Moving averages demonstrate the broader direction in relation to whether the price is above or below them. Use this indicator to confirm a downtrend and dynamic resistance (which can be a notable location for the three crows).
Ideal setting: 50, 100, or 200 periods (depending on the time frame)
Relative Strength Index (RSI)
The RSI is a momentum indicator that validates overbought and oversold conditions. Traders would look at when the RSI exceeds the 70 mark (‘overbought’) as it suggests the chance of a bearish retracement. Divergence (where price makes higher highs while the RSI makes lower highs) is another trigger to use with the identical three crows.
Ideal setting: 14 periods (standard)
Moving Average Convergence Divergence (MACD)
The MACD is a trend-following momentum indicator with crossover signals. Look for a bearish crossover (when the MACD line crosses below the signal) at any point when the identical three crows has formed to indicate potential downward pressure.
Ideal setting: 12, 26, 9 (standard)
Bollinger Bands
Bollinger Bands are a volatility indicator that displays where the market is overextended. Traders should note when any of the identical three crows candles are outside the upper band as it is likely to close and trade further below.
Ideal setting: 20-periods, 2 standard deviations (standard)
Volume
Any volume indicator exists to show the strength of bearish pressure. Rising volume or spikes in volume while the identical three crows forms suggests commitment from sellers.
Ideal settings: use standard settings based on the specific volume indicator
(Learn To Trade And Read Candlestick Patterns Like A Pro)
What Are Similar Patterns To The Identical Three Crows Pattern?
Similar effective patterns to the identical three crows include:
- Evening star – a three-bar pattern starting with a bullish candle, followed by a small indecision and a strong bearish candle of similar or greater size to the first.
- Three inside down – a three-candle pattern that consists of a long bullish bar, a small bearish bar within its body and a third strong bearish bar closing below the first.
- Bearish engulfing – a two-candle formation where a bearish candle engulfs a previous bullish candle.
What Is The Opposite Pattern Of The Identical Three Crows?
The opposite pattern is the identical three white soldiers. It’s a bullish reversal setup that consists of three uniform and consecutive bullish candles with little to no lower wicks.
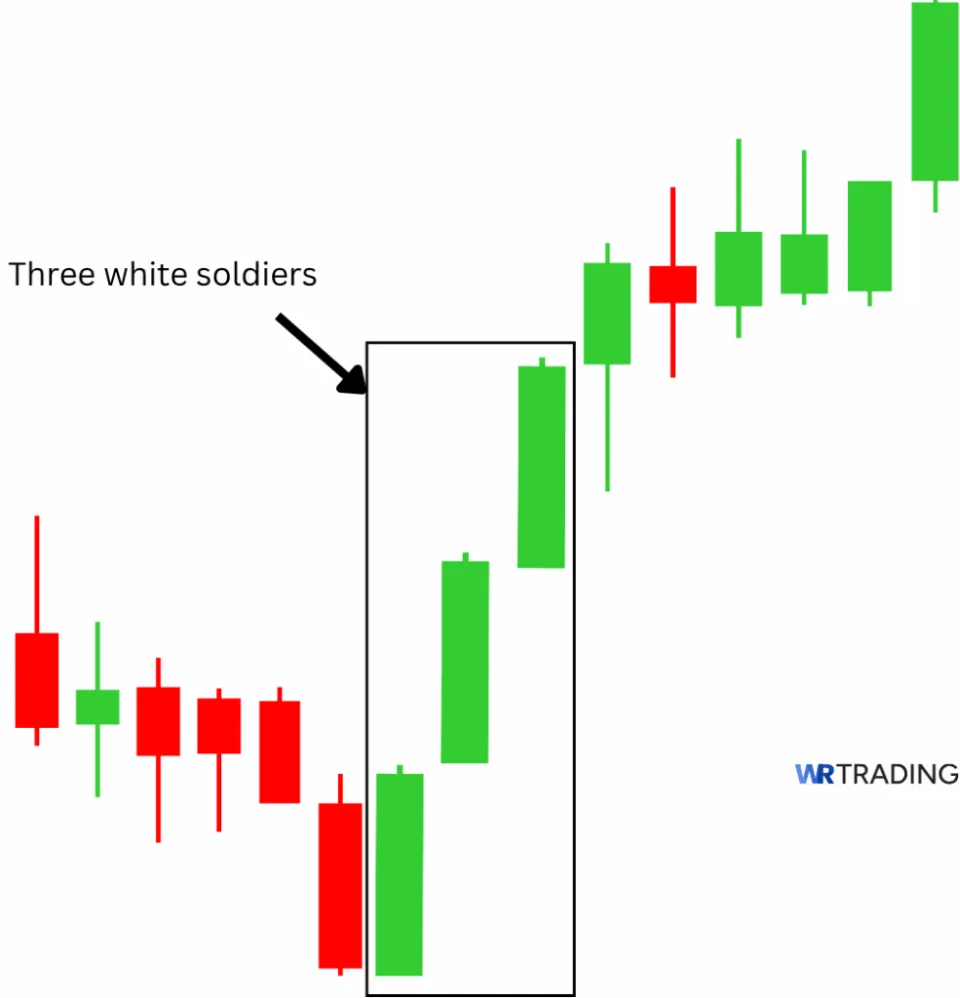
This formation is rarer than its counterpart in how many times it appears and in previous studies. The popular alternative, instead, is the three white soldiers.
What is The Difference Between The Identical Three Crows And The Three Black Crows Pattern?
The identical three crows pattern is a slight variation of the well-known three black crows. It differs mainly in that all three candles are ‘identical’ (or nearly so) in size and structure. Meanwhile, the candles in the three black crows do not need to be alike.
Ultimately, while the identical three crows is more refined and rarer than the three black crows, both patterns indicate the same bearish pressure.
Learn Pattern Trading With The WR Trading Mentoring
Trading patterns like the identical three crows goes beyond spotting three candles. Many easily lack the precision, contextual understanding and strategic execution needed to trade these and other setups; that’s where WR Trading comes.
Through personalised coaching, real-market walkthroughs, and structured trade planning, we equip aspiring traders to identify high-probability formations and trade them with discipline and confidence. We also offer learning resources and trading tools that are further aids for our users to trade effectively.
(Learn To Trade And Read Candlestick Patterns Like A Pro)
Conclusion: The Edge Behind the Identical Three Crows
The identical three crows is a high-probability reversal pattern when used with proper confluence. As we’ve explored throughout this guide, understanding its structure, psychology, and ideal placement makes all the difference.
Still, no candlestick pattern should be used in isolation. In our experience, consistent results are achieved by blending technical analysis with broader market context and utilising indicators for confirmation.
Whether it’s the MACD signaling momentum, volume spikes backing the move, or a Fibonacci level aligning with resistance, the power lies in confluence. While the identical three crows has a limited appearance, you should be well-equipped with this article to trade it confidently when it does occur.