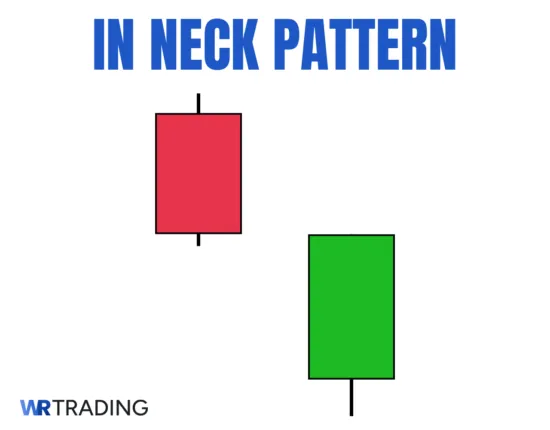
The In Neck candlestick pattern is a two-candle bearish continuation setup that forms in downtrend conditions. It starts with a long red candle, followed by a smaller green candle. The second candle opens below the first candle’s low but closes near the first candle’s close, without pushing significantly higher. This failed recovery attempt signals that sellers are still in control, and the downside momentum is likely to continue.
To trade the In Neck pattern, traders enter a short position below the low of the second (bullish) candle, confirming the continuation of a downtrend. A stop-loss is placed either above the high of the first (bearish) candle or above the high of the second candle, depending on the trader’s risk tolerance and market conditions.
Key Facts about how the In Neck Candlestick Pattern is formed:
- Construction:
- First Candle: Strong red candle.
- Second Candle: Small green candle that opens below the first candle’s low and closes near the first candle’s close (but not above the midpoint).
- Type of Pattern: Continuation.
- Trend Prior to the Pattern: Bearish.
- Opposite Pattern: Bullish Piercing Pattern.
- Entry Options: Aggressive entry after the close of the second candle. Conservative entry immediately after bearish confirmation candle formation.
- Stop-loss placement: Above the high of the second candle for conservative traders; above the pattern’s range for aggressive traders; above nearby resistance.
- Interpretation: The In Neck pattern signals failed buying pressure. The second candle represents a weak bullish attempt that gets shut down, confirming that sellers are still dominating the market.
(Learn To Trade And Read Candlestick Patterns Like A Pro)
How Is The In Neck Pattern Formed?
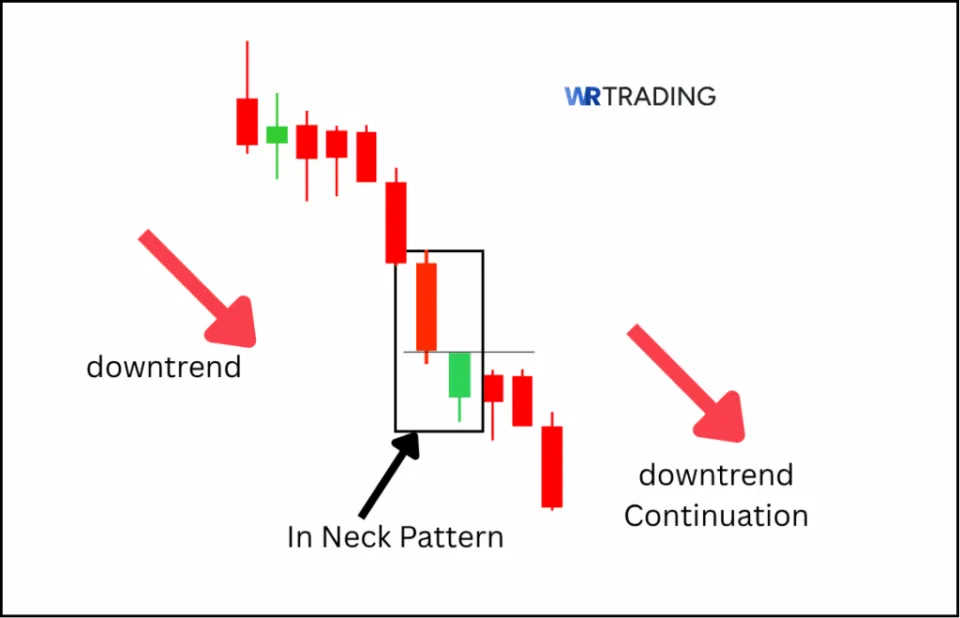
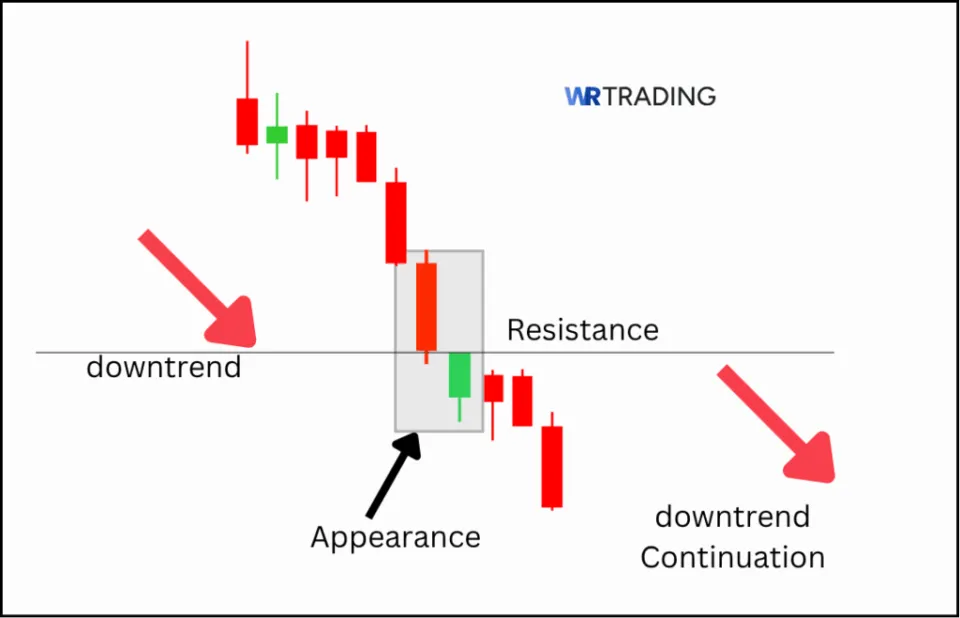
The In Neck pattern forms during an established downtrend and consists of two candles. It’s a bearish continuation signal that appears when price attempts a shallow recovery but fails to reverse the trend.
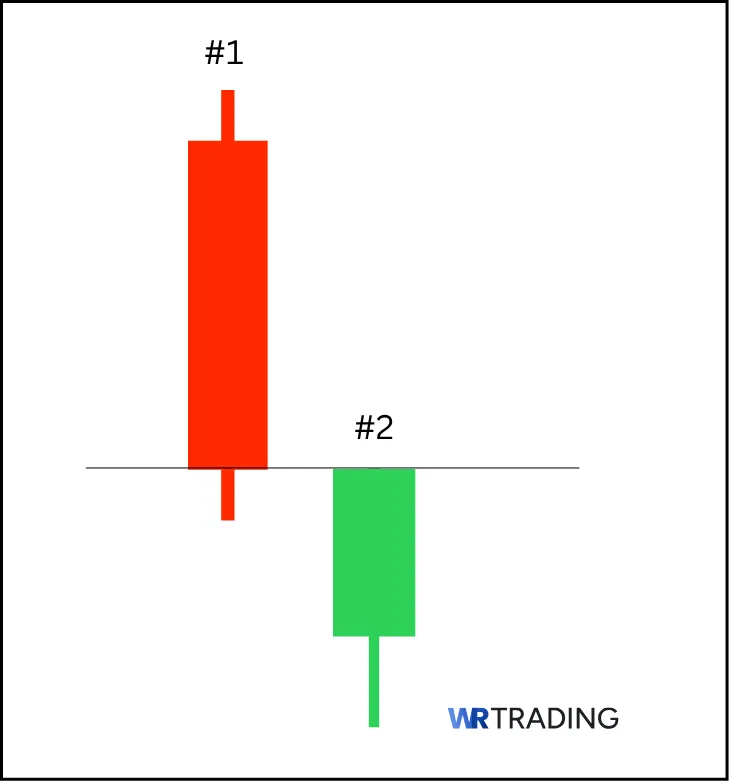
The first candle is a long red candle that confirms that sellers are in control and that the market is moving lower with strong momentum. The second candle is a small green candle that opens below the first candle’s low but closes near or slightly above the first candle’s close. However, it never breaks past the midpoint of the first candle’s body.
After the In Neck pattern forms, the trend typically resumes to the downside within the next few candles. The entire structure fits into just two sessions or bars, and it can appear on any timeframe, although it tends to be more reliable on 4H, daily, or weekly charts, where market noise is lower.
This pattern shows up when buyers try to push back but lack momentum. These characteristics, altogether, signify that bearish continuation is more likely than reversal.
What Does The In Neck Candlestick Pattern Mean?
In the In Neck pattern, when price closes near the same level as the previous session, it means that buying pressure is weak and sellers are still in control.
Psychologically, some traders may interpret the green candle as a potential reversal, but the shallow close exposes the reality: it’s a pause, not a shift. The market remains tilted toward the downside. Smart money often uses this kind of setup to trap early buyers and reload shorts.
We treat the In Neck pattern as a sign of bearish conviction, not indecision. It gives us clues that the trend is intact, and price is likely to move lower, especially if the second candle appears near resistance or after a failed breakout.
Is The In Neck Candlestick Pattern Bullish?
No, the In Neck pattern is a bearish continuation pattern.
Where Does the Name of the In Neck Come From?
The In Neck pattern gets its name from the second candle closing “in the neck” of the first candle’s body, hovering just above or near the previous close without breaking higher. The proximity of the second candle relative to the first forms a sort of neckline.
(Learn To Trade And Read Candlestick Patterns Like A Pro)
What Is An Example Of The In Neck Pattern?
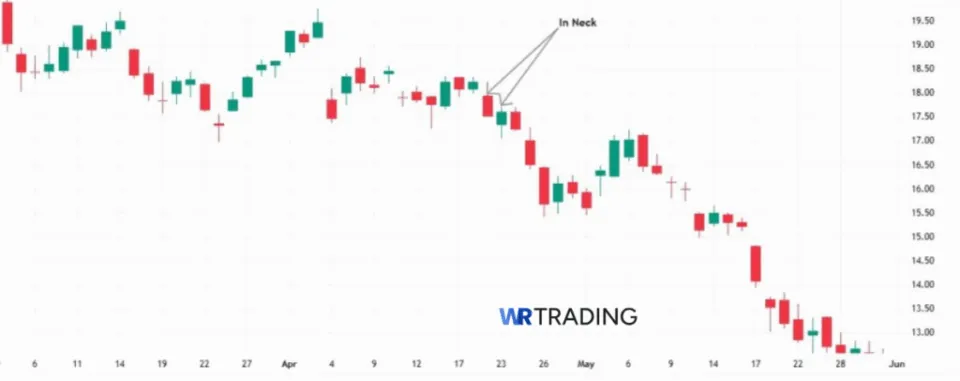
A clean In Neck pattern appeared on the TSLA DAILY chart on the 22nd and 23rd of April, 2019.
- First Candle (Bearish): Tesla stocks were dropping, and for this particular candle, price opened at 17.93 and closed at 17.52, forming a strong red candle with a full-bodied drop and minimal wick.
- Second Candle (Bullish): The next daily candle opened at 17.34, dropped slightly, then recovered to close at 17.59. Although green, this candle closed just above the prior close without penetrating the body midpoint of the first candle.
This setup showed that buyers lacked conviction, and the attempt at a bounce was weak. Price continued falling over the next sessions, reaching 12.41 on May 23, 2019, confirming the pattern’s bearish continuation nature.
How To Identify The In Neck Pattern?
To identify the In Neck pattern, start by confirming a clear downtrend. Look for a series of lower highs and lower lows, or at least three consecutive red candles.
The pattern typically forms after a strong bearish candle, signaling seller dominance. So, look for a red candle, ideally with a full body and little to no lower wick. This candle signals high momentum to the downside. Next, look for a consecutive smaller green candle that opens below the low of the first, but then closes near or slightly above the first candle’s close.
On lower timeframes, confirmation tools are necessary to filter out noise when identifying this pattern. We often scan for this pattern during bearish pullbacks or near retests of broken structure.
How To Trade The In Neck Pattern
When trading this pattern, we only act on the setup when the market aligns with our core conditions: clean downtrend, resistance zones, and bearish continuation signals. Below is the exact process we use to turn this pattern into high-probability trades:
- Find the right setup for the In Neck formation
- Wait For The Appearance Of The In Neck Candlestick Pattern.
- Open Your Trade – Entry Point.
- Wait for a confirmation or not.
- Choose your trading take profit.
(Learn To Trade And Read Candlestick Patterns Like A Pro)
1. Find The Right Setup For The In Neck Formation
Start by identifying a clean downward structure; lower highs, lower lows, or price reacting off a key resistance zone. We prioritize these zones:
- Broken support now acting as resistance
- Fibonacci retracement levels like 0.382 or 0.618 in a bear leg
- Bearish trendlines or moving average retests (20 or 50 EMA on 4H chart)
Whenever price stalls below a former structure level and prints smaller bullish candles, we become interested. The In Neck works best after a rally within a downtrend, not at the start of a move.
2. Wait For The Appearance Of The In Neck Candlestick Pattern
Once in the zone, let the pattern complete. You’re looking for:
- A strong red candle with a clean body
- Followed by a green candle that opens lower, but closes near the first candle’s close
We don’t act on partial candles. Let both candles close fully. Avoid early entries; volume and candle shape matter.
3. Open Your Trade – Entry Point
After the pattern completes, we prepare the entry.
Entry Options
There are two entry types:
- Conservative: Enter after the green candle closes and a third red candle begins to form, showing confirmation.
- Aggressive: Enter at the close of the green candle, especially if it fails to close above the midpoint of the first red candle.
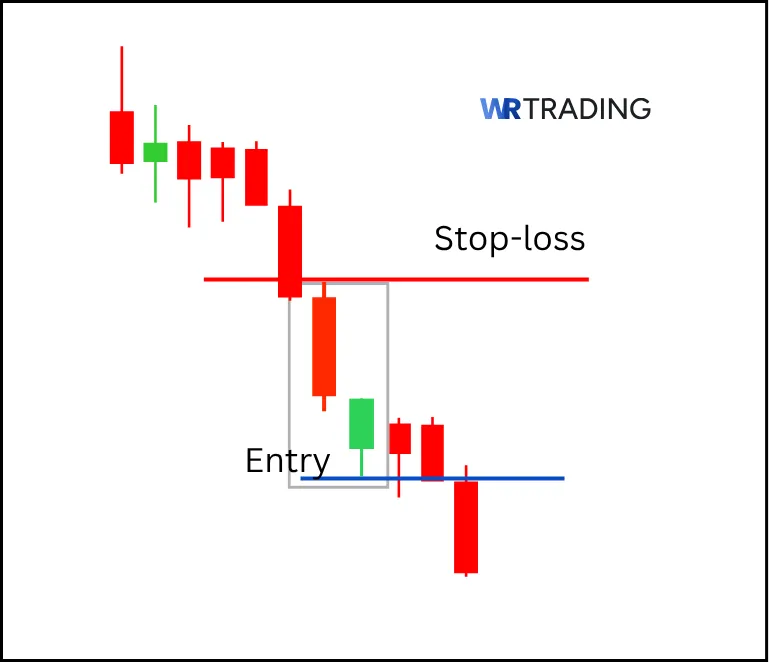
Stop-Loss Placement
You can place your stop loss in any of these places.
- Above the high of the green candle
- Or above the pattern’s entire range if volatility is high
- Use ATR (14-period) to size the stop in volatile markets.
We always calculate risk before entry. The risk per trade is kept between 1% – 2% of the account balance. Use pip calculators or position size tools to get exact lot sizes.
4. Wait For A Confirmation Or Not
Some setups need confirmation, others don’t. It is better to wait when:
- The second candle closes with a long lower wick (bullish rejection)
- You’re trading lower timeframes (15M, 1H)
- Pattern forms outside a clear resistance zone
You can use any of the following tools for confirmation:
- Bearish engulfing candle after the In Neck pattern
- MACD crossover to the downside
- RSI < 50 and turning down
- Volume spike on the red candle after the pattern
In a strong setup, we may skip confirmation. In choppy or unclear conditions, we demand it.
5. Choose Your Trading Take Profit
Your exit should be based on a clear market structure. Our take-profit logic is as follows:
- First Target (TP1): Nearest swing low or the last price base
- Second Target (TP2): 1.618 Fibonacci extension of the pullback leg
- Risk-to-Reward Ratio: Minimum 1:2. If stop is 25 pips, we look for 50 pips in reward
- Trailing Exit: Optional for momentum trades; trail once 1R is reached

We avoid fixed-pip exits. Instead, we let the chart decide. A proper In Neck pattern has momentum on its side. Use that momentum intelligently.
(Learn To Trade And Read Candlestick Patterns Like A Pro)
What Is The Success Rate Of The In Neck Candlestick Pattern?
The In Neck candlestick pattern has a win rate between 53% and 61% when traded in the right conditions. According to research by Thomas Bulkowski on candlestick continuation patterns, the In Neck showed reliable bearish continuation performance in structured downtrends, particularly on daily charts and above. In our internal trading logs, the pattern hit its first target 61.3% of the time when paired with confirmation and key resistance zones.
Its accuracy increases with:
- Strong preceding downtrend
- Pattern forming below key resistance or moving averages
- Confirmation candle or volume spike after formation
- Clean structure on higher timeframes (4H, Daily)
However, the hit rate drops below 50% in sideways markets or when traders ignore structure. Beginners often misinterpret the second candle’s green body as a reversal, which leads to early exits or missed opportunities.
Simply put, the pattern is reasonably accurate, but its success is heavily influenced by market context and execution discipline. For traders who follow a structured process, it can be a high-confidence setup.
Is the In Neck Candlestick Pattern Suitable For Beginners?
Yes, the In Neck pattern is suitable for beginners, especially when they learn to approach it the right way. Its structure is simple; just two candles. Its execution, however, is where most new traders struggle. The biggest challenge is recognizing that the green second candle is not bullish. Without this understanding, beginners may misinterpret the signal or exit too early.
That said, when taught properly with context, the pattern becomes an effective tool in the hands of beginners for learning price action discipline. We use it in our mentoring programs to teach students how to work with market structure, confirmation, and proper risk control.
Use the pattern only in clean downtrends, wait for full candle closes, and always combine it with a simple confirmation tool like trendlines or RSI. With these in place, beginners can be more profitable when trading this pattern.
(Learn To Trade And Read Candlestick Patterns Like A Pro)
What Are The Pros And Cons Of the In Neck Pattern?
Pros
- It is a visually simple two-candle structure.
- It is a reliable bearish continuation pattern in strong downtrends.
- It works well with confirmation tools.
- High potential for clean R:R setups.
Cons
- It is often misread as a reversal pattern.
- Weak on lower timeframes without confirmation.
- Depends heavily on proper context.
- Limited standalone strength. It needs confirmation.
What Are The Advantages Of The In Neck Pattern?
The In Neck pattern offers three standout advantages: clarity, continuation strength, and structure-based predictability. These benefits make it a valuable setup in the hands of a disciplined trader.
- Visually Simple Two-Candle Structure: The pattern’s format is easy to recognize: a strong red candle followed by a green candle with a shallow close. This makes it accessible to newer traders and efficient for rapid scanning across multiple charts.
- Reliable in Bearish Trends: In Neck setups shine when used within clear downtrends. They serve as continuation flags, offering traders a structured reason to stay with the trend or add to shorts after a brief pause.
- Works Well With Confirmation Tools: In our experience, trading this pattern with MACD crossovers, RSI drops, or volume spikes, tightens trade logic, improves trade outcomes, and boosts confidence in execution.
- High Potential for Clean R:R Setups: Typically, after the In Neck Pattern forms in a strong downtrend, price action continues to fall for a considerable period. This makes for an excellent risk-to-reward setup.
What Are The Disadvantages Of The In Neck Pattern?
Although it is an effective candlestick pattern, the In Neck pattern is not without its disadvantages. Below are some important ones:
- Often Misread as a Reversal Pattern: Many traders mistake the second green candle as a sign that the market is reversing. This misinterpretation leads to poor decision-making and missed opportunities.
- Weak on Lower Timeframes Without Confirmation: In Neck setups on the 15M or 1H charts, tend to produce noise. Without higher-timeframe confirmation or a clear structure, the signal loses its edge and produces more false setups.
- Depends Heavily on Context: Like many continuation patterns, the In Neck only works within a clean trend. If placed outside an ideal structure, like in consolidation or mid-range, it often fails. Market context is needed to validate the setup.
- Limited Standalone Strength: On its own, the pattern doesn’t guarantee direction. It needs confirmation or supporting evidence from price action or indicators. Using it without a broader strategy weakens its impact.
Can The In Neck Have Failure Signals?
Yes, and to a noticeable degree, the In Neck pattern can fail. Failure often occurs when:
- The pattern forms during a sideways market.
- The second candle closes too strongly, suggesting real buyer strength.
- There’s no confirmation from market structure or indicators.
- Volume is low or inconsistent during the setup.
These situations signify a false bearish signal, where price breaks lower but quickly reverses, stopping out traders. That’s why we treat the In Neck candlestick pattern as a clue, not a trigger, until it aligns with broader structure and market dynamics.
Which Indicators Can Be Combined With The In Neck To Increase Its Success?
Using confirmation indicators improves the accuracy and dependability of the In Neck pattern. Here are some that we use:
- RSI (14-period): We look for RSI trending below 50 and ideally turning downward when the In Neck forms. This confirms bearish momentum; if RSI shows divergence against the second candle, even better.
- MACD (12, 26, 9): A bearish MACD crossover after the pattern strengthens conviction. We also watch for shrinking histogram bars leading into the setup, a sign that buyer strength is fading.
- Volume Profile / Session Volume: Spikes in volume on the first red candle or a volume drop on the second green candle are important. It signals a fake-out bounce and validates bearish continuation.
- ATR (Average True Range – 14-period): We use ATR to size stop losses based on volatility. It helps prevent getting stopped out by random noise while keeping risk consistent across trades.
- Fibonacci Retracement (0.382 / 0.618 / 0.786 levels): Patterns that appear after pullbacks to these levels, especially within a strong trend, gain extra importance. If price forms an In Neck setup near 0.618 resistance, we prioritize that trade.
When used in combination, these tools filter out weak setups and strengthen pattern-based trading.
(Learn To Trade And Read Candlestick Patterns Like A Pro)
What Are Similar Patterns To The In Neck Pattern?
Here are candlestick patterns that share structural and psychological traits with the In Neck:
| Pattern Name | Type | Description |
|---|---|---|
| On Neck | Bearish continuation | The green candle closes exactly at or slightly above the first red candle’s close, showing weak buying. |
| Thrusting Pattern | Bearish continuation | The green candle pushes deeper into the red candle’s body, but still closes below its midpoint. |
| Piercing Pattern | Bullish reversal | The green candle opens below the red candle’s low and closes above its midpoint, suggesting buyers are taking over. |
| Dark Cloud Cover | Bearish reversal | Red candle opens above a prior green candle and closes below its midpoint, showing rejection of higher prices. |
| Bearish Harami | Bearish reversal | A small green candle is contained within a large red candle. Suggests hesitation in an uptrend, but less aggressive than In Neck. |
These patterns either confirm a bearish outlook or visually resemble the In Neck structure, but vary in interpretation and context. Learn more about candlestick formations in our free trading candlestick patterns PDF.
What Is The Opposite Pattern Of The In Neck?
The opposite of the In Neck pattern is the Piercing Pattern. It is a bullish reversal setup formed during a downtrend. It starts with a strong red candle, followed by a green candle that opens below the first candle’s low and closes above the midpoint of the red candle’s body. This shift in control from sellers to buyers contrasts with the In Neck’s failed bullish recovery and bearish continuation tone.
What Is The Difference Between The In Neck And The On Neck Candle Pattern?
The In Neck and On Neck patterns are often confused with each other, but they differ slightly in the second candle’s closing level. In our opinion, the On Neck pattern is one of the better alternatives out there for the In Neck pattern. See the major points of difference between the two below:
| Aspect | In Neck Pattern | On Neck Pattern |
|---|---|---|
| Second Candle Close | Slightly above or near the prior close | Closes exactly at the prior close |
| Implication | Slight bullish attempt, still weak | No attempt to push higher, even weaker |
| Interpretation | Bearish continuation with minor buyer push | Bearish continuation with stronger seller-hold |
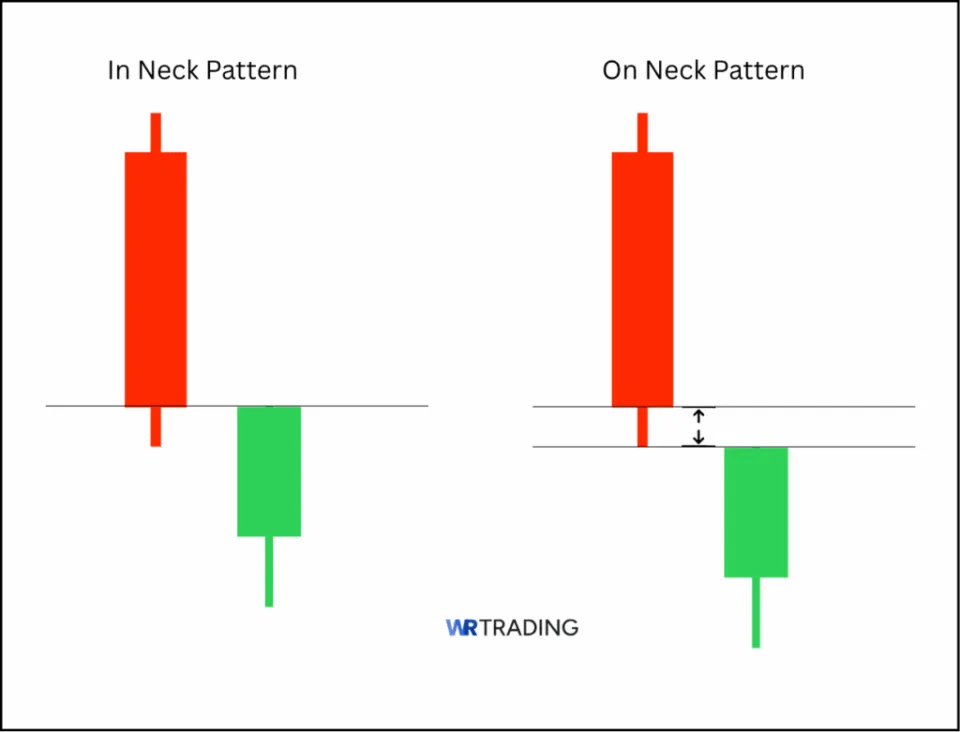
In practice, both indicate continuation, but the On Neck is more decisive in signaling no buying strength at all, while the In Neck shows a brief but ineffective push.
What Is The Difference Between The In Neck And The Thrusting Candle Pattern?
The Thrusting pattern is a bearish continuation like the In Neck but shows more bullish pressure. After a strong red candle, the green candle opens lower but closes deeper into the body of the red candle, typically near its midpoint, but not beyond it.
This close demonstrates that buyers made more progress than in the In Neck pattern, yet still failed to reverse the trend. As such, the Thrusting pattern is seen as less bearish than the In Neck and can sometimes cause hesitation before continuation.
What Is The Difference Between The In Neck And The Piercing Candlestick Pattern?
The Piercing Pattern is a bullish reversal, the direct opposite of the In Neck. It forms after a downtrend, starting with a red candle followed by a green candle that closes above the midpoint of the first candle’s body.
While the In Neck shows that buyers fail to reclaim lost ground, the Piercing Pattern shows that buyers succeed in taking back control. The difference lies in trend direction, candle structure, and meaning. One favors continuation, the other signals reversal.
What Are The Limitations Of The In Neck Pattern?
- Low Effectiveness in Sideways Markets: Without trend structure, the pattern loses reliability.
- Misinterpretation Risk: Traders often confuse it for a bullish setup due to the green candle.
- Lacks Power Without Confirmation: Needs volume, structure, or indicator support to raise confidence.
- Not a Standalone Signal: Works best as part of a broader trading system, not in isolation.
- Timeframe Dependency: More effective on 4H and Daily charts. Lower timeframes produce noise.
Learn Pattern Trading With WR Trading Mentoring
At WR Trading, we go far beyond textbook definitions. We train traders to use candlestick patterns like the In Neck inside a structured, rules-based trading system. Our mentorship is focused on real-world execution.
Inside the WR Mentoring Program, we break down setups with precision:
- How to use multi-timeframe context for cleaner entries
- How to combine volume, structure, and confirmation indicators
- How to filter false signals using rule-based strategies
- How to build a repeatable routine that compounds small wins into long-term gains
Our live trade breakdowns, one-on-one feedback, and weekly workshops help traders master not just patterns, but how to trade them like pros. Whether you’re a beginner or experienced trader, our mentorship turns raw setups like the In Neck into structured opportunities with measurable edge. Anyone can see a pattern. However, trading it with confidence takes training.
(Learn To Trade And Read Candlestick Patterns Like A Pro)
Conclusion: Trade the In Neck Pattern With Structure, Not Assumption
The In Neck candlestick pattern is a clear-cut bearish continuation signal when used properly. It tells us one thing: sellers are still in control, and that attempts at a reversal lack conviction. With its simple two-candle structure and straightforward logic, the pattern is a powerful addition to any trader’s technical analysis playbook when used in the right market context.
From our experience, the In Neck pattern works best on higher timeframes like the 4H and Daily charts. We don’t touch it in sideways markets or without a clear trend structure. It’s not a reversal signal, and treating it as one leads to unnecessary losses. To trade it, traders enter below the low of the second candle, and place stop loss above the high of the first candle or the second candle to manage risk.
What gives this pattern its edge is the discipline to wait for full confirmation, combine it with volume, structure, and momentum tools, and only trade when everything lines up. For traders who value logic, repetition, and structured execution, the In Neck pattern offers consistent setups. Use it with purpose, and it will be one of your most dependable tools for spotting trend continuation.