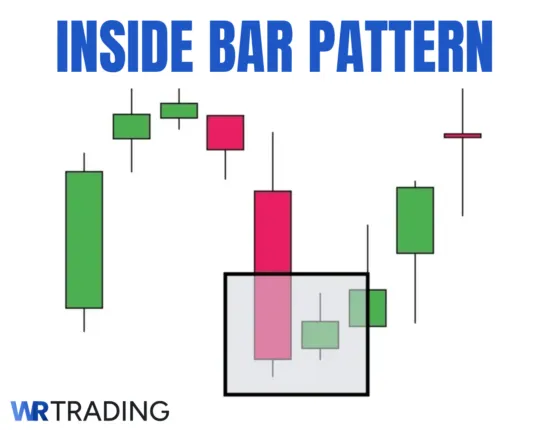
The inside bar pattern consists of two candles: a large or ‘mother’ bar next to another smaller ‘bar.’ The latter is said to be ‘inside’ the former (or engulfed by it) – hence the term ‘inside bar.’ It’s a standard price action trading setup used for identifying breakouts.
Key Facts Inside Bar Candlestick Pattern
- Construction consists of two candles
- First Candle: Large, full-bodied candle with minimal wicks
- Second Candle: Smaller-bodied candle; may have tiny or noticeable wicks
- Type Of Pattern: Primarily continuation
- Trend Prior The Pattern: Bullish or Bearish
- Opposite Pattern: Outside bar
- Stop-Loss Placement: Below/above the low/high of the mother bar; below the low/above the inside bar’s high; ATR-based stop; moving average stop; Fibonacci stop
(Learn To Trade And Read Candlestick Patterns Like A Pro)
Examples of The Inside Bar Pattern
Here, we explore how to trade the pattern and other crucial information, such as various strategies to maximize its effectiveness and hit rate. Let’s look at this pattern in three different scenarios with brief explanations.
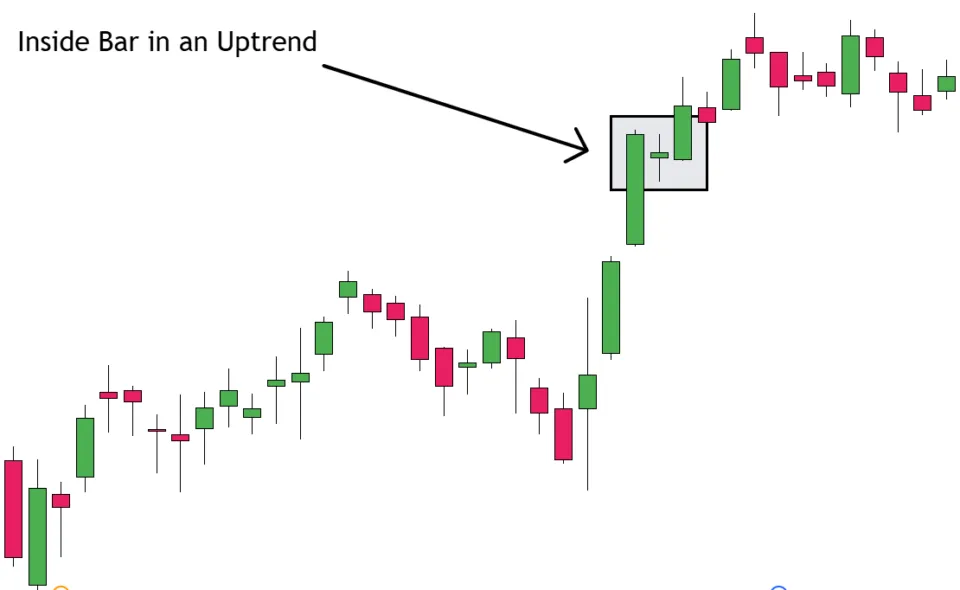
Inside Bar in an Uptrend
- Description: This happens when price is trending upward, with the inside bar appearing as a temporary consolidation in this move
- Implication: It generally indicates that the uptrend will likely continue if the breakout happens above the mother bar.
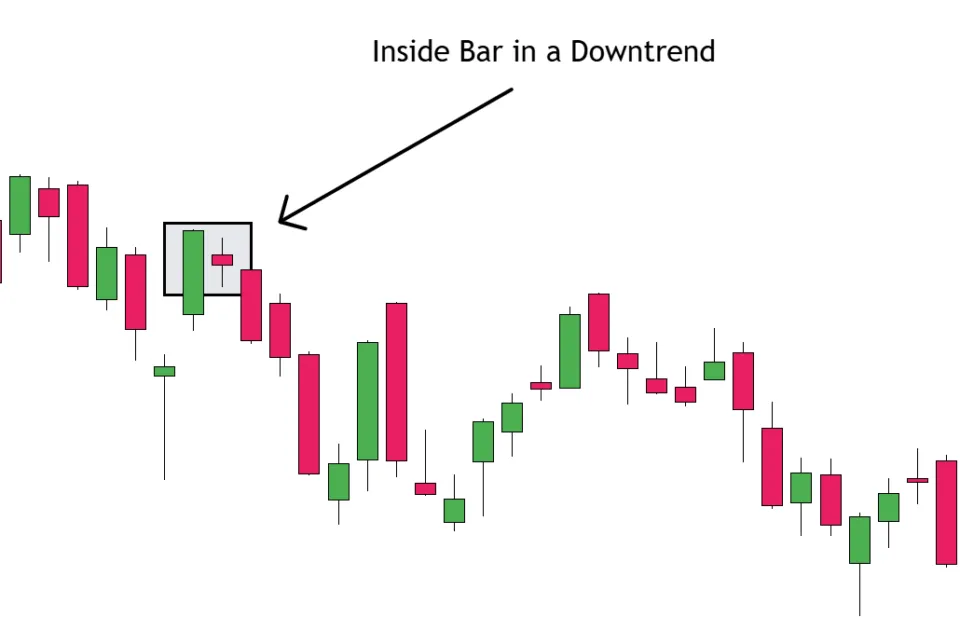
Inside Bar in a Downtrend
- Description: This happens when a particular market is trending downward. The inside bar would represent a momentary pause in selling pressure.
- Implication: It often implies a continuation of the downtrend if price breaks below the mother bar’s low.
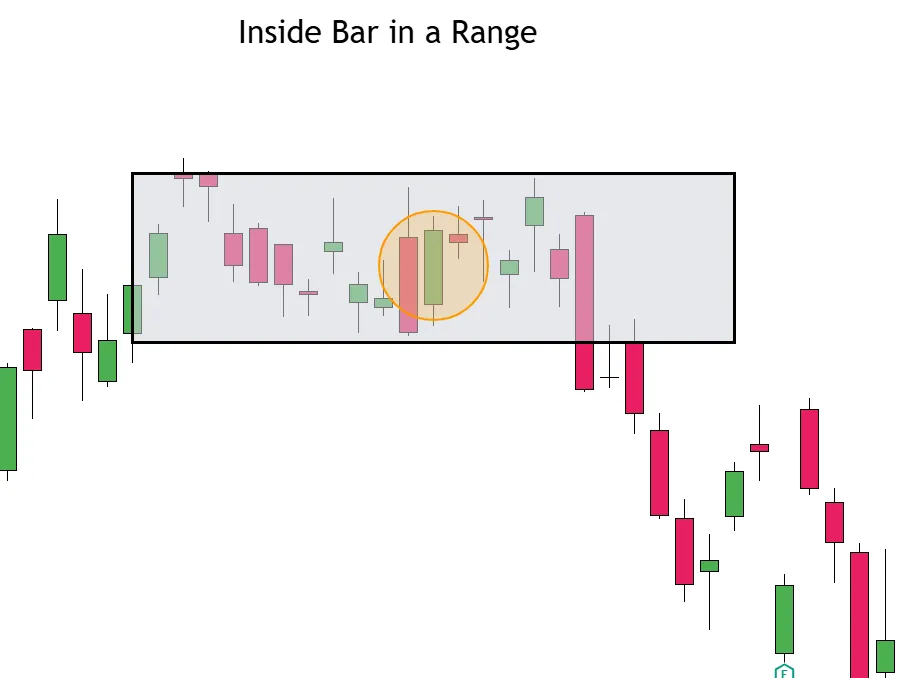
Inside Bar in a Range
- Description: Inside bars in this scenario appear due to a sideways-moving or range-bound market. You may see a few inside bars (or similar patterns) in this tight range.
- Implication: Consolidation represents indecision. As a result, a strong breakout usually occurs, which can begin a new trend.
Later on, you will see a few real-life examples of inside bars in most of these scenarios.
(Learn To Trade And Read Candlestick Patterns Like A Pro)
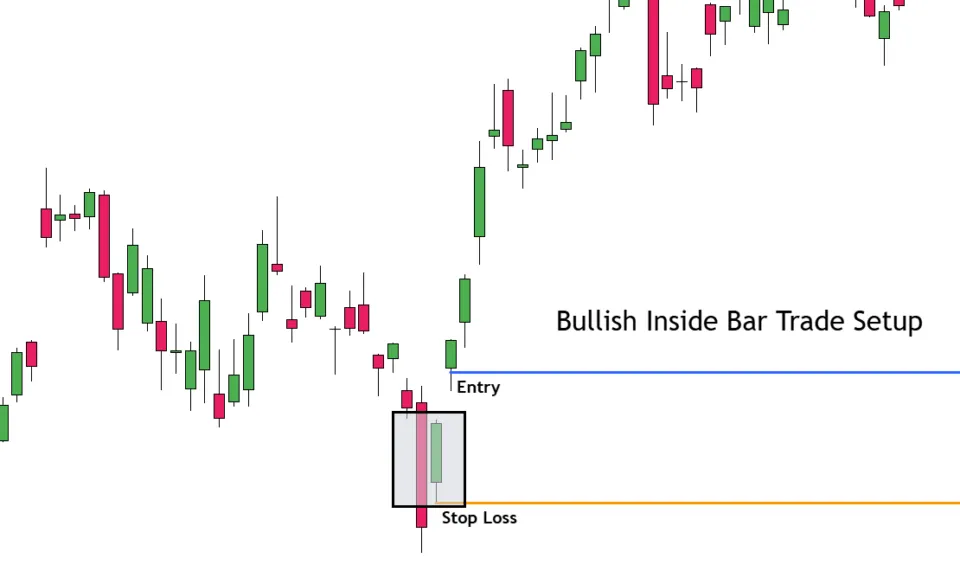
What Is a Bullish Inside Bar Pattern?
This pattern contains a small red-coloured candlestick (inside bar) on the right within the range or body of a larger green-coloured candlestick (mother bar). It signals a reversal (in a downtrend) or continuation (in an uptrend).
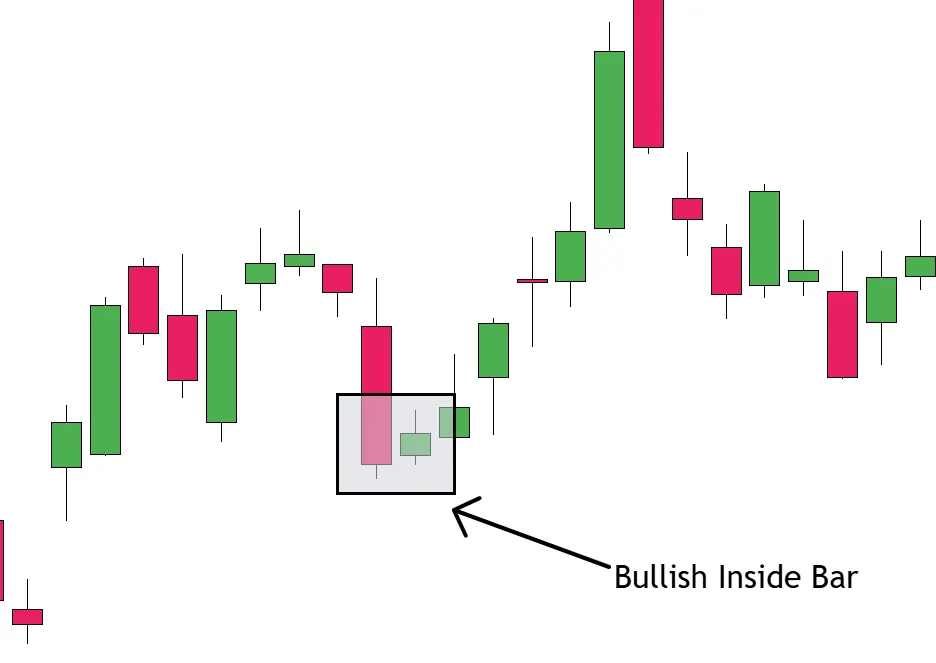
This formation suggests that buyers are accumulating positions, leading to a breakout to the upside.
What Is a Bearish Inside Bar Pattern?
This formation comprises a small green-coloured candlestick (inside bar) left next to the range or body of a larger red-coloured candlestick (mother bar). It hints at a reversal (in a downtrend) or continuation (in an uptrend).
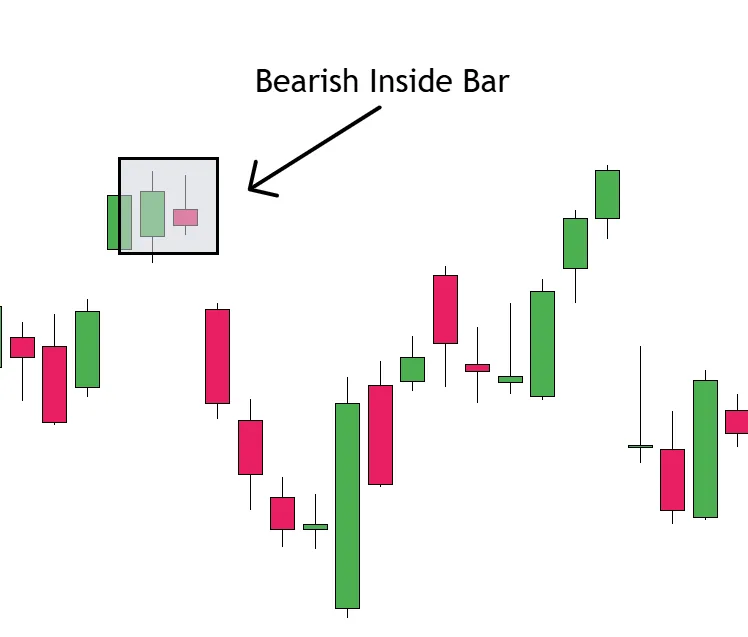
There is hesitation among buyers and potential control by sellers, leading to a downward breakout.
What Does the Inside Bar Candlestick Pattern Mean?
Psychologically, the inside bar comes after a phase of market consolidation where neither buyers, nor sellers dominate. Essentially, traders were thinking of the next move. This indecision may be due to a pending news event, accumulation of orders by institutional traders (or ‘smart money’) or simply profit-taking.
Let’s look at common instances of the inside bar and what it represents:
- Trend continuation: When you see this pattern in this scenario, dominance remains firmly on one side
- Trend reversal: Here, the dominant side has weakened considerably. One reason may be the expectation of a fundamental analysis shift. If the inside bar appears at a key support/resistance level, the reversal may be a result of a fear of losing profits (as we usually expect price to turn in these areas).
(Learn To Trade And Read Candlestick Patterns Like A Pro)
How To Trade The Inside Par Pattern
There is much to know when trading this formation. So, here are the steps to trade the inside bar pattern:
- Find the right inside bar setup
- Enter the inside bar setup (including having a solid stop loss strategy)
- Choose your trading take-profit
Find The Right Inside Bar Setup
The perfect setup should consist of the following:
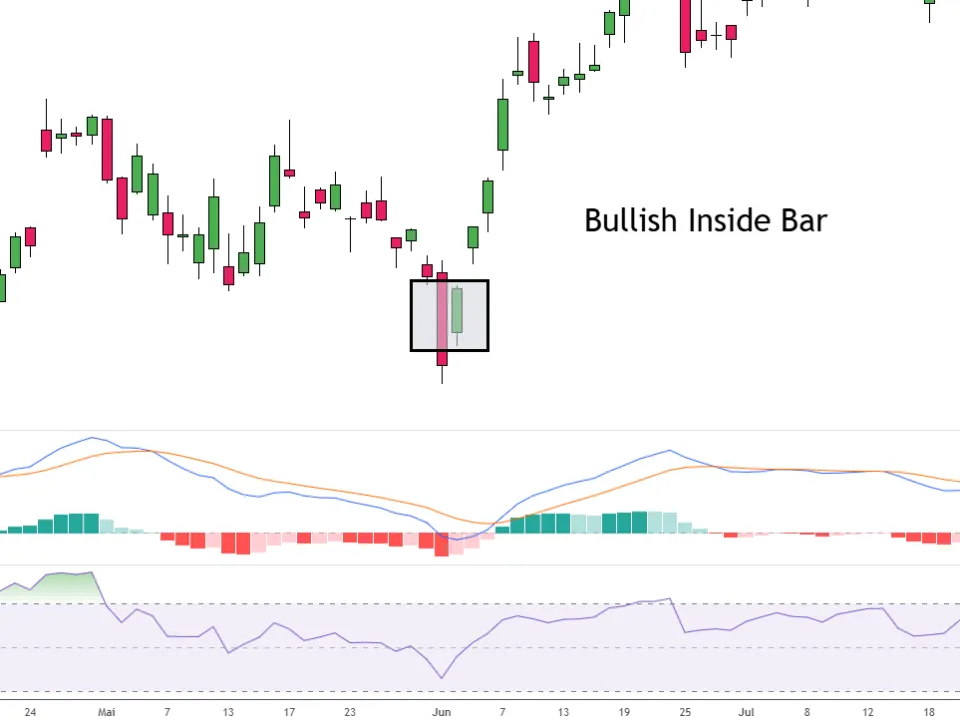
- Volume analysis: Analysing the volume once the inside bar appears can provide key information. Firstly, look for high volume after seeing this pattern, as it signals the likelihood of a strong breakout. If the volume remains the same (or increases) after the latter happens, it signals a higher-conviction entry.
- Trending market: The design of inside bars naturally lends itself to a trending movement. The larger or ‘mother’ bar indicates that there was dominance in its relevant time session. Meanwhile, the smaller bar simply represents a pause.
Still, some skilled traders can also trade the inside bar during a ranging market, provided there is enough confluence (leading us to the next part of an ideal setup).
- Strong confluence: Context matters when trading any chart pattern. While inside bars that appear on higher time frames are more reliable than those on lower ones, confluence is key. In other words, this means having a few other confirmation factors around the pattern.
And what would this confluence include?
- Support and resistance (include regular and from indicators like moving averages)
- Consolidation patterns (e.g., triangles, pennants, double tops/bottoms)
- Fibonacci retracements
- Trendlines
Let’s look at an example to illustrate the importance of strong confluence. The first is a well-defined inside bar on the daily chart of GBP/USD.
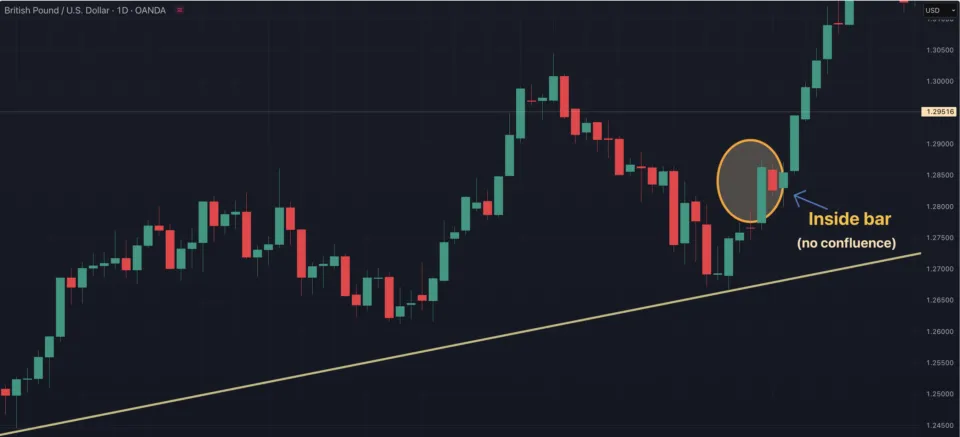
Firstly, we are viewing an uptrend here. Then, we also see a bullish inside bar (marked with an ellipse), which happened days after a pullback stemmed from the trend line. It would be a different situation if the pattern formed on the line itself.
Still, it appeared in a random area within the trend. Although it caused a continuation of the trend, the next example provides more confidence in the setup.
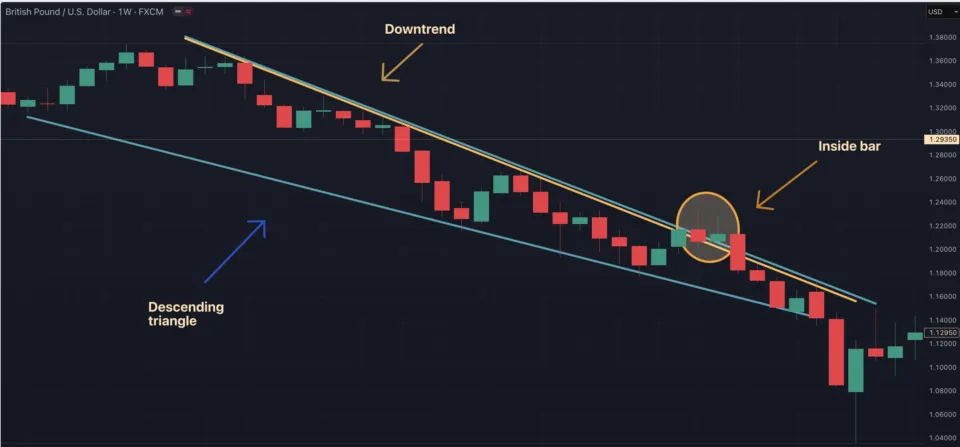
In the next example, GBP is bearish on the weekly chart, judging by the downtrend (orange line). This market was also in a descending symmetrical triangle, with a bearish inside bar forming on either line. Eventually, the pair dropped as it broke out of the triangle, which stemmed from the pattern.
Overall, the second example provides more context than the first. This is crucial when finding the ideal setup.
Enter The Inside Bar Setup
By now, you’ve identified the inside bar pattern within some volume behind it and a clearly trending market with confluence. Then comes the challenging part of deciding the best entry. There is no best way, as it depends on the trader.
Still, we believe it’s better to be conservative than aggressive in your approach. Let’s describe each method:
- Breakout entry (somewhat aggressive): This is usually the standard method. You enter the inside bar setup once the price clearly breaks above or below the mother bar. As soon as the break happens, you can place a limit order or enter the trade manually.
The main benefit is that you are guaranteed to be in the position – the downside is that you may be entering into a false break.
- Breakout and retest entry (conservative): Here, the trader waits for the breakout. Should the market retest any part of the inside bar range, they enter during this time.
The main advantage of this approach is that the trader gains a more optimal entry, which increases their potential reward. Unfortunately, you could miss out if the price simply doesn’t retest, and you have to determine where it is likely to retest (as it may not cover the full range).
As a bonus tip, you can confirm the strength of the breakout in a shorter time frame. For example, seeing an overbought scenario here when the price exceeds the high/low of the mother bar may be one sign of a true breakout.
- False breakout (contrarian): This is where you ‘fade the move.’ Should the price break out of the inside bar but quickly reverse back in the range, you open a trade in this opposite direction.
This method may form part of a trading plan for taking advantage of false breakouts, which can happen with this pattern. Still, there is no guarantee that the price will move substantially in the opposite direction – it may simply be retesting the range before following the previous trend.
Now, we have to consider the best stop loss placement. Here are techniques you can use:
- Classic: (placing the stop loss below/above the low/high of the mother bar). This is best in strong trending markets.
- Inside Bar Low/High Stop: (placing the stop loss below the low/above the inside bar’s high. While allowing for less ‘leeway’ in your stop, this technique may work for traders seeking tighter risk management and higher reward potential.
- ATR-based stop: Traders who seek to adapt to market volatility can consider this approach. The Average True Range indicator advises how many pips/points/ticks a market has moved within a particular time frame.
This can guide traders on how wide the stops may be. Still, you will want to place some distance above or below the inside bar instead of a random spot.
- Moving average stop: Another indicator that traders can use to set their stops is the moving average. The latter may act as a ‘dynamic stop’ (i.e., moving your stop loss along the trail of the MA). Simply put, traders would place their stop below the indicator (e.g., 20 or 50 MA) in a bullish inside bar setup or above the indicator in a bearish inside bar setup.
- Fibonacci stop: Traders can opt to use Fibonacci retracement levels of the inside or mother bar to place their stops. Higher levels like 61.8% and 78.6% are the most preferred as they provide a wider placement, making it less likely to be exited out of your trade prematurely.
(Learn To Trade And Read Candlestick Patterns Like A Pro)
Choose Your Trading Take Profit (Goal Of The Setup)
So, you have determined how you’ll enter and exit the inside bar pattern. If your setup works out as planned, a solid profit-taking plan should be in place. The natural area is to target the nearest key support or resistance zone. This is because the market expects the price to stall around these areas, making it the perfect time to exit.
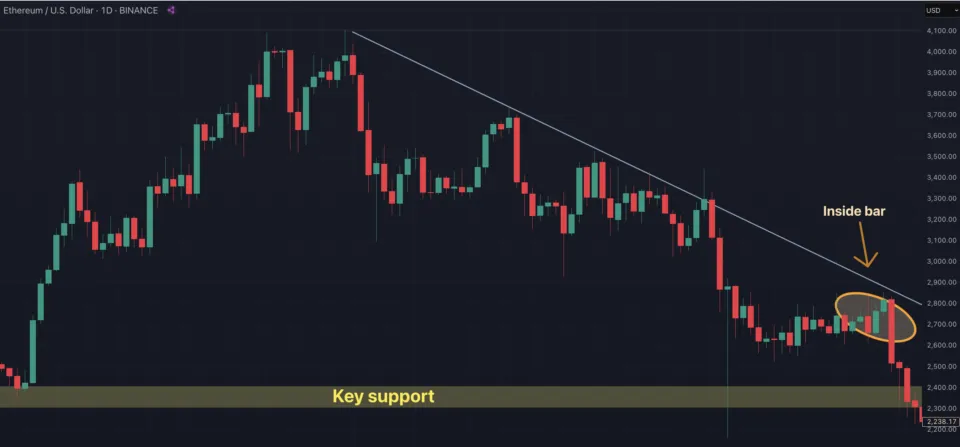
Above is an example of a downtrend on the daily chart of Ethereum. We see a bearish inside bar pattern near the trend line. The $2131 level was the obvious key support in this instance. So, you would have considered taking profits around this area. We also recommend using the Fibonacci retracement tool to manually lock in your gains as the market moves in your direction.
Other traders may use a trailing stop instead of waiting for some time (with no guarantee of a favourable outcome) for the market to reach the key level. This approach is designed to help you lock in profits more consistently at predetermined increments.
Still, you will likely be kicked out prematurely and lose out on larger gains that would have been possible if you waited for the market to hit key support or resistance.
Regardless of the approach, having a favourable risk-to-reward ratio (ideally at least 1:2) is crucial. The greater it is, the better. Consider the entry techniques we previously spoke of to see how you can improve here.
What Are The Pros And Cons Of Trading The Inside Bar Pattern?
Here is a summary of the pros and cons of inside bar trading:
Pros
- Clear and simple entry signals
- Works well in trending markets
- Good for breakout trading
Cons
- False breakouts are possible
- Less effective in non-trending markets
- Perfect inside bar patterns don’t appear often
What Is The Success Rate Of The Inside Bar Pattern?
It’s safe to conclude at least a 50% hit rate when trading this (and just about most) pattern. Many traders can reach up to 65%, depending on their skill level.
You can improve your chances of success by:
- Trading inside bars in strong, clear trends
- Finding these patterns on time-frames from the 4H and above.
- Considering a significantly large mother bar in relation to the small inside bar
- Adding as much confluence as possible, e.g., trading inside bars at key support and resistance levels
Aside from these pointers, your stop loss and profit-taking methods also determine your overall win rate. Find balanced strategies with these two factors.
Can The Inside Bar Pattern Have Failure Signals?
Yes, the most common of these is a false breakout. This would happen when the market seemingly breaks out of the mother bar’s high/low but quickly reverses and moves some distance in the opposite direction.
Possible Strategies For The Inside Bar Pattern
Let’s briefly summarise the various strategies you can use when trading the inside bar pattern.
- Breakout strategy: With this strategy, you wait for a clear breakout outside the inside bar’s range before placing your trade.
- Inside bar with trend strategy: Here, traders look for the inside bar in the direction of the trend. A trade happens when the market makes a new high or low (depending on whether it’s an up/downtrend) following the pattern.
- Inside bar at key support/resistance strategy: Look for inside bars at key support or resistance levels. Other price action in the area (engulfing candles, pin bars, etc.) provides more confidence in the trade.
- Inside bar fakeout strategy: We spoke of this strategy briefly before. This is a way to go against the plan of trading the inside bar pattern and capitalise on any fakeouts.
Traders simply wait for the false breakout (i.e., when the price breaks below/above the formation before closing back quickly in its range) before entering the opposite trade. Look out for price action patterns like pin bars or candlesticks with small bodies and long wicks.
(Learn To Trade And Read Candlestick Patterns Like A Pro)
What Are Alternatives To The Inside Bar Pattern?
There are many breakout-based alternatives to inside bars, including the ‘fakey’ and triangle patterns.
- Fakey pattern: This is a two to three-candle variation of the inside bar. It’s said to ‘fake out’ or ‘trap’ traders out as price breaks in one direction before quickly reversing. Essentially, it’s a false breakout pattern that you can take advantage of in reversal situations.
- Morning/evening star: This is a three-candle setup with the following: a bullish/bearish candle, a tinier bullsh/bearish in the middle, and a third bullish/bearish candle that is the same size or larger than the first.
Three-bar patterns are more effective due to the additional confirmation provided by the third candle. Another powerful, rare variation of the morning/evening star exists, characterized by a doji.
- Double inside bar: If one inside bar isn’t sufficient, you can get two. This pattern comprises two consecutive inside bars contained within a large mother bar. Such a formation is a stronger signal than a standard inside bar (although it appears less frequently).
We should also speak about the ‘outside bar,’ which is the opposite of the inside bar. Like the inside bar, this engulfing pattern is used for trading breakouts in mostly trending markets. The outside bar also has the same formation – a mother bar being larger than a smaller one.
The only difference is that the mother bar is on the left side of the small bar (with the inside variation, it’s on the right side). Otherwise, the opposite pattern is also traded identically to its counterpart. To see all alternatives, download our Candlesticks Patterns PDF for free.
What Are The Best Indicators To Combine With The Inside Bar Pattern?
Unsurprisingly, you can combine the inside bar formation with various indicators (which you can use in standard settings) like:
- Moving Averages (MA) – helps identify the overall trend; an inside bar near a key MA (like a 50 or 200 EMA) can signal a strong breakout.
- Relative Strength Index (RSI) – confirms momentum; an overbought or oversold RSI that appears during an inside bar can provide a clue as to how soon the breakout is likely to happen.
- Volume Indicator – low volume during consolidation followed by a volume spike can confirm a breakout direction.
- Bollinger Bands – Inside bars found near the upper or lower band can suggest the trend is continuing or reversing.
- MACD (Moving Average Convergence Divergence) – a MACD crossover that occurs close to an inside bar can confirm the trend’s strength and the breakout’s potential.
Learn Pattern Trading With The WR Trading Mentoring
Part of our incredible mentorship is helping traders spot patterns like the inside bar. Still, we go beyond by providing you with other vital components to ultimately be successful.
These include high risk-reward ratio analysis, trading plans, low time commitment, and knowing exactly when to (and not to) trade. WR Trading education is comprehensive and designed for smarter, profitable trading.
(Learn To Trade And Read Candlestick Patterns Like A Pro)
Conclusion: Inside Bar Trading Success Lies in Strategy and Confluence
The inside bar pattern is a reliable price action tool for traders looking to capitalize on breakouts from trends. It hardly appears in perfect form (patience is key), particularly as one goes higher in time frame. Even so, once it forms, confluence and strategic execution greatly influence your success.
False breakouts remain an unavoidable risk, but traders can increase their win percentage with proper stop-loss placement and strong confirmation factors. Whether you trade it in its traditional breakout capacity or as part of a contrarian fakeout strategy, the inside bar remains a favourite of the modern trader’s arsenal.