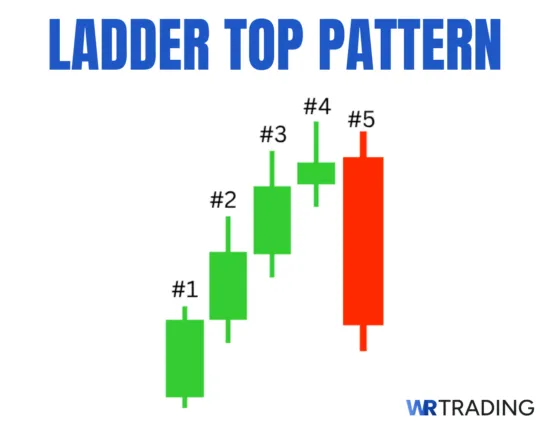
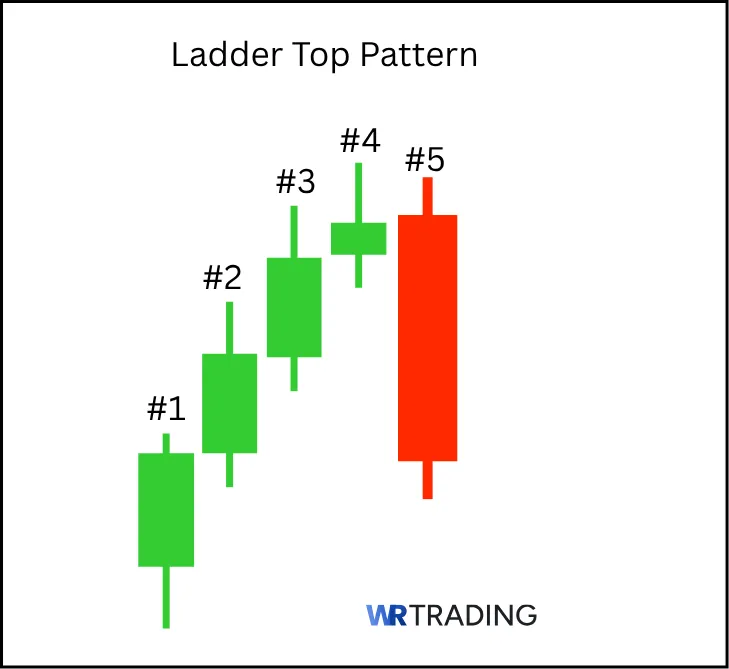
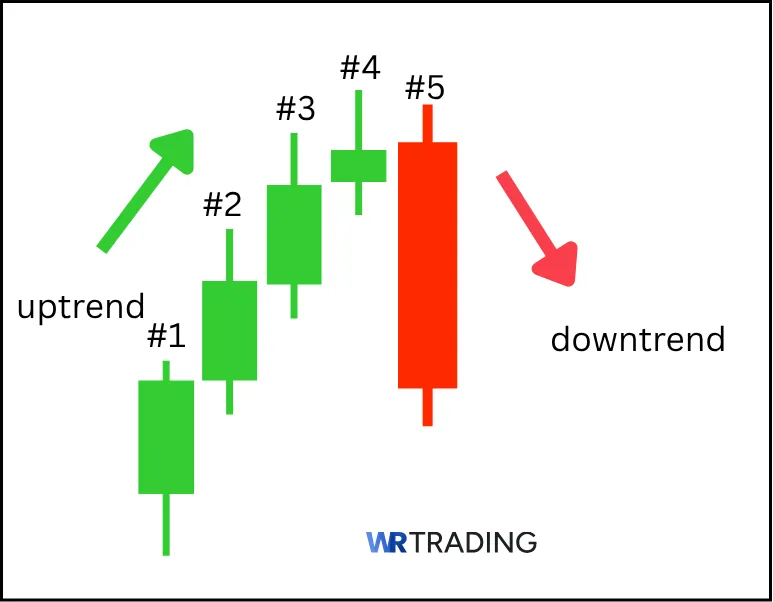
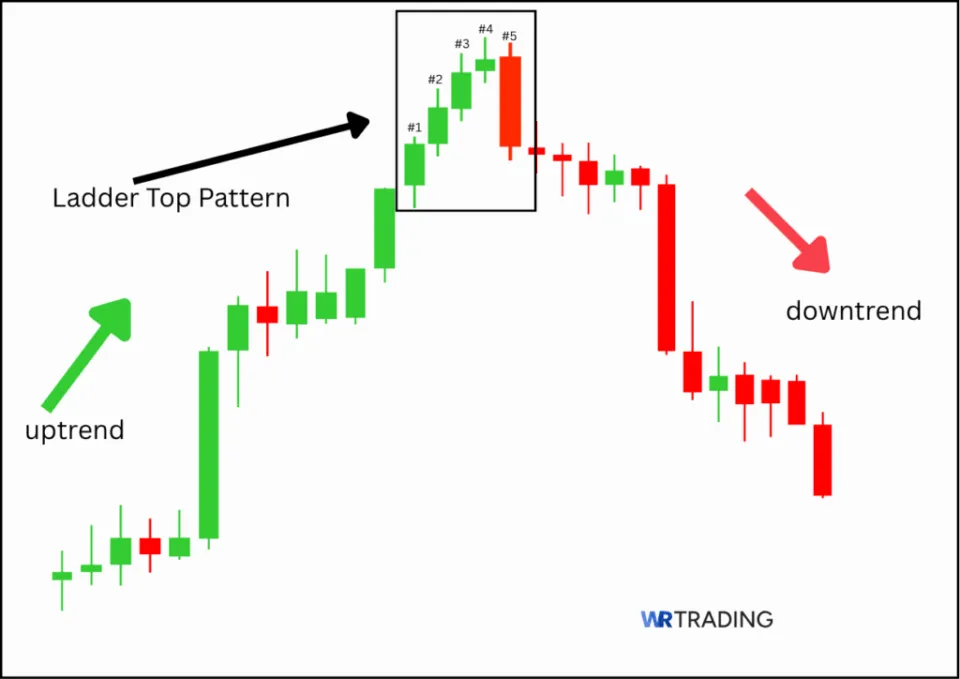
The Ladder Top candlestick pattern is a bearish reversal pattern that signals the end of an uptrend and the beginning of a downtrend. It consists of five candles, with the first four green candlesticks ascending, followed by a bearish red candle that breaks the upward movement. This pattern indicates that buying pressure is exhausted and sellers are taking over the market.
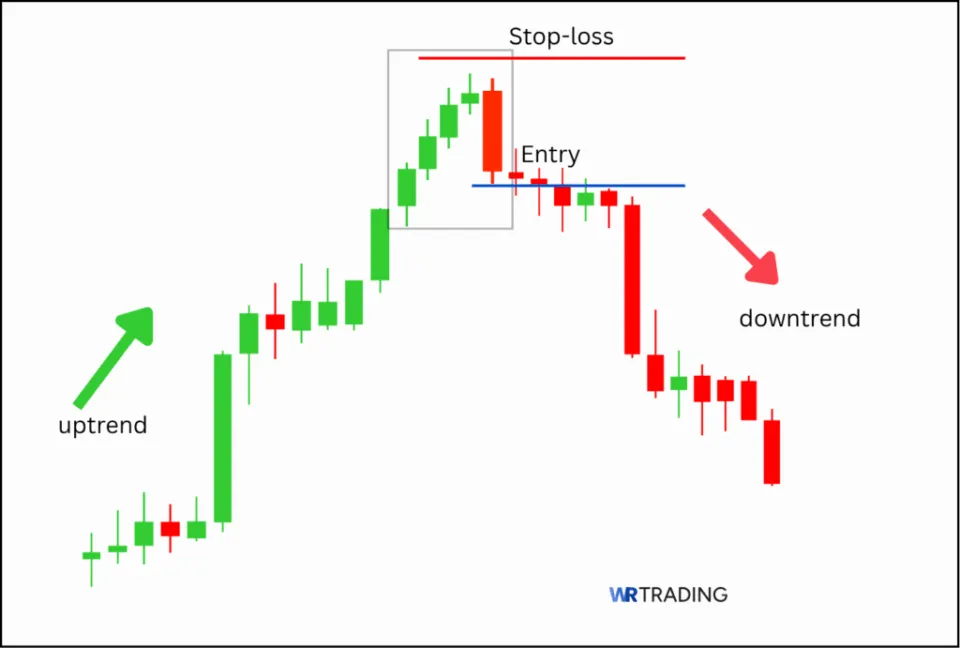
To trade the Ladder Top pattern, traders enter a short position after the fifth candle closes bearish, confirming the reversal. A stop-loss is placed above the high of the last green candle, while take-profit levels are set using the next key support zone or risk-reward ratios. By understanding the structure, formation, and meaning behind this pattern, traders can identify high-probability setups and avoid common forex and crypto trading mistakes.
Key Facts of The Ladder Top Candlestick Pattern:
- First Candle: Strong green bullish candle
- Second and Third Candle: Bullish candlesticks that maintain the ladder structure.
- Fourth Candle: A small bullish candle that indicates slow momentum.
- Fifth Candle: A strong bearish red candle that opens above the previous candle and signals sellers’ dominance.
- Type of Pattern: Bearish reversal
- Trend Prior to Pattern: Uptrend
- Opposite Pattern: Ladder Bottom candlestick pattern
- Entry Options: Entry is best when the pattern forms at the resistance zone. Open a sell trade on closing the bearish candlestick.
- Stop-loss Placement: Position 10-20 pips above the high of the fifth candle or the highest point of the entire five-candle pattern.
- Interpretation: This pattern means that there is a shift from bullish momentum to bearish control. The fifth bearish candle shows that sellers have taken over, and there is a movement from uptrend to downtrend.
(Learn To Trade And Read Candlestick Patterns Like A Pro)
How Is The Ladder Top Pattern Formed?
The Ladder Top pattern forms during an active uptrend, usually after several strong bullish sessions. It forms when buying momentum reaches an unsustainable peak. The pattern does not appear in sideways or downtrend markets because it requires a bullish movement to create a ladder-like pattern.
Here is how the formation happens on the chart:
- Before the Pattern: You will notice a clean upward price movement that shows higher highs and lows. This movement will signify a bullish momentum that creates a foundation for the pattern’s formation.
- During the Pattern: The first four green candlesticks appear consecutively. With each candle closing slightly higher than the last. These candles start strong, but they later show signs of smaller wicks. Then, the last red candle indicates a bearish movement. It opens within the fourth candle but closes significantly lower. The fifth candle is a sign that sellers are taking over the market.
The Ladder Top candlestick pattern can form on any timeframe. It can happen on a 1-hour intraday, daily, or weekly timeframe. However, it is more reliable on higher time frames like a 4-hour chart due to reduced market noise. The entire formation typically takes 5 trading sessions.
What Does The Ladder Top Candlestick Pattern Mean?
Psychologically, the Ladder Top candlestick pattern shows the transition from confident buyers to assertive sellers. The pattern is not just about colours or candles, it is about what traders are thinking behind the scenes.
The first four candles show buyers’ confidence and control. Buyers display what psychologists call euphoric buying. That is, they are confident that prices will keep rising, so they enter the market because they do not want to be left out. By the fourth candle, they start to show weakness. Buyers are present, but they begin to hesitate. During this period, some buyers start to lock in profit.
The fifth candle is the turning point. It opens higher, but sellers quickly take control and drive down the prices. This candle shows that sellers have entered the market aggressively, and buyers are shaken and likely to exit the market.
The pressure to sell comes from multiple sources, such as profit-taking by early buyers and stop-loss orders. Eventually, the quick transition from buyer dominance to seller control creates the sudden price decline.
In summary, the ascending candles represent greed and overconfidence, while the fifth candle represents sudden fear and panic. This psychological dynamic makes the Ladder Top reliable because it captures the moment when market sentiment shifts from extreme bullishness to bearish reality.
Where Does The Name of The Pattern Ladder Top Come From?
The name “Ladder Top” comes from the structure of the first four candlesticks. The four bullish candles stack up like the steps of a ladder. Each candle closes higher than the previous one, creating horizontal steps that mimic a ladder. The final candle marks the top and sudden drop, indicating the end of the climb and a potential reversal downward.
(Learn To Trade And Read Candlestick Patterns Like A Pro)
What Is An Example Of The Ladder Top Pattern?

A clear example of the ladder top candlestick pattern appeared on the EUR/USD 4H chart in late March 2024.
- First Candle (Bullish): EUR/USD initially opened at 1.0980 and closed at 1.1000, showing a bullish momentum with minimal lower shadow.
- Second Candle (Bullish): The second candle continued the climb, opening at 1.1000 and closing at 1.1020. It maintained the upward trend with strong buying pressure.
- Third Candle (Bullish): The next candle opens at 1.1022 and closes at 1.1050. This continued the creation of the ladder-like structure.
- Fourth Candle (Bullish): The fourth candle completed the ascending pattern by opening at 1.1050 and closing at 1.1060. This candle indicated that the pattern has reached its peak.
- Fifth Candle (Bearish): Candle 5 delivered the bearish reversal signal by opening at 1.1060, which is within the range of the previous candle. However, it closed lower at 1.1015. This means that a 45-pip decline occurred that erased most of the fourth candle’s gains.
This example demonstrates the transition from sustained buying pressure to sudden selling pressure. Our trading methods track these types of setups in real time and acknowledge them as a powerful tool for identifying trend reversals in major currency pairs.
How To Identify The Ladder Top Pattern?
Spotting the Ladder Top pattern on a chart is not just about analyzing five candles. You must know where the pattern forms and how the candles behave. It is about understanding what came before them and what their structure is saying.
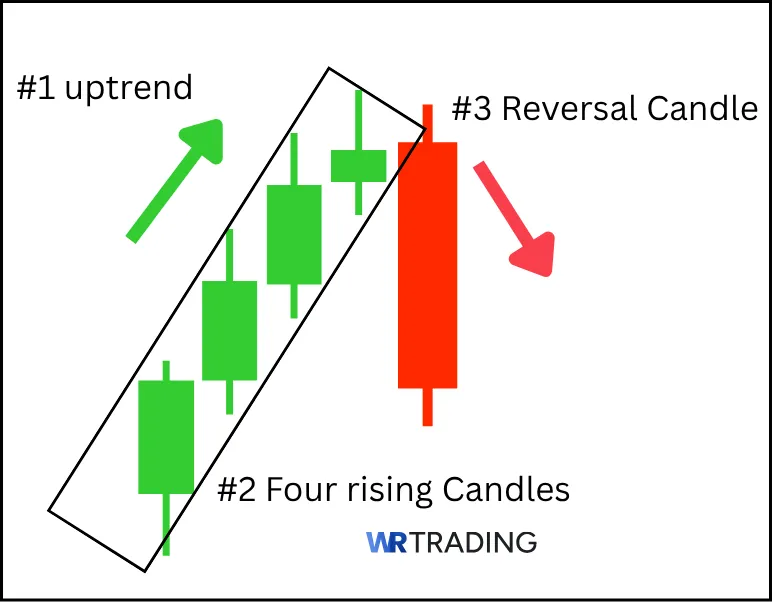
Step 1: Look For a Clear Uptrend
Before looking for the pattern, ensure that you are analysing the charts during clear uptrends. The Ladder Top forms only after an upward trend. So, ensure that the charts are displaying rising prices. Preceding trends have to show consistent higher highs and higher lows. This uptrend tells you that buyers are in control, setting the stage for a likely reversal.
Step 2: Spot The Four Rising Candles
The next step is to look for four consecutive bullish candles. With each candle closing slightly higher than the other, creating the staircase effect. The candles should be relatively uniform in size, indicating consistent buying pressure. You should also notice the shrinkage happening with the 4th candle, meaning the buying momentum is slowing down.
Step 3: Find the Final Reversal Candle
The fifth candle is the key signal. So, when you notice that it opens higher than the fourth candle but quickly reverses and becomes red, that is the reversal candle. That is the moment when sellers take control.
We identify this pattern primarily on the 4H, daily, and weekly charts. Lower time frames are likely to produce false results. The Ladder Top pattern is easy to catch with the help of visual chart scanning tools like candlestick pattern scanners or alerts.
(Learn To Trade And Read Candlestick Patterns Like A Pro)
How To Trade The Ladder Top Pattern?
To trade the ladder top pattern, we use an approach that involves recognising the pattern, confirming the trade, and managing the trade properly. Our process is built around five key phases: setup location, pattern appearance, entry, stop-loss, and profit-taking.
Below is a step-by-step guide on how to trade the ladder top pattern:
- Find the right setup for the ladder top
- Wait for the appearance of the ladder top candlestick pattern
- Open your trade – entry point
- Wait for a confirmation or not
- Choose your trading take profit
1. Find the Right Setup For The Ladder Top
The pattern only appears after an uptrend, so start by scanning your charts for a Clear and steady uptrend. That is, when prices have climbed significantly. Look for resistance levels where upward momentum is likely to exhaust itself. The right setup occurs when the pattern develops near previous highs or round numbers like 1.1000 in EUR/USD. You can also find it at Bollinger Bands or Fibonacci retracement levels.
The pattern must appear during an established uptrend. You should never trade Ladder Tops that form during sideways or downtrends. They lack the necessary bullish momentum for a meaningful reversal.
2. Wait For The Appearance Of The Ladder Top Candlestick Pattern
Once there is a clear uptrend, wait for the five-candle structure before taking any action. The pattern must be clear:

- Four ascending green bullish candles
- A ladder-like pattern
- A final red bearish candle that closes below the fourth candle
Fight the urge to enter the market early. Even if the pattern looks obvious after three or four candles, wait for the appearance of the fifth candle. Premature entries lead to losses.
3. Open Your Trade – Entry Point
As soon as the pattern is complete, you can now enter your trade. Enter your trade right after the fifth candle closes. Place your stop loss order 15-25 pips above the highest point of the fifth candle.
We recommend that you set your position size to risk no more than 1-2% of your account balance. You can use our calculator to manage the exact amount of risk. For a $10,000 account risking 2% ($200) with a 50-pip stop loss, your position size would be approximately 0.04 lots in EUR/USD.
4. Wait For A Confirmation Or Not
You can choose to trade immediately after pattern completion or wait for additional confirmation signals. Immediate entry offers a better risk-reward ratio, but it carries a higher risk of false signals. Entry based on confirmation signals offers less risk but lower profit.
Confirmation signals include:
- Volume spike of the fifth candle
- RSI showing bearish divergence
- Break below the fifth candle
- Price closing below a key support level within 1-3 candles after pattern completion.
We only trade the pattern when at least one of these confirmations is present. This is what separates a visual signal from a professional setup.
5. Choose Your Trading Take Profit
Your goal is to profit from the reversal, and it should never be guessed. We calculate them using:
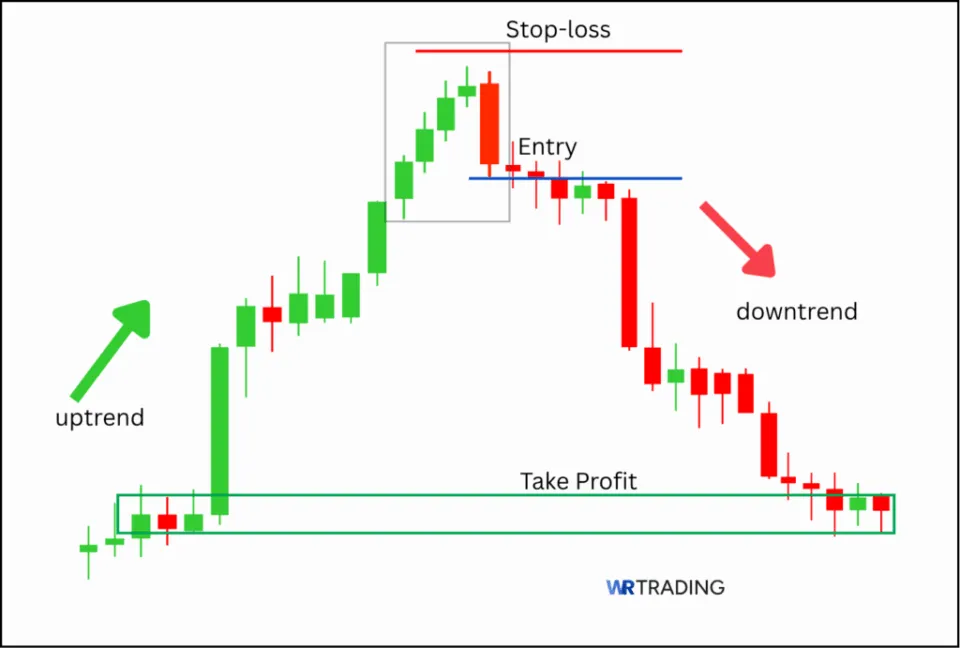
- TP1 (Conservative): Nearest support zone
- TP2 (Aggressive): 2x or 3x your risk (Risk:Reward ratio of 1:2 or 1:3)
- TP3 (Advanced): Based on Fibonacci retracement (38.2% or 61.8% of the previous uptrend)
We teach our traders the power of consistency. The price doesn’t have to fly, it just has to hit target levels consistently, that’s how we compound over time. This strategy is designed to be all-encompassing. Every part of the setup (context, pattern, confirmation, entry, stop, and exit) is structured, turning a common candlestick pattern into a professional trade plan.
(Learn To Trade And Read Candlestick Patterns Like A Pro)
Which Strategies Can Be Used For The Ladder Top Candlestick Pattern?
The Ladder Top pattern is a bearish reversal signal, and to ensure its accuracy and reduce false signals, we combine it with other strategies or tools. Here are the most common strategies and how to use them:
1. Volume-Based Strategy
This strategy focuses on analyzing the trading volume behind candles to confirm the momentum and validity of the ladder. To use this strategy, we monitor volume during pattern formation before executing a trade.
The first four candles should show consistently increasing volumes. The fifth candle should display a volume spike that confirms genuine selling pressure.
2. Breakout Strategy
This strategy involves trading a move outside of a defined support/resistance area. We wait for the bearish candle to break below recent support or a trendline. Then enter a short trade when prices close.
3. Support and Resistance Strategy
This approach focuses on identifying Ladder Top patterns that form at critical support and resistance zones. To use it, look for the Ladder Top that forms near strong resistance or a previous swing high. We enter trades when the fifth candle confirms the reversal at these key levels, using the resistance zone as a stop loss guide.
4. Indicator-Based Strategy
This involves using indicators like RSI, MACD, or Stochastic to identify overbought conditions that match ladder top formations. Here is how to use the indicators:
- RSI: Where RSI is above 70 (overbought) as the Ladder Top forms, it’s a strong bearish sign.
- MACD: Look for a bearish crossover as the pattern completes.
- Stochastic: Find overbought readings and bearish crossovers to confirm weakening buying pressure.
5. News-Based Strategy
Another strategy is monitoring key economic events that might influence trend reversals. Patterns forming before major economic announcements often produce stronger reversals due to uncertainty and profit-taking behavior. The pattern might signal that smart money is exiting early before volatility hits.
This strategy works well when trading stocks or where interest rate decisions or employment data can trigger significant reversals.
(Learn To Trade And Read Candlestick Patterns Like A Pro)
What Is The Success Rate Of The Ladder Top Candlestick Pattern?
The general success rate of the Ladder Top candlestick pattern is approximately 38.2% when used in isolation. But combined with other confirmation tools, success rates can move up to 60–70%.
According to Thomas Bulkowski’s technical analysis of over 4.7 million chart candlestick patterns, the hit rate of the Ladder Top Pattern is 52%-68%. However, when proper confirmation signals are used and the pattern appears in good market conditions, success rates can reach the upper end of this range.
We found that certain factors influence this win rate, and they include:
- Confirmation tools like RSI and MACD
- Key support/resistance levels
- A break below the low of the fifth candle
- An uptick in volume during the formation of the last two candles
- Time frame selection
While creating a trading plan, we improve this pattern’s success by using confirmation tools. With discipline, the Ladder Top pattern is a high-confidence entry with a measurable edge.
Is The Ladder Top Candlestick Pattern Suitable For Beginners?
Yes. However, it has to be used with caution. The pattern can work for beginners because it has a clear visual structure. That is, four bullish candles followed by a strong bearish one. As long as beginners understand the pattern, they are good to go.
It is easy to recognise and it helps new traders learn how to spot a weakening trend. However, it requires beginners to understand how to identify the trend or key resistance levels, to avoid falling for false signals. The Ladder Top pattern is not 100% reliable. Without proper confirmation, beginners might enter too early or misread the signal.
Our take on the pattern for beginners is that those who are willing to take time to combine the Ladder Top with other indicators will have better outcomes. It is a training ground for developing the right habits, like waiting for confirmation and respecting market structure.
What Are The Pros And Cons Of The Ladder Top Pattern?
The Ladder Top is a pattern with clear structure and solid reversal logic, but like every tool in trading, it comes with both advantages and disadvantages. Here are the key pros and cons at a glance:
Pros
- Easy to recognize visually
- Good for spotting potential trend reversals
- Helps teach price action and candlestick psychology
- Can be enhanced with confirmation tools
- Useful near key resistance zones
- Works across multiple timeframes
Cons
- Demands patience because it requires 5 candles to complete
- Less effective without confirmation
- Can produce false signals in weak trends
- Not ideal for sideways markets
- Success rate is average when used alone
What Are The Advantages Of The Ladder Top Pattern?
These advantages make the pattern a favorite among profitable traders:
- Easy to Recognize Visually: The pattern has a clear and specific shape. That is, 4 rising bullish candles followed by 1 strong bearish candle. This makes it perfect for traders who are just starting to learn price action and want patterns that are not overly complex.
- Good For Spotting Reversals: Since it forms after an uptrend, the Ladder Top is a clear bearish reversal signal. It helps traders prepare for potential drops in price before they happen. Good for exiting and opening at the accurate time.
- Works Well with Confirmation Tools: The pattern is often more powerful when combined with technical tools like RSI (Overbought levels), MACD, and volume spikes. This adds layers of confirmation and increases the success rate significantly.
What Are The Disadvantages Of The Ladder Top Pattern?
The disadvantages of the pattern are explained below:
- Demands Patience Because It Requires 5 Candles to Form: Unlike simpler patterns like Doji or Engulfing, the Ladder Top needs 5 specific candles. This can make it slower to form and sometimes harder to use in fast-moving markets.
- Less Effective Without Confirmation: Relying solely on the pattern without checking volume, trend strength, or support/resistance levels can lead to false breakouts or losses. The pattern by itself is not a guarantee, it needs backup approval.
- Can Mislead in Sideways or Weak Trends: In downtrend markets, the Ladder Top may appear but fail to produce any strong move. So, if the overall market context is not considered, it can trigger bad entries.
Can The Ladder Top Have Failure Signals?
Yes, the Ladder Top candlestick pattern can fail. It fails more than traders expect, especially when misused or traded in the wrong context. Failure rate ranges from 32-60%, depending on market conditions and confirmation criteria used.
Here is why the Ladder Top Pattern can fail:
- Lack of volume confirmation
- Weak resistance zone
- Overwhelming bullish momentum
- No confirmation candle
- Wrong time frame use
- Unexpected positive news
- Market manipulation
- Premature pattern identification
We treat this pattern as a signal, not a trigger. It earns execution status only when the market proves the reversal is real, not before.
Which Indicators Can Be Combined With The Ladder Top to increase its success?
The combination of the Ladder Top with indicators increases the reliability of the pattern. It helps confirm bearish sentiment or trend reversals. Here are the best indicators that work well with the pattern:
| Indicators | Setting | Description |
|---|---|---|
| Relative Strength Index (RSI) | 14 period | We use RSI to measure momentum. When the RSI is above 70 during the Ladder Top formation, it suggests overbought conditions, meaning the uptrend may be running out of steam. |
| Moving Average Convergence Divergence (MACD) | MACD Line (12), Signal Line (26), Smoothing (9) | MACD tracks trend momentum and potential reversals. We monitor moving average crossovers and histogram signals with this indicator. |
| Volume Indicator | Default (simple volume bars) | Volume tells us how much interest is behind price movements. For us, it is a great tool for confirming whether the Ladder Top pattern has real market conviction. |
| Stochastic Oscillator | %K = 14, %D = 3 | The stochastic oscillator helps us identify overbought and oversold levels by comparing a particular closing price to a range of prices over time. |
| Bollinger Bands | 20-period, 2 standard deviations | Bollinger Bands show price volatility and range extremes. The Ladder Top forming outside or at the upper band signals a potential price exhaustion. |
| Average True Range (ATR) | 14-period | ATR helps optimize stop loss placement and position sizing for Ladder Top trades by measuring recent volatility levels. |
We don’t use all these indicators at once. Our rule is simple: two solid confirmations max. The goal is to use the pattern as a structural clue, then validate it with one or two tools that fit the market context.
(Learn To Trade And Read Candlestick Patterns Like A Pro)
What Are Similar Patterns To The Ladder Top Pattern?
The Ladder Top pattern shares structural similarities with other bearish reversal patterns. While each has a unique candle formation, they all reflect a shift in market sentiment from bullish to bearish. Here are similar patterns to the Ladder Top:
| Pattern Type | Type | Description |
|---|---|---|
| Evening Star | 3-candle bearish reversal | A large bullish candle, a small indecision candle, then a strong bearish candle. |
| Shooting Star | A single-candle pattern | One candle with a small body and long upper wick, showing rejection of higher prices and potential reversal. |
| Bearish Engulfing | Multiple candles | A strong bearish candle fully engulfs the previous bullish candle, showing a momentum shift from buyers to sellers. |
| Three Black Crows | 3 bearish candles | Three consecutive long candles after an uptrend, indicating strong selling pressure |
Find more similar patterns in our WR Trading Candlestick Patterns PDF. It’s downloadable for free.
What Is The Opposite Pattern Of The Ladder Top?
The opposite pattern of the Ladder Top is the Ladder Bottom candlestick pattern. While the Ladder Top signals a bearish reversal after an uptrend, the Ladder Bottom appears after a downtrend and signals a bullish reversal. It forms with 4 consecutive bearish candles followed by a strong bullish candle that indicates buyers are stepping in to reverse the momentum.
What Is The Difference Between The Ladder Top And The Ladder Bottom Pattern?
While both patterns may share slightly similar characteristics, there are still differences between the Ladder Top and the Ladder Bottom Pattern. These differences include:
| Feature | Ladder Top | Ladder Bottom |
|---|---|---|
| Trend direction | Happens after an uptrend | Happens after a downtrend |
| Type of signal | Bearish reversal | Bullish reversal |
| Structure | 4 bullish candles and 1 strong bearish candle | 4 bearish candles and 1 strong bullish candle |
| Psychology | Buyer exhaustion, seller takeover | Seller exhaustion, buyer takeover |
| Stop-loss Placement | Above the pattern’s highest point | Below the pattern’s lowest point |
| Volume Confirmation | High volume on the bearish fifth candle | High volume on the bullish fifth candle |
What Is The Difference Between The Ladder Top And the Bullish Three Line Strike Pattern?
The Ladder Top and the Bullish Three Line Strike are two distinct candlestick patterns. Both patterns serve different purposes and have opposite signals. The Ladder Top is a bearish reversal pattern that appears at the top of an uptrend, while the Bullish three line strike is a bullish continuation pattern.
The Ladder Top pattern has a sequence of bullish candles followed by a sharp bearish one, signaling that sellers are gaining control. On the other hand, the Bullish Three Line Strike consists of three bullish candles followed by a large bearish candle, but does not signal a reversal, instead, it confirms the strength of the bulls.
What Are The Limitations Of The Ladder Top Pattern?
Here are the limitations of the Ladder Top candlestick pattern:
- It is only valid after an uptrend; spotting it in a sideways market can lead to false signals.
- The pattern cannot be used as a stand alone, it requires confirmation from indicators.
- It can sometimes produce false signals.
- Waiting for confirmation may result in late market entry.
- It does not offer a built-in target; traders have to determine TP levels manually.
Learn Pattern Trading With The WR Trading Mentoring
At WR Trading, we go beyond learning about the types of patterns. Our mentoring program trains traders to execute setups like the Ladder Top pattern. We help you connect the patterns with real-time market conditions, proven trading strategies, and risk management techniques.
Our mentorship includes: Weekly live trade reviews and forecasting, strategy sessions, access to our WR pattern playbook and templates, and one-on-one feedback on trades and strategy development. If you want to trade with precision and avoid guesswork, our mentoring will give you an edge.
(Learn To Trade And Read Candlestick Patterns Like A Pro)
Conclusion: Learn to Trade Using The Ladder Top Candlestick Pattern
The Ladder Top candlestick pattern is a classic bearish reversal signal that helps traders spot potential market tops, especially after a strong uptrend. While the pattern has its limitations, it can still be a reliable pattern when combined with other indicators like RSI, moving averages, and key resistance levels.
Traders typically trade the Ladder Top pattern by going short after the fifth candle closes bearish, speculating that the market will continue its downward move. To manage its risk, traders set a stop-loss above the high of the last green candle and determine their take profit. From our experience, this pattern is best used as part of a broader price action strategy, focusing on higher time frames and confirming with indicators or volume.