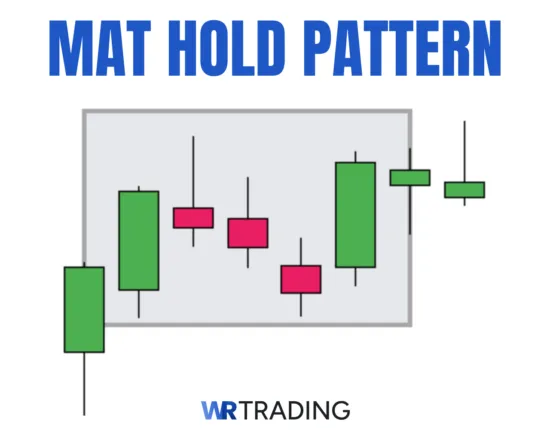
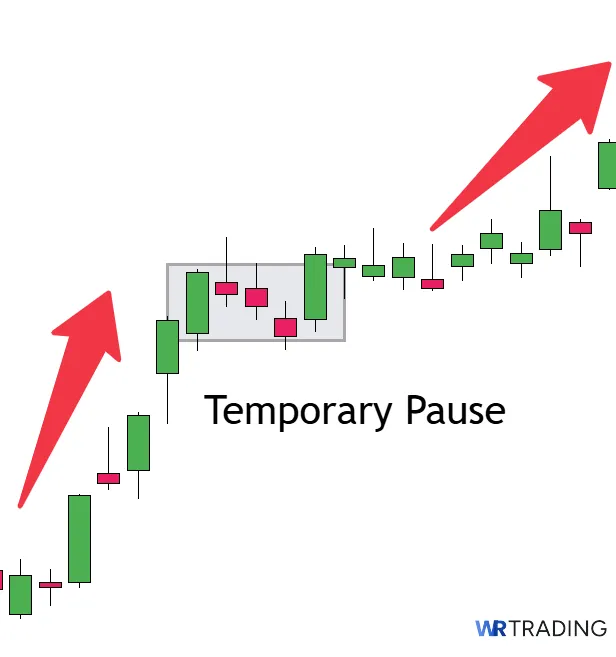
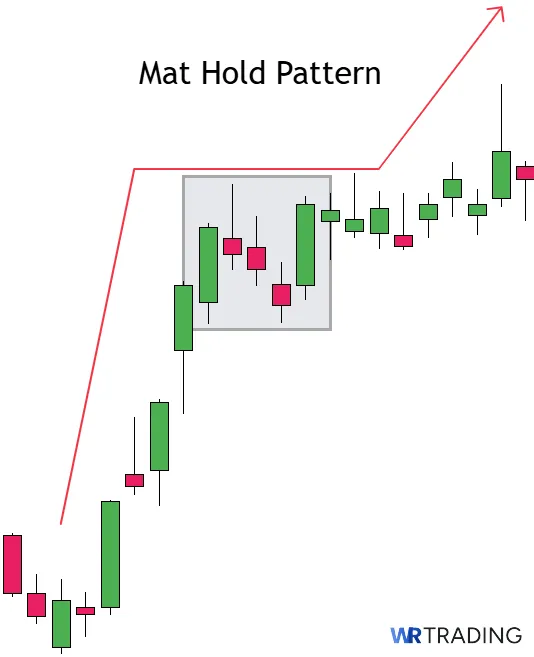
The Mat Hold is a five-candle continuation pattern that shows a trend taking a short pause before resuming.
It starts with a strong green impulse candle in the direction of the existing trend, followed by three smaller red candles that form a tight consolidation. The final candle breaks out in the same direction as the first with another green close, confirming that momentum remains intact and the trend continues.
The pattern appears within established uptrends or downtrends, signaling that the market is briefly resting before the next leg. It reflects trader psychology, where the dominant side remains in control, even when the price temporarily stalls. The middle candles create an image of weakness, but the final breakout confirms strength.
Traders use it to enter ongoing trends with clearer structure, combining it with volume spikes, moving averages, or Fibonacci retracements to validate the setup.
How Is The Mat Hold Candle Structured:
- Type of Pattern: Five-candle trend continuation pattern
- First Candle: A strong candle in the direction of the trend, signaling clear momentum
- Second Candle: Small-bodied candle that stays within the first candle’s range
- Third Candle: Another small candle that continues the consolidation
- Fourth Candle: Final pause candle, still contained inside the initial range
- Fifth Candle: Breakout candle that closes firmly beyond the range, confirming continuation
- Forecast: Suggests a trend pause followed by continuation. It confirms that the dominant side still has control
- Trend Prior to Pattern: Appears during strong uptrends or downtrends. It won’t form in sideways markets or weak trends
- Opposite Pattern: Mat Hold bearish and bullish variations
- Candlestick Success Rate: Historical testing shows a success rate between 67% and 78%, depending on trend strength and market conditions
Our comprehensive guide will cover everything you need to know about the Mad Hold candlestick pattern.
(Learn To Trade And Read Candlestick Patterns Like A Pro)
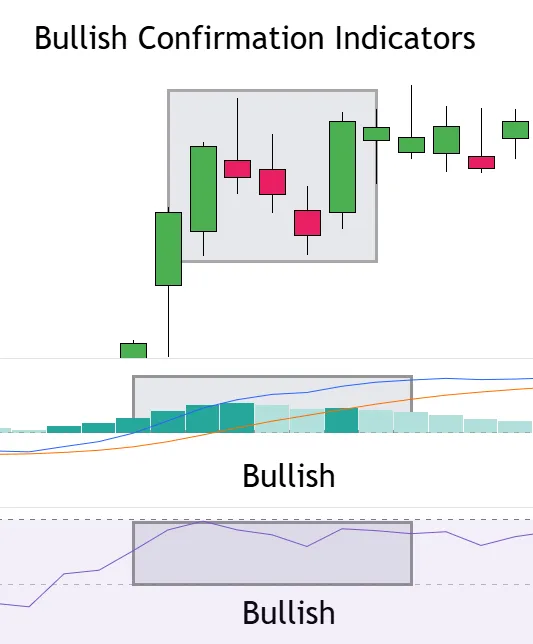
What Is A Bullish Mat Hold?
A Bullish Mat Hold pattern appears during an uptrend and confirms that buyers are still in control. The first candle is a strong green bullish candle that signals momentum. After that, three smaller red candles form a temporary pause or pullback, but the structure holds above the low of the first candle.
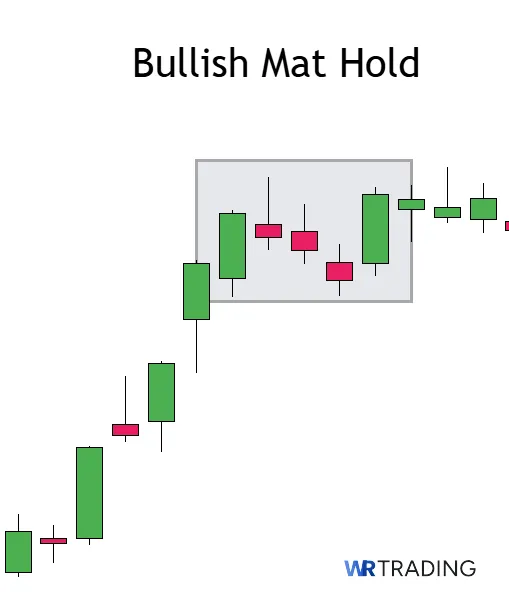
These consolidation candles might even show slight downward movement, but they stay within the overall structure. The green fifth candle breaks out strongly in the same direction as the first, closing above the consolidation and signaling that the trend is ready to continue upward.
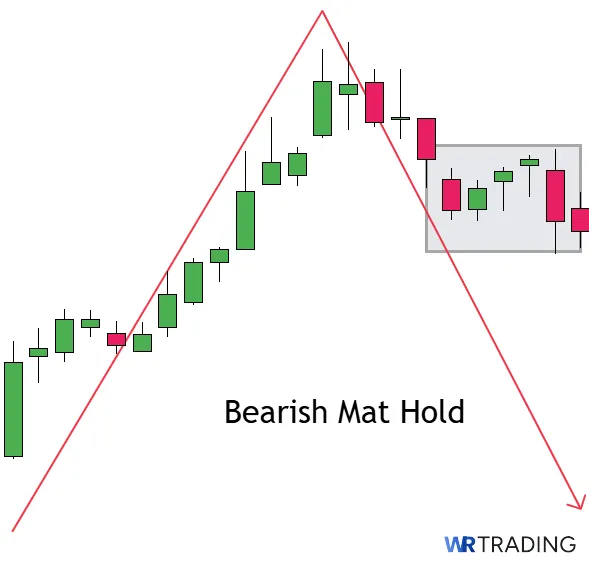
What Is A Bearish Mat Hold?
The Bearish Mat Hold is the opposite. It forms during a downtrend, starting with a large red candle. This is followed by a few small green candles that may show minor upward retracement or sideways movement, but the price holds below the high of the first candle.
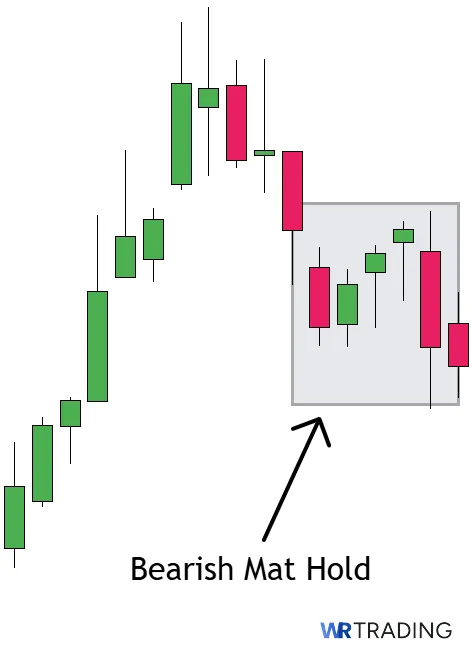
The final red candle resumes the downward move with a strong close lower, breaking the range and confirming bearish continuation. It shows that sellers were only pausing, not giving up control.
How Does a Mat Hold Candlestick Pattern Form?
The pattern forms when a strong trending move is interrupted by a brief period of consolidation. After an impulsive move up or down, the market pauses, but instead of reversing, it holds the structure and continues in the original direction.
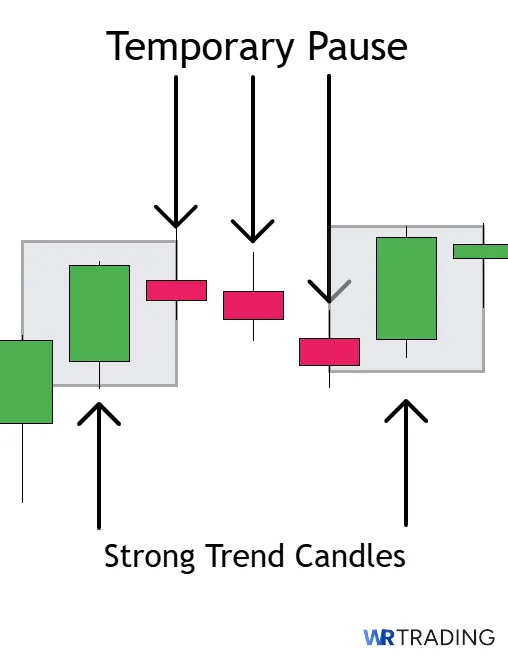
It consists of five candles in total. The first candle must be strong and aligned with the prior trend. The next three candles are smaller and less aggressive, showing the temporary pause. These often overlap and stay within the high and low of the first candle. The final candle breaks out decisively, confirming the continuation.
(Learn To Trade And Read Candlestick Patterns Like A Pro)
What Does a Mat Hold Candlestick Pattern Indicate?
The Mat Hold tells you the trend is not over. It reflects a brief period of hesitation or consolidation, followed by renewed momentum. The small candles in the middle create an image of weakness, but they fail to produce a real reversal. When the breakout candle appears, it confirms that market participants are using the pause to reload positions.
Psychologically, the pattern represents strength. The early impulsive candle sets the tone. The following small candles show that opposing traders (sellers in a bullish setup or buyers in a bearish one) aren’t strong enough to change the trend. When the last candle confirms direction, it often traps countertrend traders and triggers continued movement in the trend’s favor.
Example of the Mat Hold Pattern in the Chart
During late April, EUR/USD was trending lower, but the price paused for several sessions around the 1.3170 area. The pattern began with a strong red candle, followed by three smaller-bodied candles that moved slightly upward yet stayed within the range of the first. On May 1st, a large bearish candle broke below the consolidation and closed around 1.3050, confirming the bearish Mat Hold formation.

This setup clearly showed sellers were still in control, despite the minor pullback. The final breakout candle confirmed that the move lower wasn’t over, and the market followed through with a strong drop in the days after.
How to Identify a Mat Hold Candle in the Chart?
To identify the Mat Hold, start by scanning charts for trending markets. You’re looking for strong momentum leading into the upward or downward pattern. The setup won’t form in sideways price action.
Look for a wide-bodied impulsive candle in the direction of the trend. This is the anchor. Then look for three smaller candles that stay within the range of the first candle. They might move slightly against the trend, but they must not break the structure.
The final candle needs to be decisive and must close beyond the pause, confirming the trend continuation. Focus on clean charts with minimal noise. This pattern works best on 1-hour, 4-hour, or daily timeframes, where price structure is more reliable and less influenced by minor fluctuations.
How to Trade the Mat Hold Candlestick Pattern
Now we’ll walk you through how to trade the Mat Hold step by step. The goal is to avoid rushing in and instead wait for confirmation that the pattern is valid. Use tools like support and resistance levels, moving averages, and volume indicators to confirm that the pause isn’t a reversal:
- Find the Pattern
- Wait for Appearance
- Open the Trade
- Choose Take Profit
(Learn To Trade And Read Candlestick Patterns Like A Pro)
1. Find the Right Mat Hold Candlestick Pattern Setup
Start by scanning for trending markets, which the Mat Hold performs best in. The Mat Hold doesn’t work in sideways or slow conditions. You’re looking for clear momentum, either bullish or bearish, where the price has already been moving in one direction with conviction. Without a trend, this pattern has no meaning.
Look for a strong impulse candle that stands out visually, either a wide-bodied green candle in a bullish trend or a red candle in a bearish one. This candle sets the tone for the entire setup. After that, three smaller candles should form a pause or minor pullback. The structure should be tight, meaning the middle candles don’t drift too far from the initial move.
This pattern can form in several different conditions. Here are some places to watch for it:
- Bullish Mat Hold at Resistance Breakout – After a resistance level is broken, the pattern may form as a continuation before another leg up.
- Bearish Mat Hold at Breakdown Zones – When price breaks a key support level and consolidates before dropping further.
- Mid-Trend Pullback – Inside a trending move, the Mat Hold can form during a pause before the trend resumes.
2. Wait for the Appearance of the Mat Hold Candle
It’s tempting to jump into the trade early when you recognize the Mat Hold forming. However, if you enter before the fifth candle confirms the move, you’re taking on unnecessary risk. The pattern isn’t valid until all five candles are complete, and the last one confirms direction.
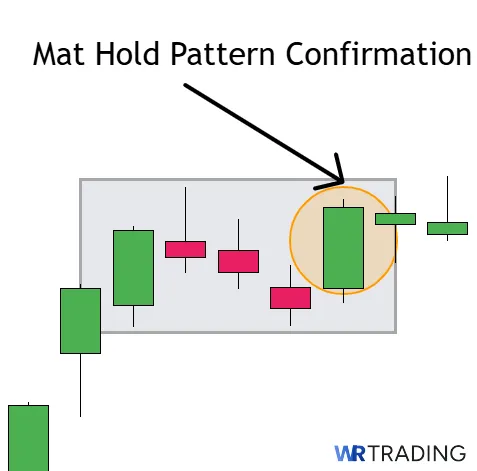
Once the pause phase has played out with three small candles, wait for the fifth candle to open and trade in the direction of the first. This final candle should be strong and close outside the consolidation range. If it doesn’t break out or closes weak, skip the trade. The fifth candle is what separates a valid Mat Hold from a failed setup.
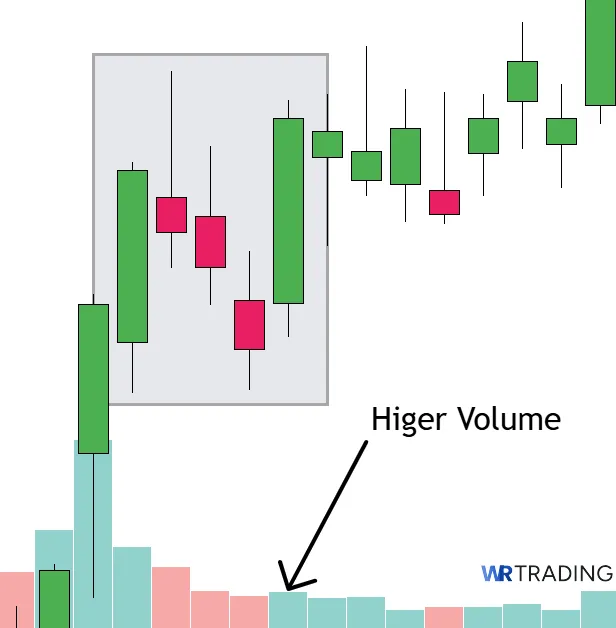
During this phase, monitor volume. If you see rising volume on the breakout candle, it’s a sign that the market agrees with the continuation. Low volume or indecision means the breakout may not hold.
3. Open Your Trade – Entry Point
The entry for the Mat Hold is based on the breakout of the fifth candle. In a bullish pattern, wait for the candle to close above the consolidation range. In a bearish pattern, you want a strong close below the pause. You can enter at the close of this candle or on a break above its high (for bullish setups) or below its low (for bearish ones).
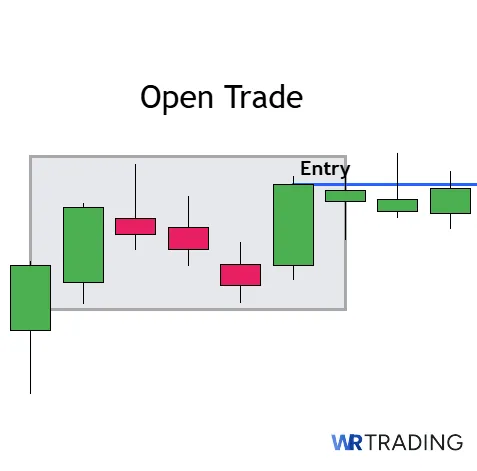
One approach is to use a market order at the close of the breakout candle if it’s showing strong momentum and volume. This gets you in right away, riding the continuation. Another method is to set a limit order slightly above the high of the fifth candle (or below it, for bearish setups). This gives you confirmation while still avoiding entries during indecision.
For stop-loss placement,we recommend setting your stop just outside the consolidation range. In a bullish Mat Hold, this means placing it below the low of the tight three-candle pause. In a bearish version, position it just above the highest point of the pause.
Whatever method you choose, avoid entering inside the range. You’re only buying or selling once the structure has proven itself. If the candle breaks out but fails to close strongly, step aside. Half-setups aren’t worth trading.
4. Choose Your Trading Take Profit
Where you take profits using the Mat Hold depends on your trading style and the structure of the chart. The most straightforward method is to look left on the chart and find the nearest swing high or swing low. This is your first natural resistance or support level, and it’s often where the first reaction occurs after a breakout.
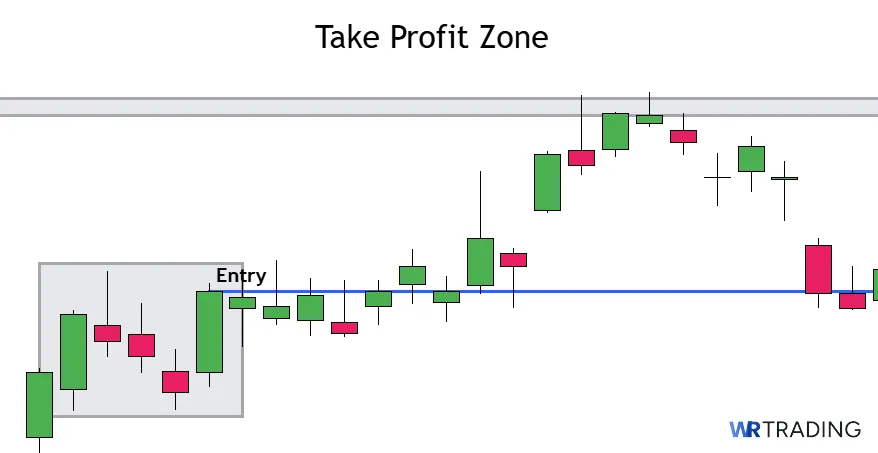
Another option is to use a measured move approach. Measure the height of the initial impulse candle and project that same distance from the breakout candle. This gives you a realistic target based on the structure of the pattern. For example, if the first candle moved 80 pips in forex or $3.00 in a stock, you can set your target the same distance from the breakout level.
However, if you’re trading with the trend and want to hold a portion of the position, consider scaling out. Take half off at the first target, then let the rest run using a trailing stop. That way, you lock in gains while keeping upside open if the trend continues further.
(Learn To Trade And Read Candlestick Patterns Like A Pro)
What Are The Best Trading Strategies For The Mat Hold Candlestick Pattern?
The Mat Hold pattern gives you more than just a continuation signal; it offers a reliable structure to build a strategy around. The strategies below show how to approach it from different angles depending on your trading style. Each method includes how to plan the trade, where to look for signals, and how to manage risk:
- Breakout Confirmation
- Retest Breakout
- Partial Exit
Breakout Confirmation With Volume Spike
A clean breakout supported by volume is one of the most reliable ways to trade the Mat Hold. Once the fifth candle breaks above the consolidation in a bullish setup, volume should increase, showing real participation from buyers. If the breakout candle forms with higher volume than the three consolidation candles before it, there’s a stronger chance the move will continue.
The entry can happen at the close of the breakout candle or on a slight pullback early in the next candle. Stop-loss placement goes below the consolidation zone. You can also use the 20-period EMA as a filter if the price stays above it after the breakout, the trend is likely intact. This strategy works well on the 1-hour and 4-hour charts.
Retest of the Breakout Zone
Not all breakouts move in a straight line. When price pulls back after the breakout, a retest of the consolidation zone can offer a second entry at a better price. This works best when the retest is controlled and shows signs of buyers stepping back in, like small-bodied candles or rejection wicks near the previous range.
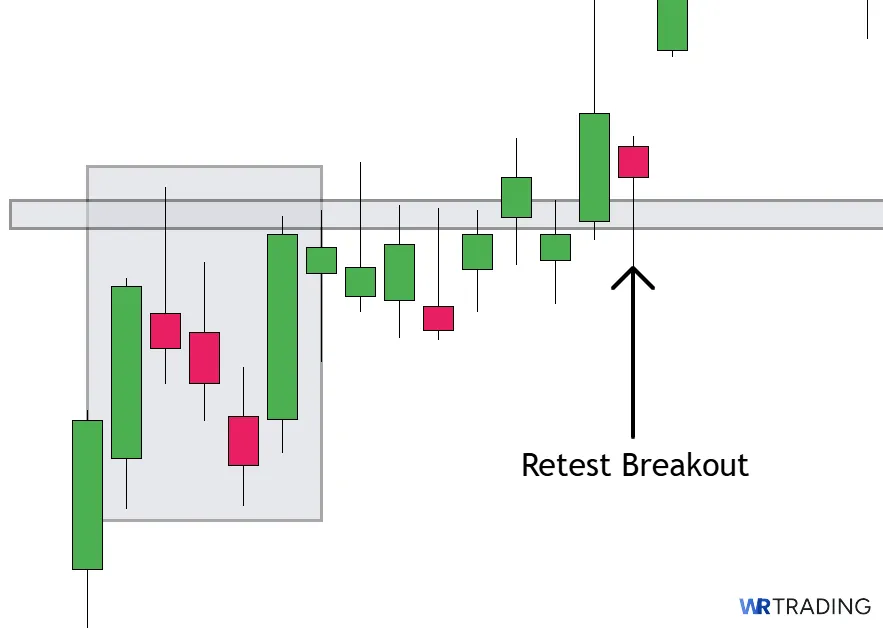
After spotting the retest, look for a bullish candle to close above the retest level before entering. The stop-loss can be placed just below the lowest point of the pullback. This strategy is great for traders who need confirmation before chasing initial momentum because it offers a tighter stop and better risk-to-reward.
Partial Exit With Trailing Stop
Locking in partial profits while keeping the rest of the trade open is a balanced way to trade the Mat Hold. Once the breakout candle closes and the trade begins to move in your favor, you can take partial profits at a defined level, such as the next swing high, a previous resistance, or a measured move projection. This reduces risk and gives you flexibility.
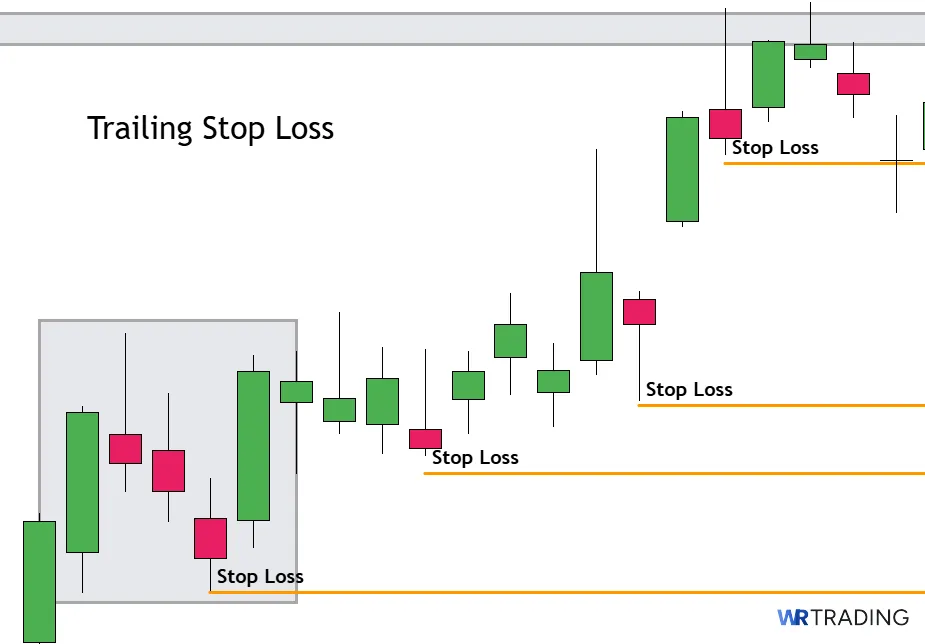
The remainder of your position can be managed with a trailing stop based on swing structure or an indicator like the ATR. That way, you remain in the trend as long as it’s valid, without exposing yourself to full reversal risk. This strategy works well in fast-moving markets where the price can run further than expected but also reverse quickly if momentum fades.
What Is The Success Rate Of The Mat Hold Candlestick Pattern?
According to Thomas Bulkowski’s Encyclopedia of Candlestick Charts, the bullish Mat Hold ranks 93rd out of 103 patterns for performance, with a 78% success rate in bullish continuations. However, in various market conditions, it has a 64% accuracy rate, placing it among the more reliable continuation patterns based on historical testing.
(Learn To Trade And Read Candlestick Patterns Like A Pro)
What Are the Pros and Cons of Trading the Mat Hold Candle Pattern?
The Mat Hold has some clear strengths when used in trending markets, but it also has a few limitations that can lead to unnecessary losses. This part of the guide lays out the pros and cons that every trader must know when applying this pattern.
Pros
- It provides a natural place to enter ongoing trends without chasing
- Risk is clearly defined based on the consolidation range
- The fifth candle acts as a confirmation tool
- The pattern reinforces discipline and timing
- It adapts well across asset classes and timeframes
Cons
- The pattern takes a long time to complete
- The consolidation phase can confuse traders unfamiliar with multi-candle patterns
- It’s less effective in sideways or range-bound markets
- The final breakout candle can move too aggressively
- Low-timeframe setups frequently produce unreliable signals
What Are The Advantages Of The Mat Hold Pattern?
The Mat Hold pattern offers traders a structured way to enter strong trends without having to catch the first breakout. It reinforces the existing direction of the market, making it valuable for trend-following strategies. These are the top advantages of trading the Mat Hold:
- It provides a natural place to enter ongoing trends without chasing: The Mat Hold forms after a strong momentum move and gives the market time to breathe before continuing. This pause allows traders to enter with structure rather than reacting to price spikes. When using the Mat Hold, you can enter mid-trend with lower risk and better timing.
- Risk is clearly defined based on the consolidation range: Because the three middle candles form a tight pause, traders can place stop-losses just outside that range. This makes it easier to calculate position size and maintain consistent risk across trades. It also reduces the chances of being stopped out by random volatility inside the range.
- The fifth candle acts as a confirmation tool: You’re not entering based on speculation, as the breakout candle either confirms the continuation or it doesn’t. This helps filter out weaker setups and prevents entering prematurely.
- The pattern reinforces discipline and timing: Since the Mat Hold requires a full five-candle sequence to complete, it forces you to wait instead of rushing into trades. This kind of built-in patience naturally filters out overtrading and reduces emotional decision-making.
- It adapts well across asset classes and timeframes: Whether you’re trading stocks, crypto, forex, or indices, the Mat Hold pattern works anywhere that trends and pauses occur. It’s equally effective on 1-hour, 4-hour, or daily charts, depending on your trading style. That versatility makes it a useful tool for both swing traders and intraday traders.
What Are The Disadvantages Of The Mat Hold Pattern?
Despite its clear structure and usefulness in trending markets, the Mat Hold candlestick pattern has several disadvantages traders must know. Recognizing these weaknesses helps avoid overconfidence and unnecessary risk.
- The pattern takes considerable time to complete: With five candles required, traders often face delays, potentially missing faster-moving market opportunities. By the time the Mat Hold completes, initial momentum might weaken. This delayed entry can reduce profitability or even invalidate the trade entirely.
- The consolidation phase can confuse traders unfamiliar with multi-candle patterns: Some traders misinterpret the three-candle pause as a reversal or weakness in the trend rather than consolidation. Misreading these candles can lead to inappropriate trade entries or premature exits.
- It’s less effective in sideways or range-bound markets: The Mat Hold pattern requires clear trending conditions to work effectively. In ranging markets, the breakout often fails to achieve meaningful follow-through. Traders who use this pattern in choppy conditions see reduced accuracy.
- The final breakout candle can move too aggressively: A rapid breakout might result in slippage or entry prices far worse than planned. Traders entering after sudden moves may experience lower risk-to-reward ratios and higher stop-loss risk. Such aggressive moves can also increase emotional decision-making like FOMO.
- Low-timeframe setups frequently produce unreliable signals: On timeframes like the 5-minute or 15-minute charts, price noise often invalidates the Mat Hold. Breakouts on these lower timeframes have less momentum, making reliable execution difficult. Higher timeframes consistently yield better results for this pattern.
Can the Mat Hold Pattern Have Failure Signals?
Yes, the Mat Hold pattern can definitely produce failure signals, and identifying these signals is needed to avoid false trades. Traders must stay cautious, as a failed Mat Hold can lead to sharp reversals or significant losses. Here are a few signals that commonly indicate a potential failure:
- Weak Fifth Candle Close: If the fifth candle closes weakly or within the consolidation range, the continuation fails. Traders expecting a strong breakout should avoid entering on uncertain closes. Without decisive movement, the trade loses its momentum immediately.
- Volume Decline During Breakout: Volume should increase noticeably during the breakout candle. If volume remains flat or declines, it signals weak participation and reduces the Mat Hold’s reliability. This lack of volume usually forecasts a failed breakout.
- Extended Consolidation: A prolonged consolidation phase beyond three candles weakens the structure. Longer pauses can signal indecision rather than controlled consolidation. If the breakout occurs after a stretched pause, its reliability diminishes.
- Candles Violating Initial Candle’s Range: The three small consolidation candles must remain within the first candle’s range. If any of these candles break outside significantly, the Mat Hold’s integrity is compromised. Traders should disregard setups showing this structural flaw.
- Immediate Reversal Post-Breakout: If the breakout candle is immediately followed by a strong reversal candle, the setup fails. Such reversals indicate trapped traders and a shift in momentum. Quickly exit positions or avoid entry entirely in such scenarios.
- Breakout at Strong Resistance or Support: A Mat Hold forming directly against a significant resistance (bullish) or support (bearish) level usually struggles. Price often rejects these zones strongly, invalidating the pattern. Avoid setups attempting breakouts at major chart barriers.
Which Indicators Can Be Combined With The Mat Hold Pattern?
The Mat Hold candlestick pattern works best when it’s supported by tools that confirm trend direction, momentum, and breakout strength. Indicators help reduce false signals by adding structure and context to the setup. While the pattern itself is price-action based, combining it with the right indicators can dramatically improve the quality of each trade.
- Moving Average (EMA 20 & 50): Exponential Moving Averages smooth out price action and confirm trend direction. The 20 and 50 EMA crossovers are effective for signaling trends and validating Mat Hold breakouts. A breakout supported by price above both EMAs greatly improves reliability.
- Relative Strength Index (RSI 14): RSI measures momentum and identifies overbought or oversold conditions. When the Mat Hold pattern breakout occurs with RSI rising (bullish) or falling (bearish) in agreement, it’s a powerful confirmation. RSI divergence can also highlight potential failures.
- Average True Range (ATR 14): ATR helps gauge market volatility and set realistic stop-loss distances. A rising ATR during the breakout candle can signal genuine momentum. Traders use ATR to avoid placing stops too tight and getting prematurely stopped out.
- Volume Indicator: Volume is crucial for validating the strength behind breakouts. A Mat Hold pattern with an accompanying volume spike significantly increases the likelihood of continuation. Low or decreasing volume warns of a weaker, possibly failing breakout.
- MACD (12, 26, 9): MACD confirms trend direction and momentum shifts through crossovers. A bullish MACD crossover occurring simultaneously with a bullish Mat Hold breakout strengthens the setup considerably. Negative or opposing MACD signals indicate caution.
- Bollinger Bands (20, 2): Bollinger Bands identify volatility expansions after consolidation. A Mat Hold breakout occurring alongside price expansion outside the Bollinger Bands confirms momentum and continuation potential. Lack of expansion suggests limited breakout follow-through.
- Fibonacci Retracement Levels: Fibonacci retracements pinpoint potential support or resistance areas after a pullback. The Mat Hold pattern often appears near these key retracement levels, adding another confirmation layer. Aligning entries with Fib levels improves precision and reduces risk.
(Learn To Trade And Read Candlestick Patterns Like A Pro)
Alternatives to the Mat Hold Pattern:
| Pattern | Type of Pattern | Best Use Case | Key Characteristic / Condition |
|---|---|---|---|
| Rising Three Methods | Bullish continuation | Ideal when price is trending up and you’re looking to enter after a short pause. | A strong bullish candle, three small inside bars, and a breakout continuation |
| Falling Three Methods | Bearish continuation | Useful during a clean downtrend when price takes a breather before heading lower. | A big red candle, three smaller candles that hold the range, and a breakout lower |
| Bullish Separating Line | Bullish continuation | Good for catching sudden trend resumes after a short pullback. | A bearish candle followed by a bullish one that opens at the same level |
| Bearish Separating Line | Bearish continuation | Best used when a downtrend briefly pauses before sellers step back in aggressively. | A bullish candle followed by a strong red candle that opens at the same level |
| Bullish Flag | Bullish continuation | Works well after a strong rally where price pulls back in a controlled way before pushing higher. | Downward-sloping flag structure that breaks out with renewed buying strength |
For more alternatives, we provide our ultimate Candlestick Chart Patterns PDF for free here.
What is the Difference between the Bullish Mat Hold pattern and the Bearish Hold Pattern?
The Bullish Mat Hold and Bearish Mat Hold patterns follow the same five-candle structure but play out in completely opposite trend conditions. They begin with a strong impulse candle in the direction of the current trend, followed by three smaller candles that form a brief pause or consolidation. The fifth candle then breaks out in the original direction, confirming the continuation.
What’s different between them is the direction of momentum and where they appear in the trend. The bullish version develops during an uptrend and confirms further upside, while the bearish version appears in a downtrend and signals a continuation lower.
| Section | Bullish Mat Hold Pattern | Bearish Mat Hold Pattern |
|---|---|---|
| Type of Pattern | Bullish continuation pattern. | Bearish continuation pattern. |
| Market Context | Forms during an uptrend when price temporarily pulls back before pushing higher. | Appears in a downtrend after a small pause before continuing lower. |
| Construction | Starts with a large bullish candle, followed by three small candles within its range, then a bullish breakout. | Begins with a large bearish candle, followed by three small candles, then a strong bearish breakout. |
| Breakout Direction | Fifth candle breaks above the consolidation, confirming continuation to the upside. | Fifth candle breaks below the consolidation, confirming continuation to the downside. |
| Best Use Case | Joining an existing bullish trend after a pause or shallow pullback. | Rejoining a downtrend after temporary consolidation or relief bounce. |
| Stop-Loss Placement | Placed just below the consolidation or first candle’s low. | Placed just above the consolidation or first candle’s high. |
What Are The Limitations Of The Mat Hold?
The Mat Hold pattern relies heavily on clearly trending markets. In sideways or choppy conditions, the consolidation phase often fails to produce meaningful breakouts. This limitation makes the pattern less effective in non-trending markets, increasing the likelihood of false signals and losses.
Moreover, the five-candle formation requires patience and discipline that some traders might lack. Rapid market movements or volatility spikes can quickly invalidate the structure.
Traders must carefully consider market context, timeframe, and overall momentum before executing trades based solely on this pattern.
Learn Pattern Trading With the WR Trading Mentoring
The WR Trading mentoring program provides comprehensive training designed to improve traders’ skills at identifying and effectively trading candlestick patterns like the Mat Hold.
Through structured lessons and real-market scenarios, traders learn how to integrate technical indicators, volume analysis, and risk management for stronger setups. WR Trading Mentoring significantly enhances traders’ consistency and profitability when trading patterns like the Mat Hold by combining practical trade strategies with disciplined execution.
(Learn To Trade And Read Candlestick Patterns Like A Pro)
Conclusion: The Mat Hold Is a Structured Continuation Pattern That Confirms Trend Strength
The Mat Hold candlestick pattern offers a clean, five-candle structure that helps traders enter ongoing trends. It stands out because it forces a pause in the market, gives price time to settle, and then confirms direction through a strong breakout. For those who trade with a trend-following mindset, it provides a high-quality opportunity without requiring you to catch the first move.
That said, it only works when the setup is clean and the market context supports continuation. Trying to force trades outside of those conditions usually leads to weak results. When combined with volume analysis, technical confluence, and proper trade planning, the Mat Hold becomes a reliable tool for entering strong trends with structure and discipline.
FAQs: Most Frequently asked Questions on Mat Hold Candlestick Pattern
What Is the Mat Hold Candlestick Pattern?
The Mat Hold is a five-candle continuation pattern that signals a pause in the trend before it resumes. It consists of an impulse candle, three smaller consolidation candles, and a breakout candle. This structure shows that buyers or sellers are still in control despite short-term hesitation.
Is the Mat Hold a Bullish or Bearish Pattern?
It can be either bullish or bearish depending on the direction of the trend before the pattern forms. In a bullish setup, it suggests continued upward momentum, while in a bearish setup, it supports further decline. The structure remains the same in both cases.
Which Timeframe Is Best for Trading the Mat Hold?
It works best on the 1-hour, 4-hour, or daily charts where price structure is more reliable. On lower timeframes, the pattern is often less clean and prone to noise. Higher timeframes also give the breakout more significance and follow-through.
Can I Trade the Mat Hold Pattern Without Indicators?
Yes, it can be traded using only price action. However, many traders use indicators like volume, moving averages, or RSI to improve confirmation. These tools help confirm whether the breakout is strong enough to justify a trade.
Is the Mat Hold Pattern Suitable for Beginners?
It’s a great pattern to learn because it enforces patience and discipline. However, beginners may find it challenging to identify until they’ve seen enough clean examples. Studying historical setups can help build recognition and timing.