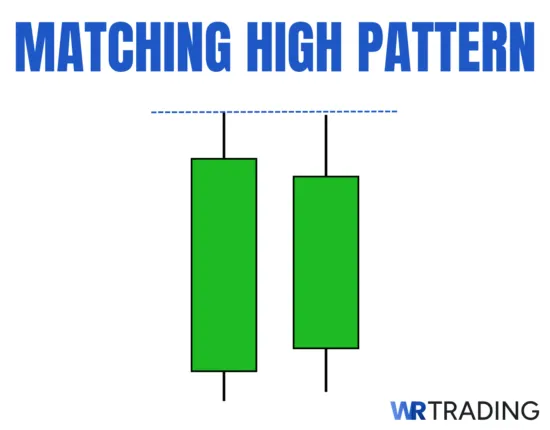
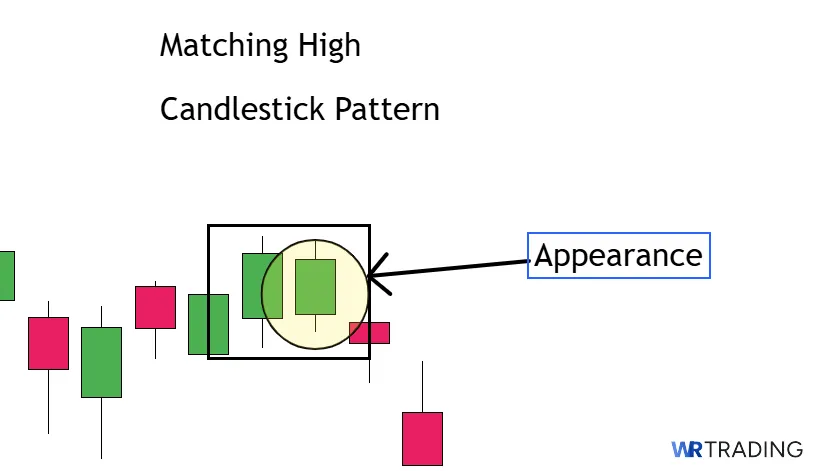
The Matching High candlestick pattern is a two-candle bearish formation that shows up after an upward price move. The first candle is a strong green bar that shows clear buying strength, followed by a smaller second green candle that opens within or near the previous body and closes at the exact same level as the first. The highs match precisely, creating a horizontal ceiling that acts as a short-term resistance line.
The green candles have a lower wick, which shows that sellers briefly pushed the price lower during the session, with a longer wick on the 2nd green candle. When that wick appears after a strong rally, it indicates that upward pressure is weakening. Many traders use the Matching High as a signal to take profits, watch for breakdowns, or prepare short positions if other reversal conditions are also present.
Some of the main advantages of the Matching High are: It creates a clean horizontal resistance line that shows where buying momentum has stalled, signals early trend exhaustion without relying on complex multi-candle setups, and helps set up short trades when confirmed with technical analysis tools.
In our comprehensive guide, you’ll learn how to spot the pattern, what it means when it forms, and how to trade it with confirmation. We’ll cover examples, setup rules, indicator combinations, and proven strategies to help you use the Matching High in a structured and reliable way.
Key Facts About The Matching High Candlestick Pattern:
- Type of Pattern: 2-candle bearish reversal pattern.
- Construction Characteristics:
- Candle 1: A strong green candle with a long body and a short lower wick.
- Candle 2: Another green candle that opens within the previous candle, forms a longer lower wick, and closes at the exact same level as the first green candle.
- Trend Prior to Pattern: Appears during an uptrend or near the end of a strong bullish leg, after buyers have been in control for several candlesticks.
- Trade Forecast: Suggests that the bullish move is weakening and that the market may reverse or pause as selling pressure begins to increase.
- Interpretation: The pattern shows hesitation from buyers, with the second close failing to push through the previous high, creating a clear resistance level.
- Stop-Loss Placement: Stops are placed just above the matching high, beyond the top of both candles, to protect against late breakouts.
- Opposite Pattern: Matching Low.
- Success Rate: 61%
(Learn To Trade And Read Candlestick Patterns Like A Pro)
How Does a Matching High Candlestick Pattern Form?
The Matching High pattern forms over two candles during the later stages of a bullish uptrend where the previous candles are green. The first candle shows strong buying pressure and closes at the high of the trend, with a large green body, a lower wick, and no upper wick.
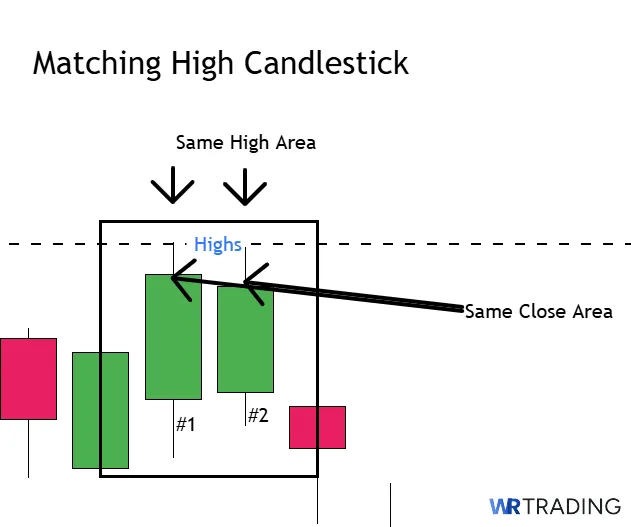
The second green candle opens anywhere within the body of the first green candle and closes at the exact same price with a longer lower wick. This matching close creates a visual ceiling that traders recognize as a potential resistance level.
What Does the Matching High Candlestick Pattern Mean?
The Matching High represents indecision and failed follow-through at the top of a bullish trend. The first green candle confirms that buyers are in control, but the second green candle signals that they’re losing momentum. When the market closes at the same price level two candles in a row, it indicates hesitation and a potential change in trend.
This matching close shows that buyers were unable to push higher despite having favorable conditions. If the second green candle includes a long lower wick, it means that sellers began to step in during the candle’s formation, indicating that upward pressure is losing strength.
From a psychological standpoint, the pattern shows a point where the market starts to reject higher prices. Buyers lose confidence or take profits, and early sellers begin to test the downside. It’s not a strong reversal signal but it can act as a warning that the trend is running out of strength. When this setup forms near resistance or after a sharp rally, it becomes more meaningful and helps traders prepare for the next move.
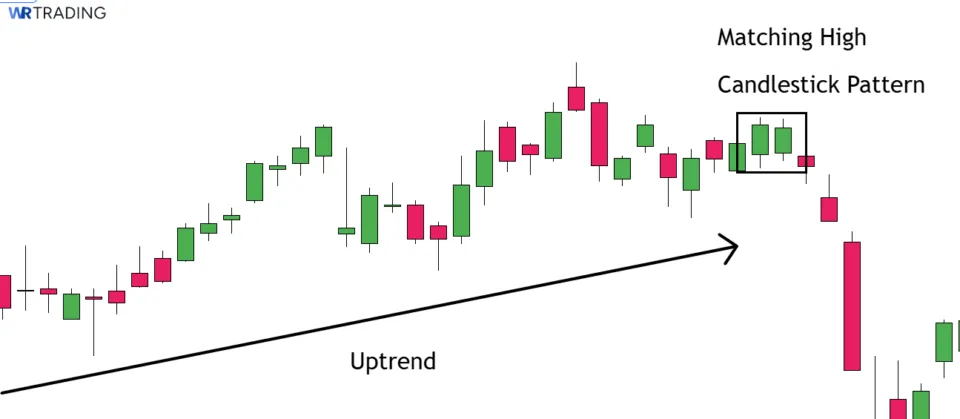
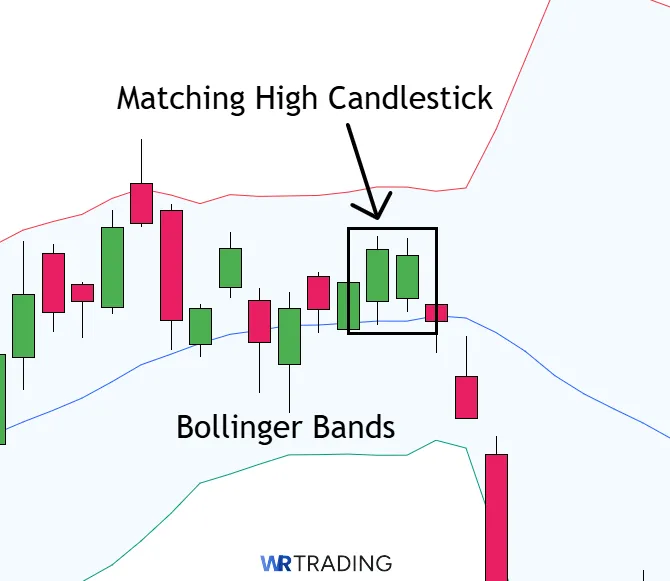
Example of the Matching High Pattern in the Chart
In the Example of the Microsoft Stock you can see the first bullish Candle. The Second one of the Matching High Pattern open near the same Area, reacehd the previos high und closes near the same Area.
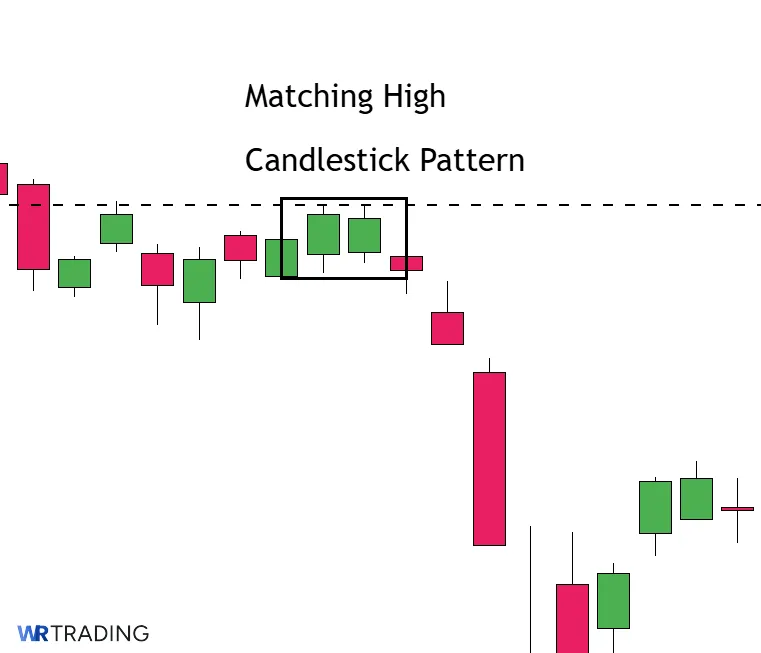
The Highs the both candles are at 47.44 USD, while both candle are green and bullish. Also they are closed in the same Pricearea of 47.33 USD.
(Learn To Trade And Read Candlestick Patterns Like A Pro)
How to Identify a Matching High Candle in the Chart?
To identify the Matching High candlestick pattern, begin by looking for a strong and uninterrupted uptrend. You want to see several green candles that close near their highs and show clear momentum.
The pattern starts with a large green candle that confirms buying pressure and finishes near the top of its range, with a small lower wick. The second candle should also be green and must close at the exact same level as the first, creating a horizontal resistance line that holds the price in place.
The second green candle can open anywhere within the range of the first green candle, but the close must match precisely for the pattern to be valid. In slower or less liquid markets, a one-tick difference is acceptable. The second candle often includes a longer lower wick, which shows that sellers entered the market briefly before the price recovered to the same close. The matching high is best found near the top of an extended move or close to a previously rejected price zone.
How to Trade the Matching High Candlestick Pattern
Trading the Matching High pattern begins with understanding the strength of the trend that comes before it and adapting to the trend direction. To build a reliable setup, you must combine the pattern with a trading plan and confirmation. This includes looking for the pattern near resistance, trendline highs, or psychological round numbers.
We’ll guide you through our process on how to trade the Matching High correctly with the following steps:
- Find the Right Matching High Candlestick Pattern Setup
- Wait for the Appearance of the Matching High Candle
- Open Your Trade – Entry Point
- Wait For A Confirmation Or Not
- Choose Your Trading Take Profit
(Learn To Trade And Read Candlestick Patterns Like A Pro)
1. Find the Right Matching High Candlestick Pattern Setup
Start by finding the right conditions for a strong Matching High setup, built from a clean directional move where prices advance through a series of higher closes and small pullbacks. The pattern must form after buyers have clearly shown control, and that pressure begins to weaken at a visible level on the chart.
Common areas where the Matching High becomes reliable are:
- The top of a rising bullish trend that has already run its course.
- A resistance level or prior swing high where the price has been rejected before.
- The upper boundary of a trendline, wedge, or price channel where sellers begin to show interest.
- A round number that has previously caused hesitation or reversals in the past.
These conditions provide clear logic behind the price reaction and give you a reason for why the hesitation matters. Only when these conditions are present does the Matching High become a valid signal for reversal and short entry.
2. Wait for the Appearance of the Matching High Candle
Next, wait for the full Matching High to form and avoid entering a short position beforehand to avoid false signals. The second green candle of the pattern confirms if the hesitation is strong enough to build a trade around it. This candle must close at the exact same price as the first green candle. The more precise the match, the stronger the structure becomes because it tells you that the price failed to break higher even after buyers made another attempt.
Therefore, if the second close is even slightly higher or lower, the pattern loses its purpose and should be ignored unless the match is near-perfect. You should also study the behavior within the second candle to gain additional information about sentiment. A lower wick during this candle shows that sellers began testing the downside during the formation, which adds confirmation to the idea that buyers are losing momentum.
3. Open Your Trade – Entry Point
Once the pattern is fully formed and meets all the criteria, your next task is to define a precise entry and stop-loss level. The short position should be placed just under the low of the second green candle, which acts as the trigger for the trade. This level is meaningful because it confirms that buyers have failed twice to break higher, and now the price is beginning to reverse from the pattern.
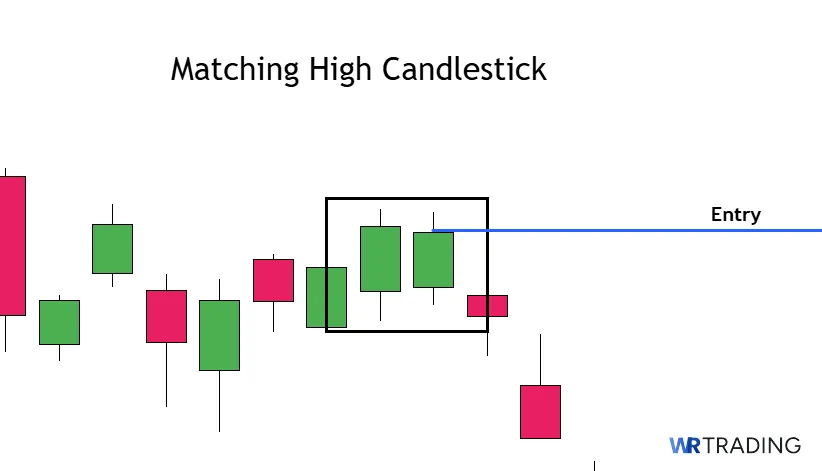
Entering only after this low is broken ensures that the hesitation has turned into a real shift in pressure, not just temporary indecision. If the price moves lower from this point, it confirms that sellers are stepping in and the signal is valid.
The stop-loss should be placed just above the shared high of the two candles. That level defines the boundary where buyers failed twice to move the price higher, and a break above it means the pattern has failed.
4. Wait For A Confirmation Or Not
Confirmation is a required part of the Matching High because without it the pattern is only a visual indicator with no proof that market direction is changing. You need to see the price break below the second green candle’s low since that movement shows a shift from hesitation into actual rejection. The Matching High only becomes usable after that level is taken out with clear selling pressure.
Also, a drop in volume during the second green candle adds confirmation by showing that buying pressure has slowed. If volume increases again when the price breaks lower, that shift in activity shows that control has passed to the sellers.
Furthermore, RSI can help filter out weak signals when it fails to rise during the pattern or begins to curve downward near resistance. These added confirmations reduce noise and give you more information to act on.
5. Choose Your Trading Take Profit
The Matching High does not include a built-in profit target, which means that exit planning must come from the surrounding chart structure along with technical analysis. You should use recent swing lows, support zones, or prior reaction levels to define where the price is likely to stall or bounce. These areas allow you to set realistic expectations and prepare for points where momentum may begin to fade or reverse.
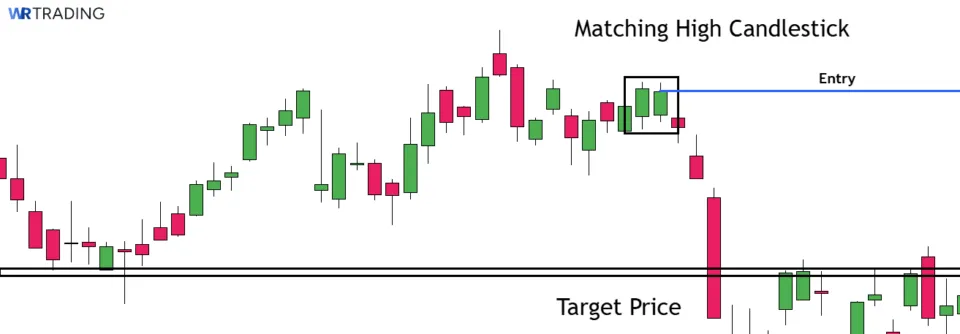
Another option is to use a range-based projection, where the height of the pattern is measured and applied below the entry to create a logical exit point. You can also manage the trade using tools like trailing stops, partial exits, or volatility-based targets, as long as the exit remains consistent with what the chart is showing you.
(Learn To Trade And Read Candlestick Patterns Like A Pro)
Which Strategies Can Be Used For The Matching High Candlestick Pattern?
The Matching High pattern works best when paired with tools that confirm weakness in price action because they help confirm the signal’s strength. The two identical closes indicate hesitation, but that signal alone is not enough without a breakdown or added information.
All our strategies require always waiting for a clean break below the second candle’s low before entering. This confirms that hesitation has turned into rejection and the Matching High is worth trading. Stop-loss placement should be just above the high of both candles since that is the level buyers failed to push beyond. Here are some strategies to look into:
- RSI Bearish Divergence Near Overbought Levels
- Failed Breakout at Supply Zones
- Volume Decline Beneath a Resistance Line
1. RSI Bearish Divergence Near Overbought Levels
The Relative Strength Index can be a confirmation tool when the Matching High appears during the late phase of an uptrend. Apply the standard 14-period setting in this strategy and observe how it reacts during the formation of the pattern. When the price prints a Matching High but the RSI begins to make lower highs or stalls below overbought thresholds, the result is a clear divergence between momentum and price.
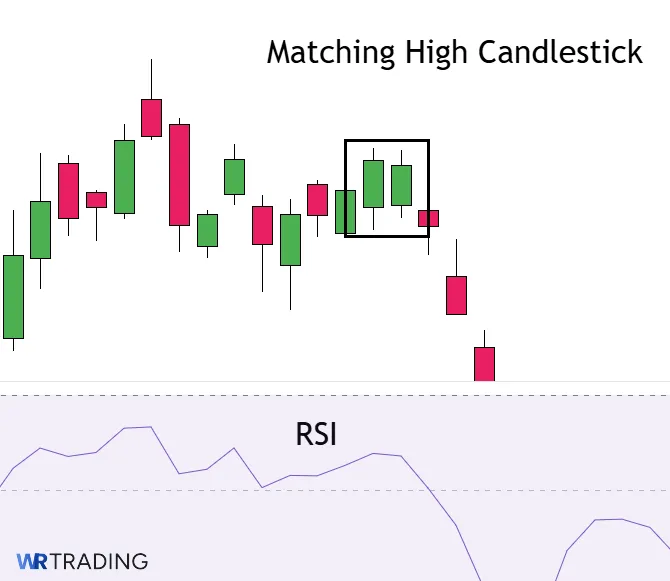
That divergence weakens the strength behind the price action and signals a loss of buying pressure. This is effective when the RSI has been elevated for several candles before the pattern appears. A failure to maintain momentum through the second green candle despite strong price action in the first candle is a meaningful signal that the rally is stalling.
Combine this with the flat double top of the Matching High and wait for the breakdown below the second candle’s low before entering. This method strengthens the pattern by confirming that the price hesitation is supported by internal weakness.
2. Failed Breakout at Supply Zones
Supply zones reflect areas where sellers overwhelmed buyers during previous rallies, creating zones of rejection that remain important on retests. When the Matching High forms directly under a known supply zone, it confirms that buyers have tested the area but were unable to break through. The identical close of the two candles tells you that buying effort was absorbed, and sellers are starting to regain control near a known area of supply.
This strategy works well when the price approaches a level that previously caused a sharp drop or has been tested multiple times without a clean breakout. The Matching High validates the rejection, as the shared close shows that buyers hit the same ceiling and failed again.
Once the second candle’s low breaks, the entry becomes clear, and the stop remains above the top. This setup benefits from context that adds meaning to the price action and supports the idea that the stall is not random but part of a larger behavioral pattern.
3. Volume Decline Beneath a Resistance Line
Volume is one of the most useful filters when trading the Matching High because it helps reveal if buyers are still active or starting to pull back. When the pattern appears beneath a clear resistance level, such as a swing high, a horizontal supply zone, or a psychological round number, the volume should be examined for signs of weakness during the second green candle.
When the first green candle prints with strong volume and the second closes at the same level but shows reduced volume, it indicates that the buying pressure is fading. The hesitation is visual and it’s backed by a shift in commitment, where sellers begin to absorb orders without needing to push the price lower yet.
To apply the strategy, Monitor volume bar-by-bar as the pattern forms and compare the size of the volume on the first and second candles. A healthy trend continuation should show equal or increasing volume during new highs. If that doesn’t happen, and volume shrinks during the second candle, it signals that buying pressure is being absorbed while sellers are committed.
(Learn To Trade And Read Candlestick Patterns Like A Pro)
What Is The Success Rate Of The Matching High Candlestick Pattern?
We researched any information about the Matching High success rate and found no confirmed data from academic research or industry testing that defines the exact success rate. However, our testing showed the Matching High produces better outcomes when it forms beneath a clean resistance level, aligns with volume weakness during the second candle, and breaks down with expanding selling pressure. We achieved a success rate of 61% when used with confirmation.
Is the Matching High Candlestick Pattern Suitable For Beginners?
Yes, the Matching High pattern can be suitable for beginners, only if they understand how to use it within the right market context. The visual setup is simple enough to recognize, but the challenge is in reading the price action around it and knowing when it actually means trading. Many newer traders fall into the trap of reacting too quickly to the two-matching closes without confirming if resistance, volume, or momentum supports the rejection.
Beginners should treat the Matching High as a starting point for potential short positions, not as an automatic signal to enter. To use it correctly, it needs to be combined with other tools like RSI or support and resistance levels to validate the direction. With enough practice, a new trader can learn to identify when this pattern signals real upcoming selling pressure and when it should be ignored entirely.
What Are the Pros and Cons of Trading the Matching High Candle Pattern?
To use the Matching High well, it’s important to understand its pros and cons, as this allows traders to make informed decisions, manage risk effectively, and filter out less reliable signals. This part of our guide will look closely at both its strengths and weaknesses, giving you a balanced view for when trading the Matching High.
Pros
- Can help avoid fake breakouts at highs
- Simplifies scanning for reversals with basic chart tools
- Gives structure to subjective resistance zones
- Has a built-in stop-loss level for short positions
- Fits naturally into reversal strategies using resistance levels
Cons
- Can appear frequently without delivering follow-through
- Useless without a nearby resistance zone
- Provides no guidance for setting targets
- Fails to work during strong uptrends
- Looks simple but depends heavily on chart context
What Are The Advantages Of The Matching High Pattern?
The Matching High pattern offers multiple advantages when integrated into a trading strategy. It provides a built-in stop-loss for short positions, fits naturally into reversal strategies using resistance levels, and helps avoid false breakouts at highs. Here are the main benefits of the Matching High:
- Has a built-in stop-loss level for short positions: The shared high of both candles forms a clear invalidation zone. You can place your stop just above it, knowing that if the price breaks that level, the bearish pressure is likely gone. This lets you manage risk based on the pattern.
- Fits naturally into reversal strategies using resistance levels: If you’re already trading based on key zones or failed breakouts, the Matching High acts as a final rejection cue. The equal closes align with your levels, helping you see where the reversal may begin. That makes the pattern easy to layer into your process.
- Can help avoid fake breakouts at highs: The pattern shows that the price touched the same high twice but failed to continue, warning you to avoid buying late into a move. This helps you sidestep common breakout traps. It shifts your focus from chasing strength to spotting exhaustion.
- Simplifies scanning for reversals with basic chart tools: You don’t need complex indicators to spot the Matching High. Just look for equal closes and where they happen in the chart. This keeps the setup accessible without compromising quality.
- Gives structure to subjective resistance zones: The double close confirms that the level is being defended, turning a vague price zone into a tested ceiling. It helps filter out sloppy resistance levels that haven’t been truly tested.
What Are The Disadvantages Of The Matching High Pattern?
The Matching High pattern comes with drawbacks that traders must understand to avoid misinterpretations and unprofitable trades. It frequently appears without follow-through, is useless without a nearby resistance zone, and provides no guidance for setting profit targets. Here are the main drawbacks of the Matching High:
- Can appear frequently without delivering follow-through: You’ll see the Matching High show up often during slow or choppy markets, but most of those setups fail to reverse. Without a real push from sellers, the price might just move sideways or continue higher. That makes confirmation absolutely necessary.
- Useless without a nearby resistance zone: If there’s no context around the double close, it loses meaning entirely. The Matching High needs to be pressed against a barrier to signal true rejection. Otherwise, it might just reflect normal consolidation before continuation.
- Provides no guidance for setting targets: The Matching High tells you when to enter, but not when to exit. You’ll need to rely on other tools like Fibonacci levels, previous support zones, or volatility bands to plan the trade.
- Fails to work during strong uptrends: In a market where buyers are dominating, hesitation alone doesn’t mean a reversal is coming. The Matching High may act like a pause before the next leg higher. This is one of the most common reasons the signal fails in live conditions.
- Looks simple but depends heavily on chart context: The Matching High is easy to recognize, but interpreting it correctly requires experience. You must read where it forms, what came before it, and how it behaves in real time. New traders often misread this and take low-quality setups.
(Learn To Trade And Read Candlestick Patterns Like A Pro)
Can the Matching High Pattern Have Failure Signals?
Yes, the Matching High pattern can show signs of failure as the pattern suggests a possible reversal but it’s not guaranteed. Therefore, recognizing these warnings helps traders avoid false signals and protect capital. These indications often show that buying strength remains too high for a significant downward move, or that the pattern’s market conditions do not support a true reversal.
- No Clear Uptrend Before Formation: The Matching High acts as a bearish reversal pattern, which means it should appear after a sustained upward price movement where buyers have been in control for several candlesticks. If the pattern forms during choppy or sideways price action, its importance as a reversal signal greatly diminishes. Without a clear trend to reverse, the hesitation implied by the matching highs loses its context.
- The Price Fails to Break Below the Second Candle’s Low: The main confirmation for a Matching High reversal is a price drop below the low of the second green candle. If the price does not move below this level after the pattern forms, it indicates that sellers have not gained enough control to push prices lower. This often results in the price consolidating or continuing its upward path, making the bearish signal invalid.
- High Volume on the Second Green Candle: A strong Matching High displays decreasing volume on the second green candle, showing fading buying interest. If the second green candle has strong or increasing volume, it suggests that buyers are still active and could push the price higher. This continued buying strength during the formation of the hesitation candle can be a warning sign.
- Forms Away from Key Resistance Areas: The Matching High becomes much more reliable when it appears at or near an established resistance level, such as a previous swing high, a trendline, or a psychological round number. If the pattern forms in the middle of a trend without clear resistance, its ability to trigger a significant reversal is very limited. Market context is needed for this pattern to be valid.
- Strong Bullish Market Conditions: In a market dominated by strong buying sentiment, where fundamental news or broader market feeling is very positive, technical patterns like the Matching High might have a lower success rate. Strong buying pressure can easily overwhelm short-term hesitation signals. Traders should always consider the wider market situation and the strength of the trend.
Which Indicators Can Be Combined With The Matching High Pattern?
Combining the Matching High pattern with other technical indicators can greatly improve its reliability, providing stronger confirmation for potential trades. These indicators help filter out weaker signals and offer a more complete view of market sentiment and momentum. Using them with the pattern helps ensure that the hesitation signaled by the matching closes is supported by other technical analysis methods.
- Relative Strength Index (RSI): The RSI, set to a 14-period setting, functions as a strong confirmation tool for the Matching High. Traders should look for bearish divergence, where the price forms a Matching High but the RSI makes lower highs, or observe if the RSI is pausing or turning down from overbought levels (above 70). This indicates weakening buying momentum even as the price action re-tests a high.
- Moving Averages: Short-term moving averages, such as the 20-period Exponential Moving Average (EMA), provide dynamic support or resistance levels. If the Matching High forms after the price has extended significantly above a key moving average, and the average begins to flatten or turn down, it can confirm the loss of upward momentum. A subsequent break below the EMA can be an additional confirmation of a bearish shift.
- Volume: Observe if volume decreases on the second green candle, indicating a reduction in buying interest even as the price re-tests the high. An increase in selling volume as the price breaks below the second candle’s low further confirms the bearish reversal, showing a clear shift in control to sellers.
- Bollinger Bands (Standard Settings): When the Matching High forms near the upper Bollinger Band after the price has moved along the band, it can signal that the price is becoming overextended. Standard settings, like the 20-period with 2 standard deviations work well for this. A failure to move convincingly above the upper band, combined with the matching closes, can indicate that the upward move is losing strength and a contraction or reversal is pending.
- MACD: The MACD, with settings of 12, 26, and 9, provides insights into momentum shifts. Look for the MACD line to cross below the signal line, or for the MACD histogram to start declining after the Matching High forms. Bearish divergence on the MACD, where the price makes new highs but MACD makes lower highs, strongly supports the idea that bullish momentum is fading, reinforcing the pattern.
(Learn To Trade And Read Candlestick Patterns Like A Pro)
What Are Similar Patterns To The Matching High Pattern?
Understanding candlestick patterns like the Matching High offers traders a more complete view of market behavior, improving pattern recognition. Other chart formations share qualities with the Matching High, such as signaling a pause in buying power or indicating a similar shift in how the market is behaving. Learning these additional patterns gives you more opportunities to spot possible trend reversals or even short breaks in the market, making your chart reading skills stronger. See more similar patterns in the table below:
| Pattern Name | Key Characteristic | Best Use Case |
|---|---|---|
| Double Top | Two peaks at roughly the same price level, separated by a trough. | Used to find major trend reversals in uptrends, on higher timeframes. The break below the “neckline” confirms the pattern. |
| Tweezers Top | Two or more candles with identical or nearly identical highs. Can be any combination of candle colors. | Good for signaling short-term reversals or strong resistance, seen at swing highs. The precise matching highs emphasize resistance. |
| Dark Cloud Cover | A large bearish candle that opens above the prior bullish candle’s close and then closes well below its midpoint. | Good for showing a loss of bullish control, when the bearish candle cuts deeply into the previous bullish candle. |
| Falling Three Methods | A long bearish candle, followed by three smaller bullish candles that stay within the first candle’s range, then another long bearish candle. | Use to signal a continuation of a prior downtrend after a short pause or period of sideways movement. |
| Three Black Crows | Three consecutive long-bodied bearish candles, each opening within the body of the previous candle and closing lower. | Excellent for showing a strong and continuous move lower, marking the start of a bearish trend or continuation of a downtrend. |
By downloading our free Candlestick Patterns PDF, you can find more alternatives and improve your analysis skills.
What Is The Opposite Pattern Of The Matching High?
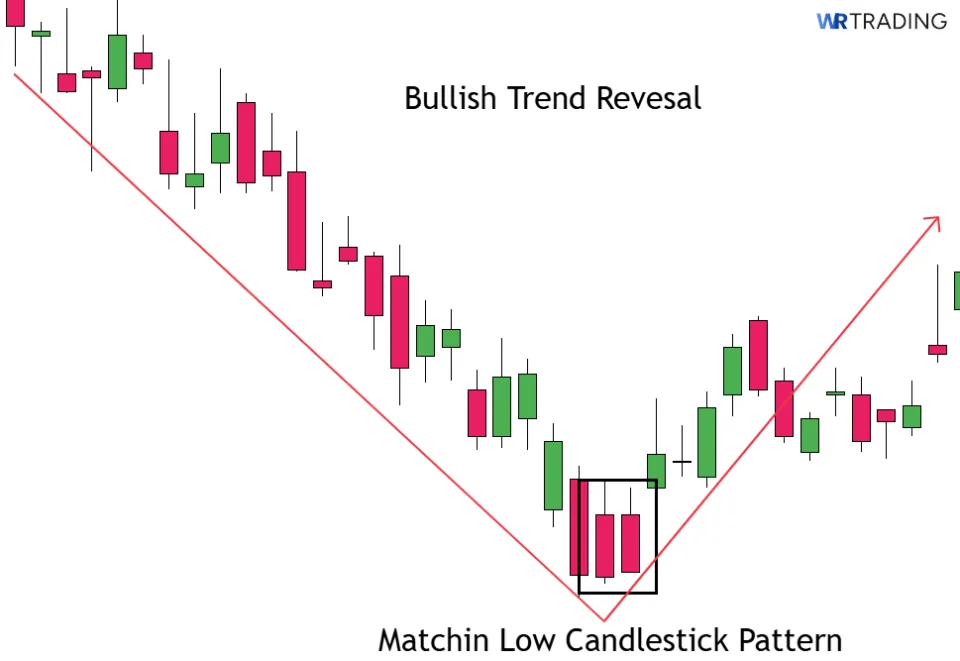
The direct opposite of the Matching High pattern is the Matching Low. The Matching Low is a two-candle bullish reversal pattern that shows up after a downward price move. In this formation, both candles are red and they close at the exact same low.
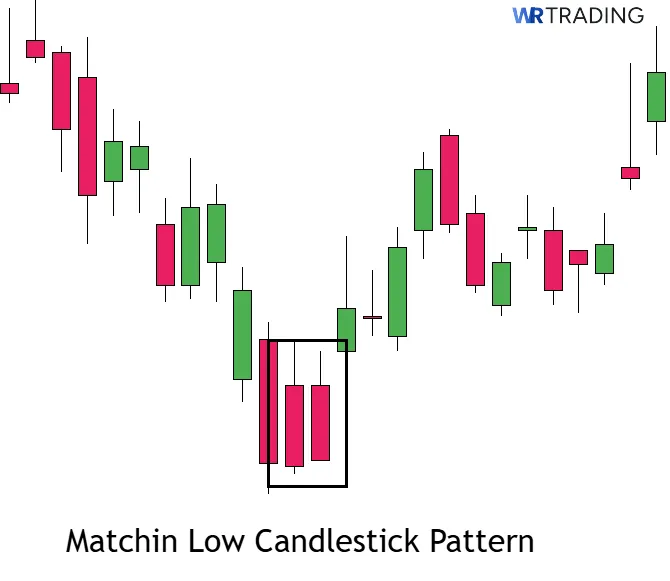
This equal close indicates that selling pressure has stalled, and strong support has appeared at that price level. The pattern suggests that the bullish move is gaining strength and the market may reverse or pause as buying pressure begins to increase.
What Is the Difference Between the Matching High and the Matching Low Pattern?
The Matching High and Matching Low patterns are direct opposites in how they signal market changes. The Matching High shows a bearish reversal, forming in uptrends when two green candles close at the same high. This indicates that buying power has stalled. The Matching Low signals a bullish reversal, appearing in downtrends when two red candles close at the exact same low.
The Matching High tells us the upward move is losing strength, while the Matching Low indicates selling pressure has ended and strong support has formed. Both patterns use precise matching closes to mark a pause in the current trend, with the Matching High pointing down and the Matching Low pointing up.
| Section | Matching High | Matching Low |
|---|---|---|
| Main Characteristics | Appears at the top of an uptrend with two green candles that close at the same price level. | Appears at the bottom of a downtrend with two red candles that close at the same price level. |
| Construction | Candle 1: Strong green candle with a short lower wick. Candle 2: Green candle that opens within the first and closes at the same high, with a longer lower wick. | Candle 1: Strong red candle with a short upper wick. Candle 2: Red candle that opens within the first and closes at the same low, with a longer upper wick. |
| Forecast | Suggests that buyers have run out of momentum and a reversal to the downside may occur. | Suggests that sellers have lost control and a bullish reversal may begin. |
| Type of Pattern | Two-candle bearish reversal pattern. | Two-candle bullish reversal pattern. |
| Trend Prior to Pattern | Forms during or after a strong bullish leg. | Forms during or after a strong bearish leg. |
| Best Use Case | Works best near resistance levels with added confirmation tools showing exhaustion. | Works best near support zones with added confirmation tools showing rejection. |
(Learn To Trade And Read Candlestick Patterns Like A Pro)
What Is the Difference Between the Matching High and the Tower Bottom Pattern?
The Matching High and Tower Bottom patterns both signal reversals, but they differ significantly in their structure, the number of candles involved, and the speed of the shift they indicate. The Matching High is a quick, two-candle pattern showing a bearish reversal. It signals a pause in buying power at the same price level. The Tower Bottom is a more extended, multi-candle formation that signals a bullish reversal, appearing after a gradual slowdown in a downtrend.
The Matching High has precise matching highs to show immediate hesitation. The Tower Bottom builds its reversal over 5 candles, with a large first bearish candle, then smaller, indecisive candles, followed by a strong bullish candle that “towers” over the previous small candles. This difference means the Matching High suggests a fast rejection, while the Tower Bottom indicates a more gradual change in market control.
| Section | Matching High | Tower Bottom |
|---|---|---|
| Main Characteristics | Appears at the end of an uptrend, showing that buying pressure has stalled after price fails to break higher. | A multi-candle reversal that shows a gradual loss of selling followed by a decisive bullish breakout. |
| Construction | Candle 1: Strong green candle with a short lower wick. Candle 2: Green candle that opens within the first and closes at the same high, with a longer lower wick. | Candle 1: A large red candle that shows strong selling pressure and continuation of the downtrend. Candles 2 to 4: A series of smaller candles, often mixed in color, that show indecision and weakening momentum. Candle 5: A strong green candle that closes near its high and breaks above the range created by the previous candles, signaling that buyers have taken control. |
| Forecast | Predicts a potential shift into bearish momentum as bullish strength fades. | Shows a powerful bullish reversal once buying pressure returns after a slow decline. |
| Type of Pattern | Two-candle bearish reversal pattern. | Multi-candle bullish reversal pattern. |
| Trend Prior to Pattern | Forms after an extended bullish move, often at or near resistance. | Forms after a steady downtrend, once selling volume fades and buyers begin stepping in. |
| Best Use Case | Best used near resistance zones with added confirmation from rejection signals or bearish indicators. | Best used to spot major bottoms when volume and price structure confirm a return of demand. |
What Is the Difference Between the Matching High and Bearish Stick Sandwich Pattern?
The Matching High is a two-candle bearish reversal pattern, while the Bearish Stick Sandwich functions as a three-candle bearish continuation pattern. The Matching High appears in uptrends, with two green candles closing at the same high, indicating that buying power has stalled. The Bearish Stick Sandwich forms within an existing downtrend and features a bullish candle completely enclosed by two bearish candles, suggesting the downward movement will continue after a brief pause.
The Matching High points to an upcoming trend change at the top of a rally. The Bearish Stick Sandwich indicates that the existing decline will likely persist following a temporary upward correction. This means one anticipates a shift in direction, while the other confirms the ongoing trend.
| Section | Matching High | Bearish Stick Sandwich |
|---|---|---|
| Main Characteristics | Shows up at the end of a bullish trend, showing that buying pressure has failed as the price fails to break higher twice. | A three-candle continuation pattern that shows sellers remain in control after a brief bullish pause. |
| Construction | Candle 1: A strong green candle with a long body and a short lower wick. Candle 2: Another green candle that opens within the first, forms a longer lower wick, and closes at the same level as the first. The highs match precisely, creating a horizontal ceiling. | Candle 1: A long red candle. Candle 2: A smaller green candle that opens higher and closes within the first candle’s range. Candle 3: A second red candle that opens above the prior close and closes below the second candle’s low. |
| Forecast | Predicts a potential reversal into bearish momentum, suggesting the uptrend may be over. | Predicts the continuation of a bearish trend after a failed attempt at recovery. |
| Type of Pattern | Two-candle bearish reversal pattern. | Three-candle bearish continuation pattern. |
| Trend Prior to Pattern | Appears after a strong bullish leg, often at or near exhaustion levels. | Forms within an existing downtrend after a shallow counter-trend move or pause. |
| Best Use Case | Best used near resistance zones with confirmation tools that show hesitation or fading momentum. | Best used to confirm trend continuation in a downtrend. |
What Are The Limitations Of The Matching High?
The Matching High pattern comes with specific limitations that traders need to recognize before relying on it in live trading. Its structure alone is not enough to act on, and without proper chart context or supporting trend strength, the signal can lead to weak entries or incorrect assumptions. Understanding these drawbacks is important for any trader using this pattern.
- The pattern has low success without a nearby resistance zone, as it loses all meaning if it does not form against a price barrier to signal true rejection.
- The pattern fails to work during strong uptrends, as the hesitation it shows may only be a pause before the next upward move in a market dominated by buyers.
- While visually simple, the Matching High depends heavily on chart context, requiring experience to interpret correctly based on its formation location and prior price action.
- The pattern is susceptible to false breakouts above its high, where a brief price spike can trigger stop losses before a genuine bearish reversal occurs.
- The pattern’s stated success rate, at 61%, shows it’s not a high-probability setup, requiring additional confirmation.
Learn Pattern Trading With the WR Trading Mentoring
The WR Trading Mentoring program offers traders a clear plan to apply candlestick patterns like the Matching High within proven strategies. It builds understanding from basic market analysis, teaching observation skills before trading. This foundation moves to developing profitable strategies, guiding individuals from demo to live trading with a goal of positive performance within months.
This mentorship stands out by prioritizing practical application over theory, avoiding lengthy academic video series or an overloaded set of tools. You’ll get to see what works and what doesn’t via demo trading. It teaches the discipline of a fixed trading plan, with the critical skill of knowing exactly when to enter a trade and when to avoid patterns, which directly limits losses.
The program focuses on a single market so beginners don’t get overwhelmed. Ideally, you will need a daily time commitment of only one to three hours for faster results. Choosing WR Trading mentorship means investing in a refined, actionable course designed for genuine trading success.
(Learn To Trade And Read Candlestick Patterns Like A Pro)
Conclusion: The Matching High Is a Great Pattern for Spotting Bullish Trend Weakness
To summarize, we’ve shown that the Matching High candlestick pattern has specific strengths when used with confirmation. It shows hesitation at the top of a bullish move by repeating the exact same closing price two candles in a row. That matching level acts as a resistance ceiling, and if sellers step in afterward, the signal becomes actionable. When the second candle includes a longer lower wick, it adds strength to the setup by revealing early selling pressure.
This pattern does not work in isolation or without context. We have seen from experience that the most reliable Matching High patterns form at known resistance zones and are backed by confirmation from momentum or volume tools. We recommend using the Matching High to either exit long positions or prepare for short setups when the trend shows signs of slowing and confirmation is present.
FAQs: Most Asked Questions on the Matching High Pattern
What Makes the Matching High Pattern Different From Other Bearish Reversal Signals?
The Matching High focuses on two consecutive candles that close at the same price level, highlighting stalled momentum. Other reversal patterns often rely on engulfing or piercing behavior, but this one emphasizes hesitation rather than dominance. It is subtle but effective when it forms near resistance.
Is the Color of the Candles in the Matching High Always Green?
Yes, reliable Matching High setups include two green candles, as it forms in an uptrend and signals failure to continue. However, slight variations may include candles with small wicks or neutral tones. The shared high close is the most important feature.
How Important Is the Wick Structure in the Matching High?
The longer lower wick in the second candle can suggest increased selling pressure, which adds to the pattern’s strength by revealing rejection. Wicks that show failed continuation increase the Matching High’s reliability.
Can Volume Be Used to Confirm the Matching High Setup?
Yes, volume is one of the best tools to confirm this pattern. A drop in volume during the second candle followed by a spike when the price breaks below supports the bearish momentum. It shows that the rejection is backed by activity.
Should I Use the Matching High to Exit Long Trades?
Yes, the Matching High can signal that an uptrend has lost strength. When it forms near resistance, it shows a short-term top. Closing or reducing long exposure in these spots can help avoid unnecessary losses.