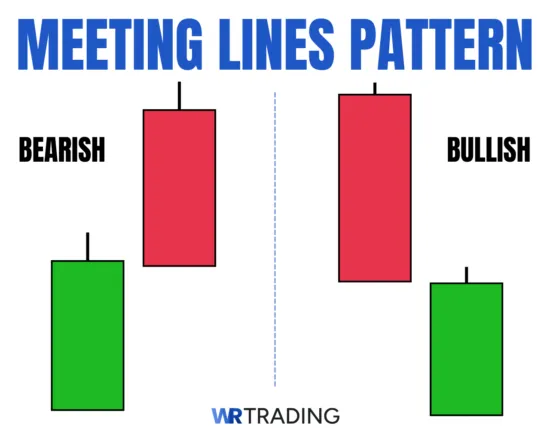
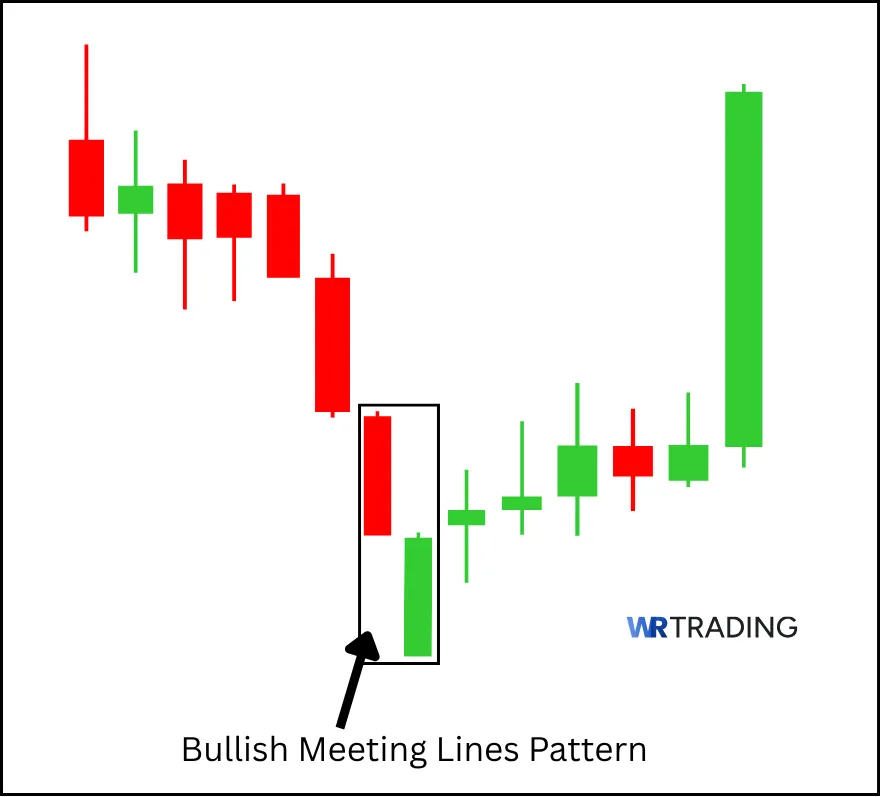
The Meeting Lines candlestick pattern is a two-bar reversal signal that occurs at the end of a trend. It forms when a strong candle is followed by an opposing candle of similar size that closes at or near the previous candle’s close. This creates a “meeting point” between opposing market forces. The pattern can be bullish or bearish depending on where it forms.
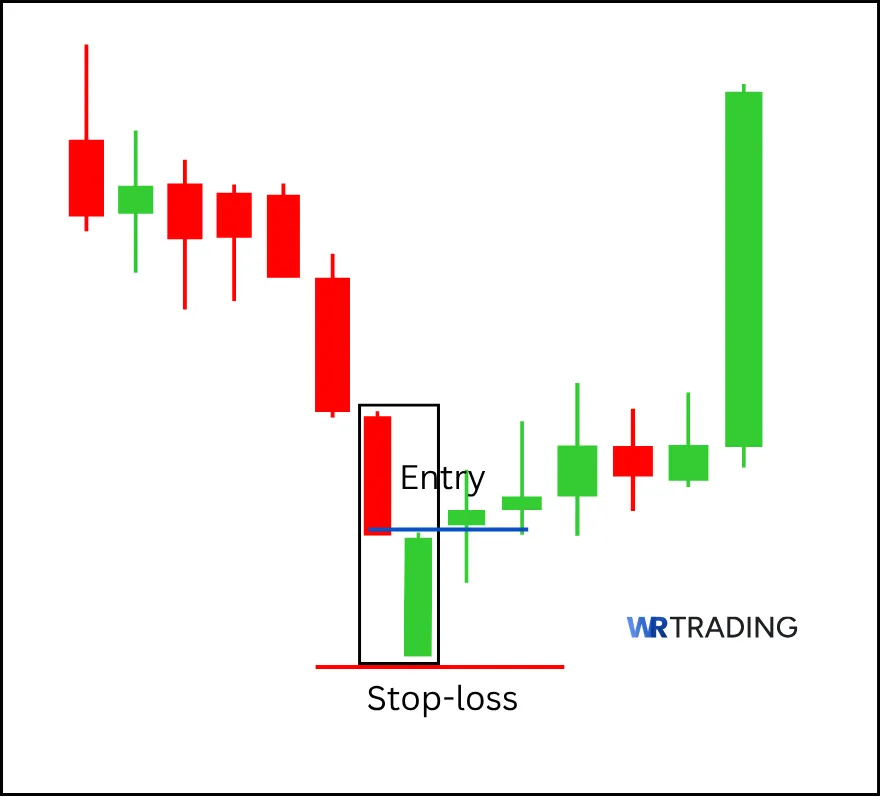
To trade the Meeting Lines pattern, traders can enter a position when the second candle closes, confirming the reversal. For bullish setups, traders can buy above the second candle’s high with a stop loss below the pattern’s low. For bearish setups, they can sell below the second candle’s low with a stop loss above the pattern’s high.
This comprehensive guide covers the pattern’s formation, psychology, identification, and trading strategies, with real-world examples and confirmation techniques. Our extensive testing across forex, stocks, and crypto markets also reveals that this pattern reliably signals powerful reversals when appearing in key structured zones with confirmation. We’ll walk you through how we use it, why it works, and when to ignore it.
(Learn To Trade And Read Candlestick Patterns Like A Pro)
What Is a Bullish Meeting Lines Pattern?
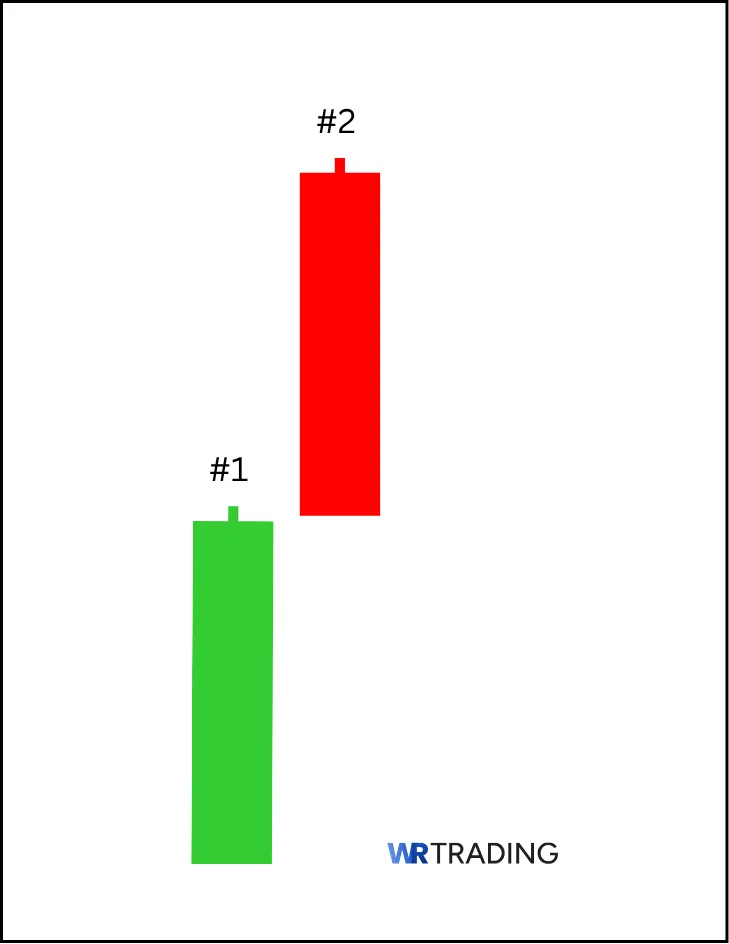
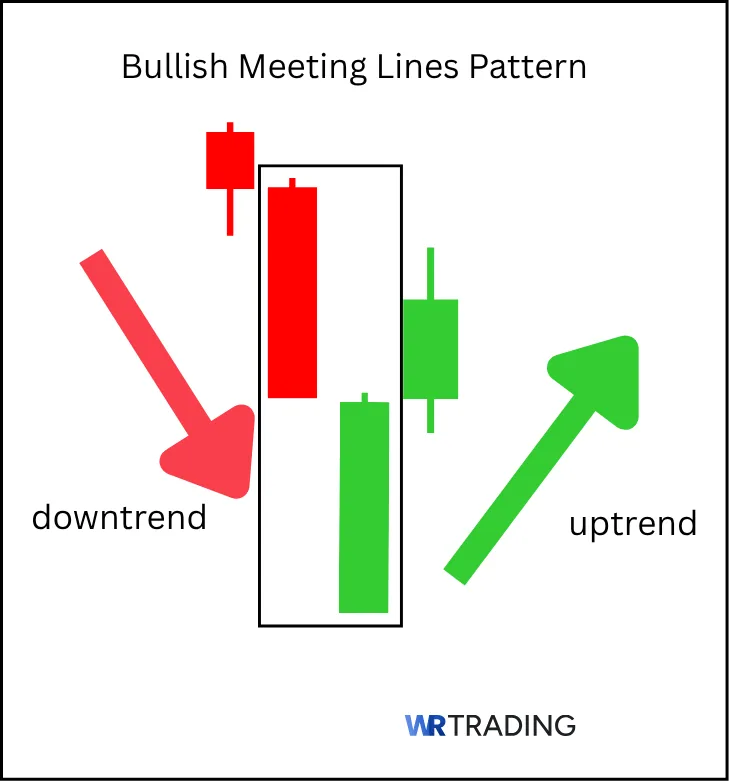
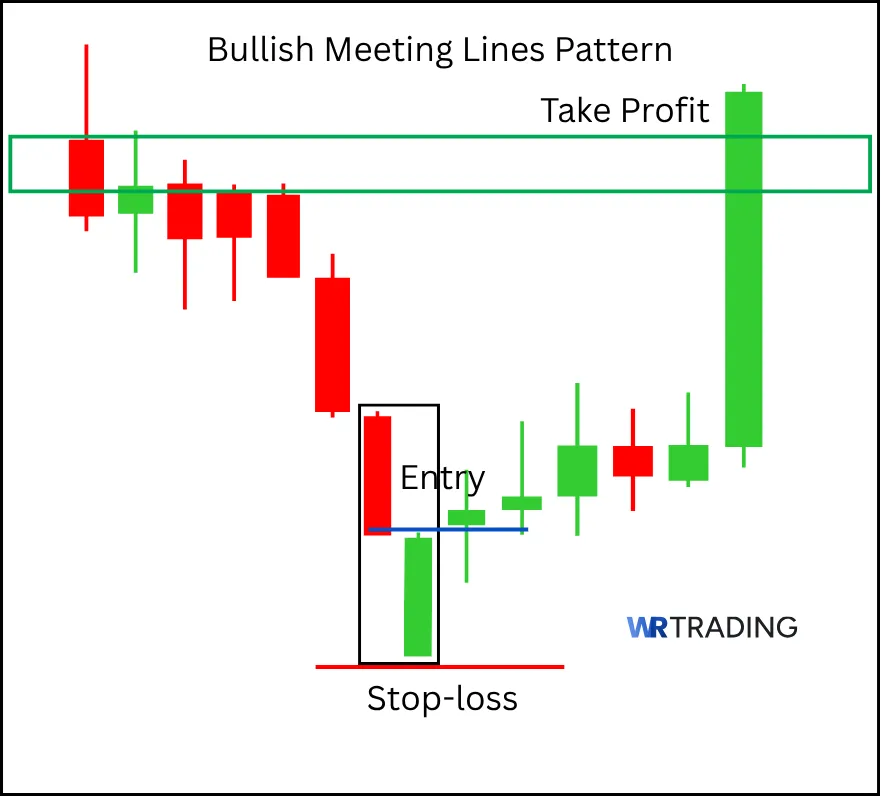
The Bullish Meeting Lines pattern is a two-candle reversal setup that forms during a downtrend. It begins with a long red candle showing aggressive selling. The second candle is a green candle that opens lower but closes at or near the same price as the first candle’s close. This close alignment signals that buyers have stepped in with enough strength to meet the previous session’s selling pressure head-on.
Key Facts of The Bullish Meeting Lines Candlestick Pattern:
- First Candle: Long bearish candle
- Second Candle: long bullish candle
- Type of Pattern: Bullish reversal.
- Trend Prior to Pattern: Downtrend
- Opposite Pattern: Bearish Meeting Lines Pattern
- Entry Options: High of the initial bearish candle
- Stop-Loss Placement: The low of the second bullish candle
- Success Rate: 66%.
- Interpretation: The confluence of opposing candles around a particular level shows the counterbalance of selling and buying pressure for a potential flip of momentum in favor of buyers.
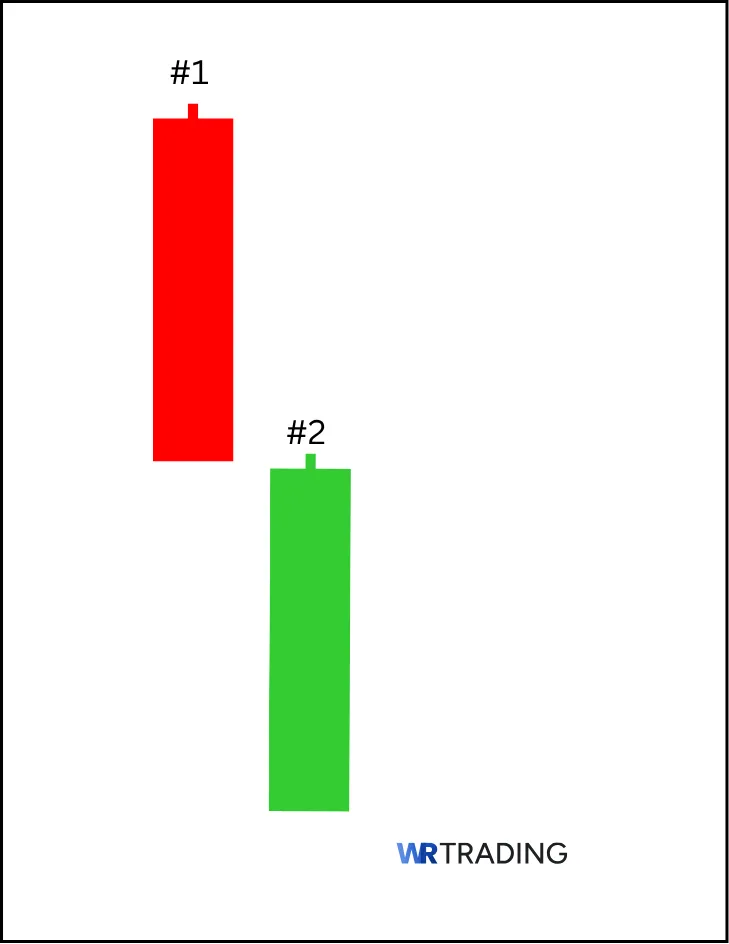
What Is a Bearish Meeting Lines Pattern?
The Bearish Meeting Lines pattern is a two-candle reversal formation that appears after a bullish move. It begins with a strong green candle reflecting aggressive buying, then comes a second red candle that opens higher but closes at or near the same level as the previous green candle’s close. This close alignment shows that sellers have stepped in to block further upside momentum, potentially flipping sentiment from bullish to bearish.
Key Facts of The Bearish Meeting Lines Candlestick Pattern:
- First Candle: Long bullish candle
- Second Candle: long bearish candle
- Type of Pattern: Bearish reversal.
- Trend Prior to Pattern: Uptrend
- Opposite Pattern: Bullish Meeting Lines Pattern
- Entry Options: The low of the initial bullish candle
- Stop-Loss Placement: Above the high of the second bullish candle
- Success Rate: 60%.
- Interpretation: The confluence of opposing candles around a particular level shows the counterbalance of buying and selling pressure for a potential flip of momentum in favor of sellers.
(Learn To Trade And Read Candlestick Patterns Like A Pro)
How Is The Meeting Lines Pattern Formed?
The Meeting Lines candlestick pattern is formed by two consecutive candles within a trending market. It develops at key turning points; either at the end of a downtrend (bullish version) or at the top of an uptrend (bearish version). The pattern is defined by the closing alignment between the first and second candles.
The full pattern requires:
- Two Candles Only: There is no third bar in the structure.
- A Trend Before Formation: This pattern is not valid in sideways markets.
- Tight Closing Levels: Both candles must close at or nearly the same price to qualify.
We watch for this pattern after extended legs in the trend. When price meets key structural zones and prints a Meeting Lines setup, we consider it a sign that momentum may be shifting.
What Does The Meeting Lines Candlestick Pattern Mean?
The Meeting Lines pattern represents a psychological stalemate between buyers and sellers after a dominant price move. It signals that the side in control — bulls or bears — may be losing momentum, and a shift could be underway.
In the bullish version, sellers dominate the first candle, pushing price lower. The second candle opens with a gap down, but buyers recover enough to close the candle at the same level sellers previously ended. This suggests buying pressure is starting to neutralize the downtrend. Sellers lose their grip, and the market pauses or begins to reverse.
In the bearish version, buyers push the market higher, but the next candle opens with bullish intent and fails, gapping up. Sellers step in and drag the price back to the close of the previous candle. This signals fading buyer strength and the possible start of a reversal or pullback.
We treat the Meeting Lines as a momentum-check pattern. It tells us one side just lost steam, and when this forms at key support or resistance zones, it can signify an early edge in the other direction.
Where Does the Name of the Meeting Lines Pattern Come From?
The pattern gets its name from the two candles “meeting” or closing at the same price level, despite coming from opposite directions. This visual alignment of the closes is the defining trait that gives the pattern its identity.
(Learn To Trade And Read Candlestick Patterns Like A Pro)
What Is An Example Of The Meeting Lines Pattern?
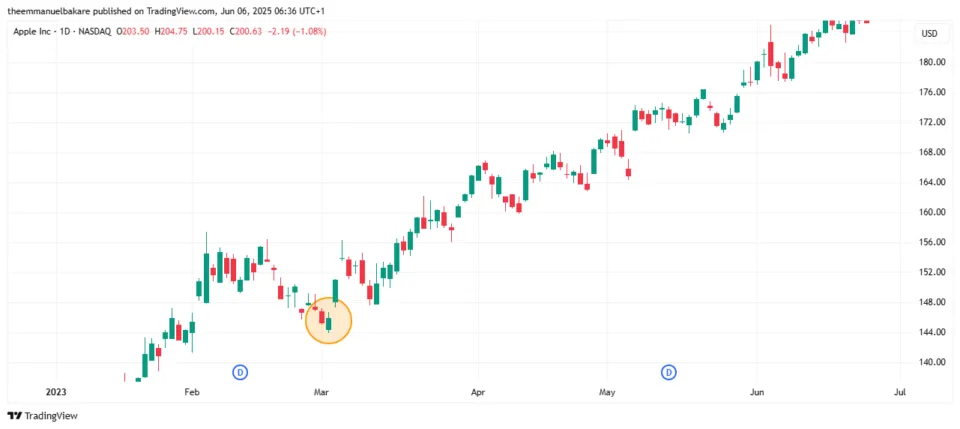
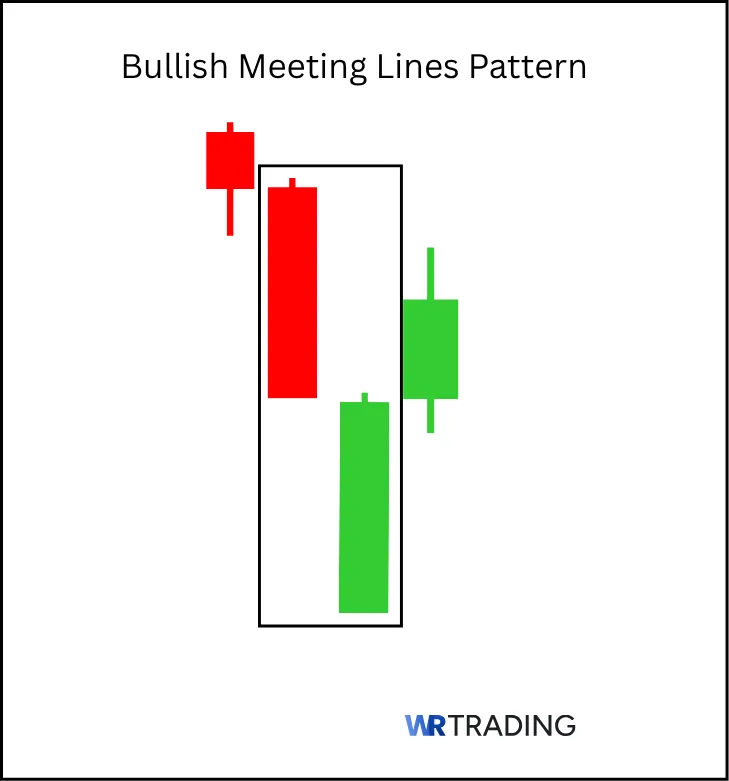
A clean bullish Meeting Lines setup appeared on the APPL daily chart between March 01 and March 02, 2023.
- First Candle (Bearish): Appl stocks were in a short-term downtrend. On March 01, the price opened at 146.823 and closed lower at 145.31, forming a long red candle with no significant lower wick.
- Second Candle (Bullish): On March 02, price opened with a gap down at 144.38, dropped slightly, then reversed to close at 146.71, almost exactly where the red candle closed. The green candle signaled buyers were stepping in, rejecting further downside movement.
Following the pattern, APPL rallied beyond 184.95, confirming the bullish reversal.
How To Identify The Meeting Lines Pattern
To identify a Meeting Lines pattern, start by checking the market structure. You need a clear trend: uptrend for bearish Meeting Lines, downtrend for bullish Meeting Lines. Here’s what to look for:
- Prior Trend: A consistent move; lower highs and lows for bullish setups, higher highs and lows for bearish setups.
- First Candle: Long-bodied, full-momentum candle (red in downtrend, green in uptrend).
- Second Candle: Opposite color, full-bodied candle. Opens with a gap and closes at or near the first candle’s close.
- Location: The pattern is more meaningful near key levels, such as previous support, resistance, or supply/demand zones.
At WR Trading, we scan for this setup on the 4H and Daily charts, where market structure is cleaner. The more precise the close alignment, the more valid the signal.
(Learn To Trade And Read Candlestick Patterns Like A Pro)
How To Trade The Meeting Lines Pattern
Trading the Meeting Lines candlestick pattern requires structure, timing, and confirmation. We treat this pattern as a potential reversal clue, not an automatic trade trigger. Here’s how we trade it in five clear steps:
- Find the right setup for the meeting lines
- Wait For The Appearance Of The Meeting Lines Candlestick Pattern
- Open Your Trade – Entry Point
- Wait For A Confirmation Or Not
- Choose Your Trading Take Profit
1. Find the Right Setup For The Meeting Lines
The first step is to scan for structured trending conditions. The areas to watch are:
- Retests of broken structure (support/resistance flip).
- Key Fibonacci retracement levels (0.382 / 0.618).
- Previous demand or supply zones confirmed by volume reaction.
- Trendline or moving average confluence (20 EMA or 50 EMA on 4H or Daily).
We don’t trade the pattern in isolation, we trade it where context supports a reversal.
2. Wait For The Appearance Of The Meeting Lines Candlestick Pattern
Once the price reaches a potential reversal zone, we wait for the pattern to form, and we let it close fully before making any decisions. We must see the following:
- A strong, full-bodied candle.
- A second candle of the opposite color that opens with a gap and closes approximately at the first candle’s close.
- Minimal wick overlap. Clean structure is key.
This is where most traders fail, they jump in before the second candle closes. We wait for full formation; no exceptions.
3. Open Your Trade – Entry Point
We enter trades only after the full two-candle pattern has closed. Depending on your trading style, you can choose between two entry types:
- Aggressive Entry: Enter immediately after the second candle closes, once it meets the pattern rules and sits on a clean level.
- Conservative Entry: Enter at the low of the first candle.
You can set your stop loss either below the low of the second candle (for bullish setups), above the high of the second candle (for bearish setups) or add a small buffer using ATR(14), especially in volatile conditions.
Always use between 1% to 2% risk per trade. Calculate your lot size using your stop distance and account size.
4. Wait For A Confirmation Or Not
We prioritize waiting for a confirmation only when trading conditions are unclear. For example, when:
- The Pattern forms in low-volume environments.
- Candles have long wicks (shows rejection, not commitment).
- The pattern appears near minor levels, not major zones.
In a situation where a pattern forms cleanly on structure and volume confirms the move, we trade it without waiting. But in messy charts, confirmation is non-negotiable.
5. Choose Your Trading Take Profit
Taking profit isn’t about being right, it is about compounding wins. We never set take profit targets blindly. Here’s how we do it:
- Target 1 (TP1): Nearest swing high/low from the opposite direction or next Fibonacci extension level.
- Target 2 (TP2): Second swing high/low from the opposite direction.
- Minimum RR: Always aim for at least 1:2 risk-to-reward ratio. Anything less and we skip it.
- Optional Trailing Exit: Once price hits 1R, you can trail the stop behind the structure to capture more from momentum runs.
(Learn To Trade And Read Candlestick Patterns Like A Pro)
Which Strategies Can Be Used For The Meeting Lines Candlestick Pattern?
When trading this candlestick pattern, we use certain strategies that improve its precision, filter out false setups, and increase the accuracy of our entries and exits. Let’s explore some below.
1. Support and Resistance Strategy
This is one of the most reliable ways to use the Meeting Lines pattern.
- How it Works: Wait for the pattern to form directly on a strong support (for bullish setups) or resistance (for bearish setups) zone.
- Why it Matters: When price reacts at a previously tested level, the pattern gains meaning. It shows that buyers or sellers are actively defending that zone.
- Execution Tip: Confirm the level with horizontal lines drawn from previous swing highs/lows.
2. Volume-Based Confirmation
Volume gives context to every pattern. A Meeting Lines setup backed by volume spikes has more conviction.
- How it Works: Look for a volume surge on the second candle or the candle right after the pattern.
- Bullish Setups: Volume should rise as the green candle closes at the red candle’s level.
- Bearish Setups: Volume should rise as the red candle pulls back to the previous close.
- Execution Tip: Avoid setups with declining volume; they tend to fake out or stall.
3. Breakout Strategy
Use the Meeting Lines as a pre-breakout clue when price is approaching a structural level.
- How it Works: When the pattern forms just before a breakout zone, it often signals a momentum reversal.
- Entry: Enter after a breakout of the high (bullish) or low (bearish) of the pattern, not just at the close.
- Stop-loss: Below or above the pattern’s range, with a buffer based on ATR.
- Execution Tip: Combine the pattern with breakout retests for added confluence.
4. RSI + Momentum Indicators
Momentum tools help confirm the directional strength behind a Meeting Lines setup.
- RSI Strategy: For bullish setups, RSI should cross above 50. For bearish setups, RSI should turn down below 50.
- MACD Strategy: Use MACD (12, 26, 9). Look for a fresh crossover in the direction of the reversal.
- Execution Tip: Don’t rely on indicators alone. Use them to confirm structure, not override it.
5. Fibonacci Retracement Strategy
When the Meeting Lines form at a key retracement level, it increases the setup’s significance.
- How it Works: Map out the previous leg using the Fibonacci tool. Look for the pattern to form at 0.382, 0.5, or 0.618 zones.
- Why it Works: These are natural bounce zones in trending markets.
- Execution Tip: Confluence is critical. Don’t trade a fib level without supporting structure or confirmation.
We rotate through these trading methods based on the chart environment. No single method works in all conditions.
What Is The Success Rate Of The Meeting Lines Candlestick Pattern?
The success rate (also called hit rate or win rate) of the Meeting Lines candlestick pattern typically ranges between 60% and 66% according to Bulkowski. It is not the highest-probability setup by itself, but with structure and volume alignment, it becomes significantly more accurate. Our own Trading logs confirm these numbers.
Several key factors influence the success rate of the Meeting Lines candlestick pattern. First, market structure matters. The pattern is more reliable after clean trending moves and tends to fail in sideways or congested conditions. Volume also plays a critical role. High volume on the second candle or the confirmation candle adds weight to the setup and signals genuine market participation.
Timeframe selection is equally important. The pattern performs better on higher timeframes such as the four-hour or daily charts, where price action is cleaner and less affected by noise. Finally, the more accurately the two candles close at the same level, the stronger the signal.
Is the Meeting Lines Candlestick Pattern Suitable For Beginners?
Yes, the Meeting Lines candlestick pattern is suitable for beginners. The pattern has a simple two-candle structure that makes it easy to spot. Beginners can visually recognize the matching closes without memorizing complex formations.
(Learn To Trade And Read Candlestick Patterns Like A Pro)
What Are The Pros And Cons Of the Meeting Lines Pattern?
Pros
- Easy to recognize with only two candles
- Works well on higher timeframes like 4H and Daily
- Compatible with common confirmation indicators
- Offers clear stop-loss and entry logic
Cons
- Can be misread as a continuation or fake reversal
- Weak when used without structure or volume
- Lower accuracy in sideways or noisy markets
What Are The Advantages Of The Meeting Lines Pattern?
The Meeting Lines pattern stands out for its simplicity, early reversal potential, and compatibility with confirmation tools. See more details below:
- Easy to Recognize with Only Two Candles: The pattern uses just two candles, making it simple to identify. This makes it beginner-friendly and efficient for scanning multiple charts.
- Works Well on Higher Timeframes: On 4H and Daily charts, the Meeting Lines pattern filters out noise and prints cleaner setups. These timeframes carry more institutional order flow, which makes reversal signals from this pattern more reliable.
- Compatible with Confirmation Indicators: This pattern plays well with RSI, MACD, volume spikes, and trendline breaks. These tools help confirm the strength behind the setup and filter out weaker signals.
- Clear Stop-Loss and Entry Logic: Entry is placed after the second candle closes. Stop-loss is logically positioned beyond the candle’s high or low. This creates a clean, rule-based setup that supports risk control and planning.
What Are The Disadvantages Of The Meeting Lines Pattern?
While the Meeting Lines pattern has practical uses, it also has limitations. Its reliability depends heavily on context, and beginners often misinterpret its structure.
- Can Be Misread as a Continuation or Fake Reversal: Many traders see the pattern and assume it guarantees a reversal. Without understanding the trend or structure, they may enter too early or against momentum.
- Weak When Used Without Structure or Volume: The pattern loses effectiveness when it forms in the middle of a range or with low volume. It must appear in meaningful zones to carry weight.
- Lower Accuracy in Sideways or Noisy Markets: In choppy or consolidating conditions, the pattern creates more false signals. That’s why we avoid using it without trend confirmation.
Can The Meeting Lines Have Failure Signals?
Yes, the Meeting Lines pattern can fail when:
- It appears in sideways markets with no clear trend.
- There’s no volume confirmation or the setup forms outside of support/resistance zones.
- The second candle closes weakly or with long, indecisive wicks.
- The pattern is traded without waiting for candle closes or validation from follow-through price action.
We treat the Meeting Lines pattern as a signal, not a trigger. Until it aligns with broader context (trend structure, key levels, or momentum), it’s not tradable.
Which Indicators Can Be Combined With The Meeting Lines To Increase Its Success?
You can combine the Meeting Lines Pattern with the following indicators:
| Indicator | Settings | How to Use It With the Meeting Lines Pattern |
|---|---|---|
| RSI | 14-period | Look for RSI moving above 50 in bullish setups and below 50 in bearish setups after the pattern forms. RSI divergence against price strengthens the reversal signal. |
| MACD | 12, 26, 2009 | Watch for a MACD crossover in the direction of the pattern. For bullish setups, the crossover below the zero line is more reliable. For bearish setups, favor crossovers above zero. |
| Volume | Simple Volume or Session Volume Profile | Look for volume spikes during or right after the Meeting Lines pattern. Rising volume confirms that significant market participants are stepping in. Low volume reduces reliability. |
| Fibonacci Retracement Levels | 0.382 / 0.5 / 0.618 | When the Meeting Lines form at a Fibonacci retracement zone within a trend, the reversal chance improves. Use with RSI or MACD for added confluence and confidence. |
Using one or more of these indicators can add validation to the Meeting Lines signal.
(Learn To Trade And Read Candlestick Patterns Like A Pro)
What Are Similar Patterns To The Meeting Lines Pattern?
Several candlestick patterns share similar visual structure or reversal implications with the Meeting Lines pattern. Below are a few worth knowing:
- Piercing Pattern: This is a bullish reversal pattern where the second green candle closes above the midpoint of the prior red candle. It is a stronger reversal signal than Meeting Lines.
- Dark Cloud Cover: it is the bearish counterpart of the Piercing Pattern. The red candle closes deep into the green candle’s body. It signals a bearish reversal.
- On Neck Pattern: Similar to Meeting Lines but with the second candle closing exactly at the previous candle’s close, not near it. It is a slightly weaker continuation or pause signal.
- Thrusting Pattern: It is a bearish continuation pattern with a second green candle that closes below the midpoint of the first red candle. It is less aggressive than the Piercing pattern but stronger than the On Neck pattern.
To learn more about Candlestick Patterns, you can download our advanced Candlestick Pattern Cheat Sheet for free!
What Is The Opposite Pattern Of The Meeting Lines?
The opposite pattern of the Meeting Lines is the Separating Lines pattern. While Meeting Lines signal a potential reversal, Separating Lines confirm continuation. In a bullish Separating Lines pattern, the second green candle opens at the same price as the previous red candle’s open, but pushes higher to reinforce the trend. The logic and psychology are completely reversed: instead of a momentum pause, Separating Lines confirm follow-through strength.
What Is The Difference Between The Meeting Lines And The Separating Lines Pattern?
While they may look similar at first glance, the Meeting Lines and Separating Lines patterns serve completely opposite purposes on the chart.
| Feature | Meeting Lines | Separating Lines |
|---|---|---|
| Signal Type | Reversal | Continuation |
| Candle Relationship | Same closing price | Same opening price |
| Market Psychology | Momentum is weakening | Momentum is continuing strongly |
| Best Use | At reversal zones | During trend continuation |
We never confuse the two. One warns that buyers or sellers are losing steam, the other confirms they’re still in control.
What Is The Difference Between The Meeting Lines And The Kicker Pattern?
The Kicker pattern is far more aggressive and forceful than the Meeting Lines. While the Meeting Lines show hesitation or balance, the Kicker shows complete momentum rejection.
Unlike the Meeting Lines setup where the second candle gaps in the direction of the previous trend and trades in to close at the same level with the first candle, the second candle of the bearish kicker gaps away from the first on the side of the momentum revesal and continues forcefully in that opposite direction, usually ignoring the prior candle’s body altogether.
There’s no meeting of the closes. Instead, the shift is immediate and violent, often following major news or sentiment change. We use the Kicker as a high-conviction reversal pattern, while the Meeting Lines are treated as a warning or potential turning point.
What Are The Limitations Of The Meeting Lines Pattern?
Traders must understand the limits of this pattern to avoid poor trades.
- It relies on Precise Candle Closes: Whenever the second candle doesn’t close near the first candle’s close, the pattern loses meaning.
- It is Not Effective in Ranges: The pattern performs poorly in sideways markets or mid-range zones without trend context.
- It is Weak Without Confirmation: It requires volume, structure, or indicator support to validate the signal.
- It is Easily Misinterpreted by Beginners: Its visual similarity to other patterns can lead to confusion without education.
- It Doesn’t Work as a Standalone Signal: This is a signal, not a system. Success depends on combining it with a broader strategy.
Learn Pattern Trading With The WR Trading Mentoring
Whether you’re a beginner or experienced trader, our mentoring at WR Trading helps turn textbook patterns like the Meeting Lines into high-probability trades. We break it down with live examples, provide direct feedback, and offer a system built on consistency. Anyone can spot a Meeting Lines setup. We’ll show you how to trade it with purpose.
(Learn To Trade And Read Candlestick Patterns Like A Pro)
Conclusion: Trade the Meeting Lines Pattern With Purpose
The Meeting Lines candlestick pattern is a clean, two-candle formation that offers valuable insight into momentum shifts. It can signal a potential reversal of a trend, with buyers or sellers stepping in just enough to match the previous close, but it’s not a standalone entry. The context in which the pattern forms matters.
Trade the Meeting Lines pattern with purpose by entering long above the second candle’s high for bullish signals or below its low for bearish signals. Set stop loss below the pattern’s low for long trades and above its high for short trades, striking a balance between risk management and potential reward.
From our experience at WR Trading, the pattern performs best on 4H and Daily charts. We recommend using the Meeting Lines as part of a structured trading plan and not as a quick-reaction signal. Wait for confirmation, let the setup be complete, and never ignore risk.