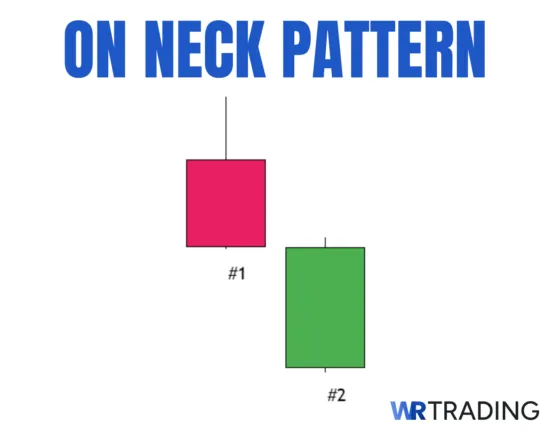
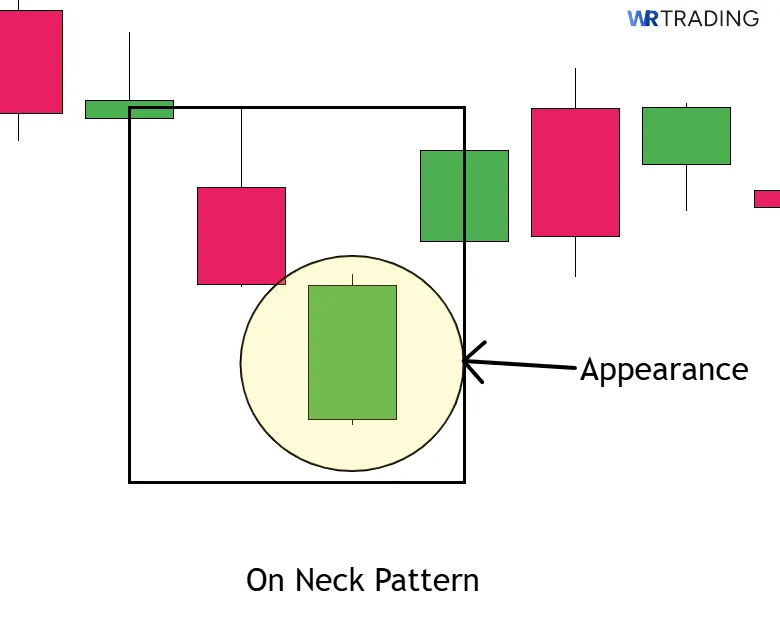
The On Neck candlestick pattern is a two-candle bearish continuation signal that appears in a downtrend. It forms when a long red candle is followed by a smaller green candle that opens below the previous close but finishes almost exactly at the same level. The second candle’s inability to push higher or close into the prior range shows a lack of buying power. This failure to follow through signals that sellers are still in control and the pattern often leads to continued downside movement.
The pattern reflects hesitation, not a reversal as buyers attempt to stabilize the drop but stall at a critical level, allowing sellers to resume control. Traders use the On Neck pattern to enter short positions during a downtrend once the second candle confirms that buyers have failed to reverse the pressure. The setup often acts as a signal to stay with the dominant trend rather than anticipating a bounce.
The main benefits of the On Neck are: Confirms bearish continuation without relying on complex patterns, is easy to recognize with a simple two-candle formation, and performs consistently when used with confirmation tools.
We’ve tested the On Neck pattern across multiple timeframes and found that it works best when paired with technical analysis and a good strategy. This guide walks you through exactly how to identify, interpret, and trade it with structure.
Key Facts About The On Neck Candlestick Pattern:
- Type of Pattern: Two-candle bearish continuation pattern.
- Construction Characteristics:
- Candle 1: A large red candle that closes near its low and reflects strong selling pressure.
- Candle 2: A smaller green candle that opens below the red candle’s close and finishes near or at the same closing price, creating a rejection of recovery.
- Trend Prior to Pattern: The On Neck pattern must appear after a consistent bearish trend. Without a clear downtrend already in place, the pattern loses its meaning and reliability.
- Trade Forecast: The price is expected to continue downward, with selling pressure resuming shortly after the pattern completes. The green candle fails to create a reversal, and new lows often follow if the volume or confirmation tools align.
- Interpretation: The pattern shows hesitation in the bounce. Buyers attempt to stop the decline, but the second candle closes too weak to shift control, showing that sellers still dominate the market.
- Stop-Loss Placement: Stop-loss is placed above the high of the second candle. This protects against false continuation signals and defines risk based on the most recent failure point.
- Opposite Pattern: In Neck
- Success Rate: 56%
(Learn To Trade And Read Candlestick Patterns Like A Pro)
How Does an On Neck Candlestick Pattern Form?
The On Neck pattern forms during a clear downtrend when sellers remain in control and buyers attempt to step in but fail to change the direction of the trend. The structure includes two candles: the first is a long red candle that represents strong bearish momentum, and the second is a smaller green candle that opens lower and closes near the previous close. This close at or near the first candle’s low is what defines the pattern, showing that despite the appearance of buying pressure, sellers have not lost control.
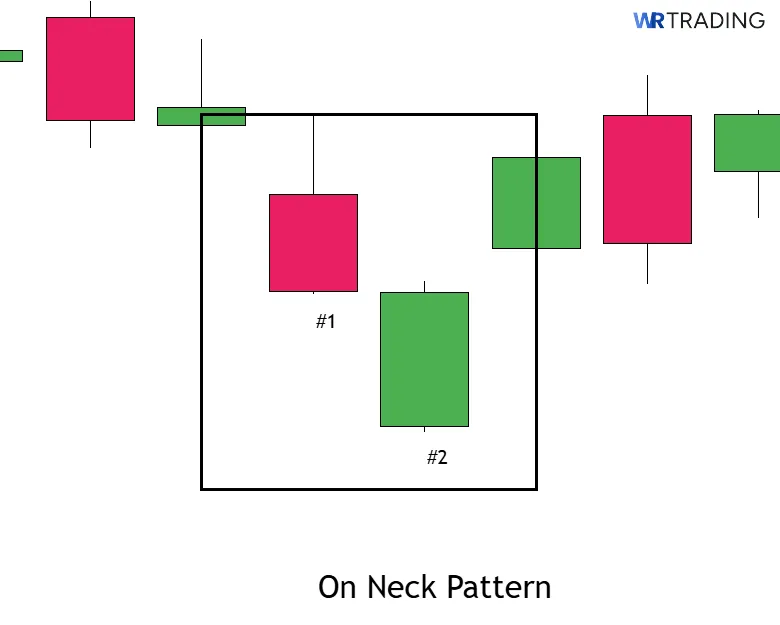
It does not require a third candle to complete the pattern, but many traders wait to see a red candle that follows the formation as confirmation. The pattern forms over 2 candlesticks and becomes more reliable when it develops in the middle of a downtrend rather than at the start or after a sharp exhaustion. It shows a continuation structure rather than a reversal and works best when the preceding trend shows consistent lower highs and lower lows.
Is The On Neck Candlestick Pattern Bullish Or Bearish?
The On Neck is a bearish pattern because it appears after a clear downtrend and reflects a failed attempt by buyers to reverse the direction, which strengthens the case for continued bearish pressure. Although the second candle is green, it does not represent a bullish signal because it lacks follow-through and stalls at the prior close, confirming seller control.
What Does the On Neck Candlestick Pattern Indicate?
The On Neck pattern shows that sellers remain dominant even after a temporary bounce. The long red candle shows strong selling momentum, while the second green candle suggests buyers are trying to stabilize the price. However, their effort fails to reclaim previous ground, and the candle closes near the prior low, offering no real shift in sentiment.
This formation reflects hesitation, not strength by buyers. Sellers see the pause as an opportunity to re-enter the market, driving the price lower in the next few candlesticks. The pattern signals that momentum is still on the side of the bears, and any recovery attempt lacks the conviction needed to reverse the trend.
Where does the name of the Pattern On Neck Come From?
The name “On Neck” comes from the way the second candle’s close aligns closely with the closing price of the first candle. Instead of piercing into the previous body, the second bar stops at the “neckline,” indicating that buyers failed to lift the price past that key point. This alignment visually defines the pattern and represents the rejection of bullish follow-through.
(Learn To Trade And Read Candlestick Patterns Like A Pro)
Example of the On Neck Pattern in the Chart
Below you will find the perfect Example of an One Neck Pattern spotting in the Chart.
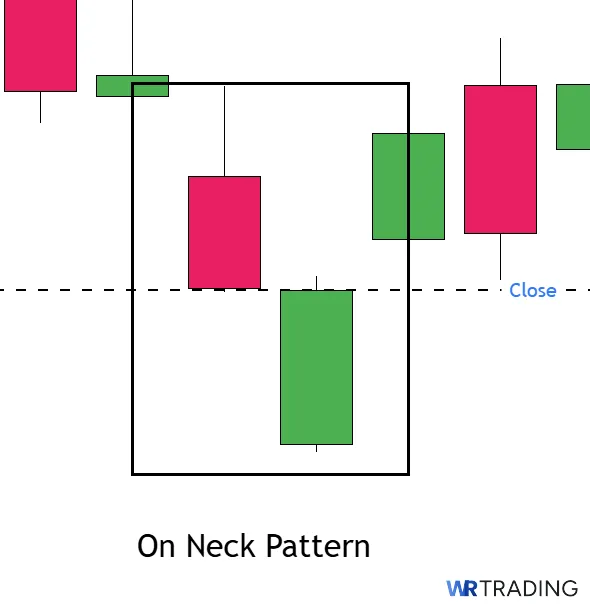
As you can see in the Example, the firs Candle of the On Neck Candlestick Pattern is a large red Candle and closes at 94.22 USD at the Amazon Stock. The second Candle opens with a Gap Down below, but closes at 94.22 USD, which is the Close of the previous Candle.
How Can You Identify an On Neck Candle in the Chart?
To identify the On Neck pattern, begin by scanning for clean downtrends with strong red candles that show selling momentum. You are looking for a sequence where a large red candle is followed by a green candle that opens below the red candle’s close but finishes near or at the same closing level. The second candle should not recover into the red candle’s body or suggest a reversal and its close must remain tight to the first candle’s low.
The pattern loses its meaning in sideways markets or if the green candle closes too high, which would imply potential recovery rather than failure. Look for it in areas where the price has already made a sustained move downward, where lower highs and lower lows have formed clearly. Confirmation may follow through the next candle, but the signal relies on the two-bar interaction and the failure to reverse pressure.
How to Trade the On Neck Candlestick Pattern – Tutorial
Trading the On Neck pattern requires more than recognizing its two candles since you must understand where it forms, what pressure is building behind it, and how the price responds when that pressure resumes. This section breaks down every aspect needed to trade the On Neck pattern:
- Find the Right On Neck Candlestick Pattern Setup
- Wait for the Appearance of the On Neck Candle
- Open Your Trade – Entry Point
- Wait For A Confirmation Or Not
- Choose Your Trading Take Profit
(Learn To Trade And Read Candlestick Patterns Like A Pro)
1. Find the Right On Neck Candlestick Pattern Setup
The On Neck pattern gains value when it forms after a clear bearish leg where the price has already made a strong push downward. You want to see a clean structure that includes a sequence of lower highs and lower lows, showing that the sellers have maintained control across multiple candlesticks. The more reliable versions of this setup occur when the pattern develops after a weak retracement, not at the start of a trend.
What makes the On Neck effective is the failed attempt by buyers to stop or reverse the decline. The first candle shows strong selling, and the second opens lower but closes flat against the previous candle’s close, showing that buyers could not force a meaningful change. This structure must form in the flow of a trend, not in isolation, and should be supported by previous failed support retests, recent breakdowns, or rejection from known resistance levels.
Ideal conditions for the On Neck pattern:
- The midpoint of a strong downtrend leg where the price briefly pauses but momentum remains intact.
- Below a failed support area that now acts as resistance, confirming earlier weakness.
- Inside a bearish continuation pattern such as a flag or tight channel that begins to break lower.
- During the second leg of a move, where the first impulse has already shifted sentiment.
2. Wait for the Appearance of the On Neck Candle
Once a strong red candle forms, the next piece of the setup depends on how the following candle behaves. The second green candle must open below the previous close and finish just beneath or directly at the same level. This behavior confirms that buyers stepped in briefly but could not drive the price higher, which signals that the pressure from sellers is still dominant.
A common mistake is treating the green candle as a bullish sign just because of its color. What matters is not the color but the structure. If the candle closes higher or pushes into the body of the red candle, the setup becomes invalid. You want to see failure in the recovery effort, with confirmation that buyers were unable to shift the short-term direction. Additional tools such as volume contraction or RSI weakness can reinforce that the setup reflects hesitation, not reversal.
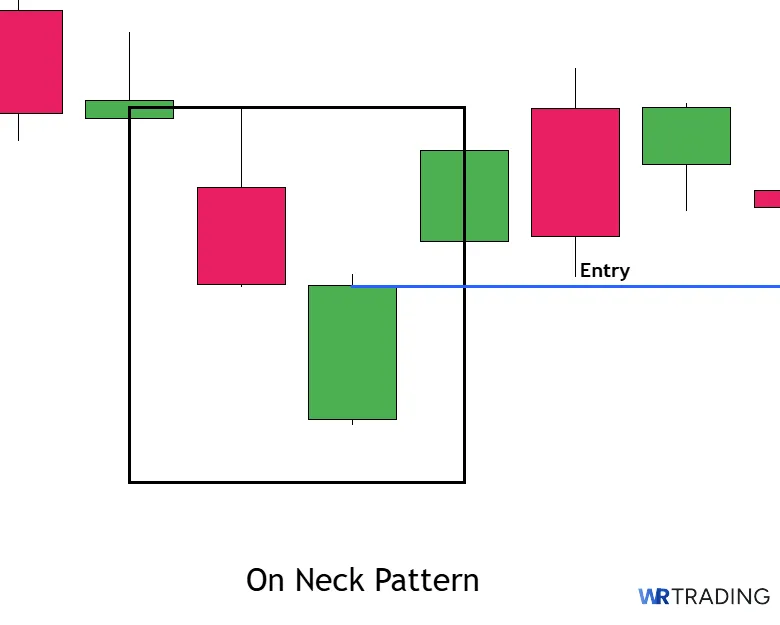
3. Open Your Trade – Entry Point
The trade should be entered only after the second candle has closed and the price begins to move below that candle’s low. This level marks the point where buyers failed to lift the market, and a break beneath it confirms that sellers are regaining control. The cleanest entry is placed just below the low of the green candle, which positions you on the side of the confirmed downtrend.
Your stop-loss should be placed just above the high of the second green candle. That level marks the top of the failed recovery and protects the trade from getting triggered by shallow retracements or random noise. If the price moves back above that high, the pattern has lost its integrity and the trade no longer fits the structure. Keeping your stop outside the range of the second candle allows the trade enough space to unfold without risking unnecessary early exits.
4. Wait For A Confirmation Or Not
Confirmation is not always required, but it reduces the chances of entering a false continuation. In fast-moving trends where the structure is clean and momentum favors the downside, a break below the second candle’s low may be enough to justify the entry. However, in uncertain conditions, waiting for a full candle close beneath that level offers more stability.
The need for confirmation depends on how well the pattern fits the larger environment. If the setup appears clean, the volume supports the direction, and other tools agree with the bearish view, early entry can offer better positioning. If there is doubt or the candles form near significant support, allowing one more candle to confirm the breakdown keeps you out of losing trades.
5. Choose Your Trading Take Profit
Exit planning should always reflect the structure and momentum surrounding the On Neck pattern. The first and most common target is the recent swing low when the On Neck forms after a weak retracement. If the price breaks through that level with strength, use tools such as measured move projections or range extensions to guide further targets.
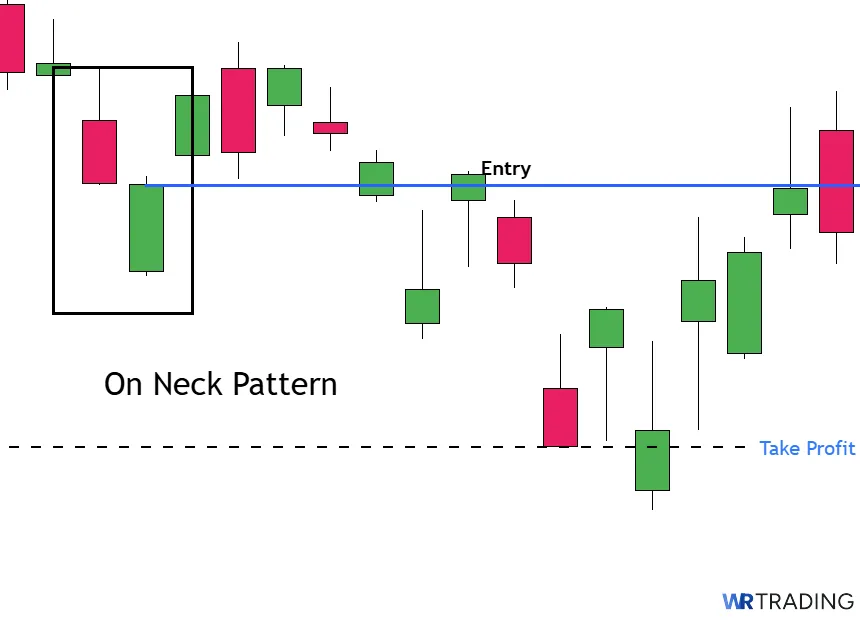
Exits must not be based on fixed distances, instead, use price behavior to make adjustments and watch for slowing momentum, reversal signals, or volume changes that suggest the move is losing strength. If the price continues to print lower highs and lower lows, the trend remains active, and you can consider trailing your stop or using a step-down method to secure profits while staying in the trade.
(Learn To Trade And Read Candlestick Patterns Like A Pro)
Which Strategies Can Be Used For The On Neck Candlestick Pattern?
When trading any pattern like the On Neck, you must have a strategy to keep consistency and know what criteria to follow before entering a trade. The following strategies are built to filter weak setups and focus only on those that appear with momentum, structure, or volume alignment. Each method works best when the market is already in motion and the pattern appears as part of a controlled pause.
Regardless of which strategy you use, the trade entry should be placed just below the low of the second candle. That level marks the breakdown point where buyers have clearly lost control. Your stop-loss should go above the second candle’s high, which is the invalidation zone in every strategy. These placements allow for structure-based trade management, reducing emotion and reinforcing the logic behind every decision.
- On Neck with Volume Indicators
- RSI Remaining Below 50 With No Momentum Shift
- Retest of Broken Support That Now Acts as Resistance
- MACD Weakness During and After the Pattern Completion
1. On Neck With Volume Indicators
The most reliable On Neck setups show a clear drop in volume during the second candle. This confirms that buyers attempted to respond to the first candle’s selling pressure, but there was no real momentum behind their efforts. The reduced volume shows hesitation and a lack of conviction, which supports the idea that the market is not ready to reverse. Watch for this drop in activity and wait until volume returns once the second candle’s low is broken.
When volume expands again during the next red candle, that movement confirms that selling pressure has resumed. This shift is a key part of timing the entry in this strategy, as it shows the failed bounce has transitioned into a fresh move lower. Combining price behavior with volume gives more clarity and helps avoid weak trades that form without any conviction behind them.
2. RSI Remaining Below 50 With No Momentum Shift
The strength of the trend must be confirmed by indicators that track momentum, and RSI is one of the most effective for this purpose. If the On Neck pattern appears while RSI remains under 50 and does not start to curl upward, it confirms that momentum is still with the sellers. The lack of any bullish divergence or momentum slowdown adds weight to the continuation structure.
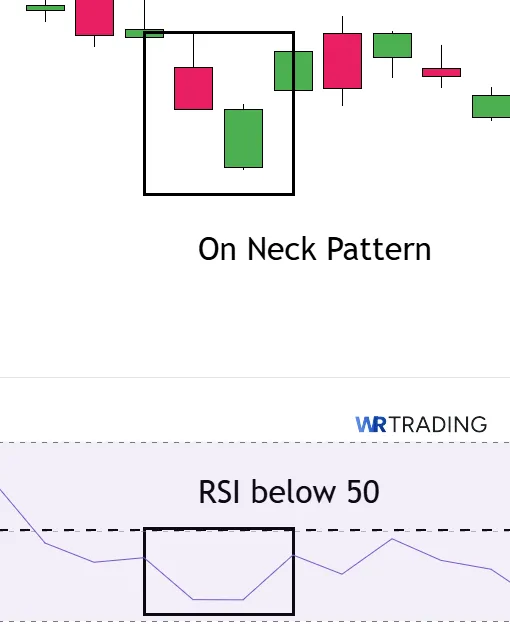
This filter becomes more effective when applied on the same timeframe where the pattern forms. Traders using this strategy should avoid setups where RSI begins to flatten or rise before the second candle finishes, as that signals a potential loss of pressure. When RSI stays weak, the pattern aligns with a full trend continuation structure and helps reduce the number of false or early trades.
3. Retest of Broken Support That Now Acts as Resistance
The On Neck often performs best when it appears just under a level that was previously support but has already been broken. This former support area now acts as resistance, and the second candle in the pattern fails to break back above it. The market tests this area, but no meaningful recovery happens, and the failed bounce shows that sellers are still controlling the flow of price.
This strategy is great because it combines structural rejection with the failure of the second candle to gain ground. The alignment between the rejected level and the flat close creates a stronger case for continuation. Once the price begins to break below the pattern, the trade is backed by both trend and structure, and the invalidation point is clearly defined above the second candle’s high.
4. MACD Weakness During and After the Pattern Completion
The MACD is useful for reading momentum shifts and can be applied alongside the On Neck pattern to improve trade success. When the MACD shows a crossover or histogram weakness during the pattern, it confirms that the bounce lacks energy and that bearish pressure is still active. These signals are best used as filters that guide decision-making once the price begins to break lower.
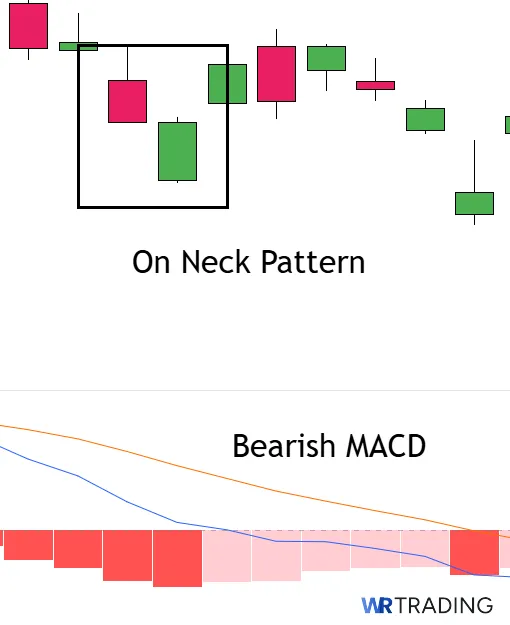
When applying this strategy, use MACD settings such as 12, 26, 9, which work well on most timeframes, and you should observe if the histogram contracts or the signal line flattens before the pattern finishes. When MACD is aligned with the price and structure, the setup becomes more reliable. This combination gives a broader view of momentum and helps filter out setups that look valid but lack the necessary pressure to follow through.
(Learn To Trade And Read Candlestick Patterns Like A Pro)
What Is The Success Rate Of The On Neck Candlestick Pattern?
According to Thomas Bulkowski’s research published on his site, the On Neck acts as a bearish continuation pattern 56% of the time. While this number is slightly above random, it does not offer a high level of statistical edge on its own.
In our experience, the pattern improves significantly when used within the right conditions. This includes confirmation from volume or momentum tools, trend alignment, and structure-based context such as resistance zones or failed breakouts. On its own, the On Neck can produce unreliable results.
However, with filters and used selectively, its success rate improves enough to justify its role in a broader bearish continuation strategy.
Is the On Neck Candlestick Pattern Suitable For Beginners?
Yes, the On Neck pattern can be used by beginners, but only when applied with structure and supported by confirmation tools. Its two-candle layout is simple to recognize, which makes visual identification easy for those still learning how to read charts. However, relying on the pattern without understanding where it forms or how it fits into a trend can lead to poor decisions and inconsistent trades.
Beginners who want to use this pattern need to pair it with other tools such as support and resistance zones, volume behavior, or momentum indicators. This helps filter out weak setups and reinforces good habits around structured trading. Those still learning could apply for the WR Trading Mentoring, which would help improve trading skills and long-term success.
What Are the Pros and Cons of Trading the On Neck Candle Pattern?
The On Neck pattern offers a mix of benefits and limitations that make it highly dependent on where and how it’s used. It works well when trend conditions are clear and the structure supports bearish continuation, giving traders a precise entry and stop-loss without needing to overcomplicate the setup.
However, it lacks any built-in targets, relies heavily on outside confirmation, and often appears in locations that don’t support clean follow-through. Below is a closer look at the main strengths and weaknesses to be aware of before using this pattern as part of a trading strategy.
Pros
- Entry and stop-loss levels are clearly defined
- Confirms bearish continuation without delay
- Filters out false reversals in weak trends
- Fits well into structured strategies that use trend filters
- Reduces reliance on subjective interpretation
Cons
- Requires additional confirmation to be useful
- Does not project any price target or exit zone
- Can mislead new traders into taking early entries
- Fails easily during shallow trends or weak momentum
- No value in sideways or volatile markets
What Are The Advantages Of The On Neck Pattern?
The On Neck has several advantages like helping traders stay aligned with a downtrend, confirming failed bounces, and providing clean entry and stop-loss structure. Its two-candle layout simplifies decision-making in fast-moving markets and removes the need for second-guessing the signal. Here are the main advantages of this pattern when it’s used as part of a structured continuation setup.
- Entry and stop-loss levels are clearly defined: The low of the second green candle offers a logical trigger for entry, while the high provides a clean invalidation point. This helps eliminate indecision and creates disciplined trade planning. The structure reduces the need to guess where the price should move next.
- Confirms bearish continuation without delay: The second candle signals that buyers failed to build momentum, which supports the idea that sellers are still active. This helps traders stay with the trend rather than wait for further validation that may come too late. The failure of recovery becomes a usable signal instead of just a reaction.
- Filters out false reversals in weak trends: When the market attempts to bounce but stalls, the On Neck provides a visual confirmation that the move lacks strength. This helps avoid premature exits or chasing retracements that do not develop. It keeps the focus on trend direction instead of short-term noise.
- Fits well into structured strategies that use trend filters: The On Neck can be used alongside tools like moving averages, channel boundaries, or directional bias filters. When combined with a clean structure, it becomes easier to rule out weak setups.
- Reduces reliance on subjective interpretation: Since the pattern has a clear formation and criteria, it limits emotional decision-making. There is less room for overthinking when the candle sequence aligns with the trend structure. This consistency supports rule-based execution and tighter decision flow.
What Are The Disadvantages Of The On Neck Pattern?
The On Neck pattern has limitations that make it unreliable when used without structure, confirmation, or trend support. It offers no target projection, struggles in weak conditions, and often triggers entries in the wrong parts of the chart. Here are the main issues traders should consider before using this pattern in a live setup.
- Requires additional confirmation to be useful: Without tools like RSI, MACD, or volume analysis, the pattern does not provide enough conviction on its own. The two-candle sequence can appear during random moves that lack trend alignment. It becomes reliable only when combined with structural or technical filters.
- Does not project any price target or exit zone: Unlike measured patterns or formations with built-in extensions, the On Neck does not suggest where the price may move next. Traders must define their own targets based on structure, indicators, or previous lows. This adds more responsibility to the trade plan and increases complexity.
- Can mislead new traders into taking early entries: Many beginners see the pattern form and react too quickly without waiting for confirmation or understanding the location. When that happens, trades are entered too early and stops are hit without the price ever developing the intended move. The simplicity of the pattern can encourage overconfidence if not managed properly.
- Fails easily during shallow trends or weak momentum: When the broader trend is not clean, the On Neck’s structure may still appear, but the continuation fails to materialize. This is common during periods of low volatility or incomplete cycles. The breakdown lacks follow-through, which leads to losses even when the pattern looks correct.
- No value in sideways or volatile markets: The On Neck depends on a strong trend already being in place. In choppy or reactive environments, it provides no edge and may result in false signals that appear during random swings. It is not designed for environments without directional control.
Can the On Neck Pattern Have Failure Signals?
Yes, the On Neck can produce failure signals when the setup appears in the wrong context or without confirmation. These failures often happen when traders rely on the candle shape alone and ignore structure, trend strength, or momentum. Here are the most common reasons the On Neck pattern fails:
- The pattern appears inside a choppy range: When the On Neck forms in the middle of sideways price action, there is no directional pressure to support a continuation move. The failed recovery becomes meaningless because the trend is absent, and the signal gets lost in the noise.
- The second candle closes too far above the previous low: If the second green candle finishes well above the close of the first red candle, it loses the tight structure that gives the pattern its meaning. A higher close can suggest that buyers are regaining short-term control, which weakens the idea of a failed recovery. This makes the setup harder to trust and more prone to reversal.
- Strong bullish momentum before the pattern forms: When the candles leading up to the On Neck show increasing strength or rising volume on green bars, it signals that buyer pressure has been building. In those conditions, the appearance of a brief pause does not confirm bearish control. The pattern is more likely to fail because it appears against stronger sentiment.
- Volume increases during the second candle: A rise in volume during the green candle can indicate that buyers are more active than they appear. Instead of showing hesitation, the candle may show renewed demand. When volume expands on the bounce, the continuation signal becomes unreliable, and the risk of reversal increases sharply.
- Fails to trigger follow-through within a few candles: If the price does not begin to break lower within one or two candles after the On Neck completes, it signals hesitation. That delay is often a sign that the bounce wasn’t fully rejected or that sellers lack urgency. These setups tend to flatten or reverse, wasting time or triggering unnecessary stop-outs.
(Learn To Trade And Read Candlestick Patterns Like A Pro)
What Are The Best Trading Indicators To Be Combined With The On Neck Pattern?
The On Neck pattern is more reliable when paired with technical indicators that help confirm trend direction, momentum, or pressure. Since the pattern alone does not project targets or assess conviction, these tools provide the structure and evidence needed to avoid weak setups. The indicators below are commonly used by traders to validate the On Neck and time entries more precisely.
- Relative Strength Index (RSI): RSI helps confirm if momentum still favors the sellers after the On Neck forms. When the RSI remains below 50 during the pattern and shows no sign of bullish divergence, the structure is more likely to produce a valid continuation. Using standard settings of 14 periods on the same timeframe as the pattern gives a clear read on whether pressure has truly shifted or if buyers are gaining strength.
- MACD (Moving Average Convergence Divergence): MACD provides a deeper view of trend momentum when the histogram or line crossover supports the pattern. If a bearish crossover occurs during or just after the pattern, it confirms that momentum is aligned with the short setup. Settings of 12, 26, 9 work well for most timeframes, and the signal becomes stronger when MACD starts to accelerate away from the zero line.
- Volume Analysis: Volume is one of the most important tools to validate the On Neck because it confirms the level of participation during the bounce and breakdown. A drop in volume during the second candle shows weak buying pressure, while a surge on the breakout confirms seller control. Watching for this shift between contraction and expansion helps time the entry with more conviction and avoid false triggers.
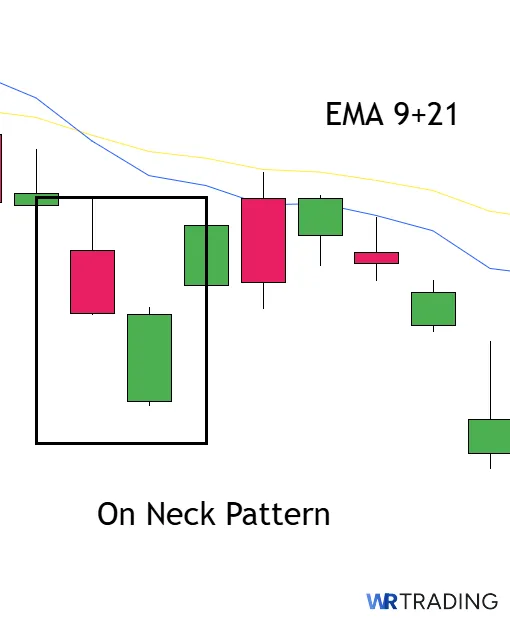
- Exponential Moving Averages (EMA): Fast EMAs like the 9 and 21 help confirm short-term trend direction and can act as dynamic resistance during the pattern. If the On Neck forms below a falling EMA, and the second candle fails to close above it, that adds structure to the rejection. The breakdown becomes more reliable when it aligns with moving average pressure, especially in trending conditions.
- Fibonacci Retracement Levels: When the On Neck pattern forms near a 38.2% or 50% retracement of a previous leg down, the likelihood of continuation increases. These levels act as resistance during weak bounces, and the pattern reinforces that sellers are defending the area. Combining Fibonacci with the pattern helps define trade location and gives additional structure to the setup.
What Are Alternatives Patterns To The On Neck Pattern?
Since you’re already studying the On Neck pattern, it may also be worth learning a few related structures that behave in similar ways. Some of these patterns share the same continuation signals, while others highlight failed momentum or early signs of a shift. Understanding them can help you recognize different forms of selling pressure and avoid relying on just one pattern. Below are the closest comparisons and what each pattern is most useful for:
| Pattern Name | Main Characteristics | Best Use Case |
|---|---|---|
| Bearish Breakaway | Five-candle reversal structure starting with strength and ending with a breakdown. | Best for spotting a shift from bullish to bearish trend early in its formation |
| Dark Cloud Cover | A strong red candle that opens above and closes deep into the prior green candle. | Best for identifying the first sign of selling pressure after an extended rally |
| Matching Low | Two candles that close at or near the same level, often showing support. | Best for spotting where a bearish move is losing momentum or finding temporary support |
| Bearish Separating Lines | The green candle fails to reverse the prior red candle, maintaining the trend. | Best for confirming that short-term recovery has failed and the trend remains intact. |
| Bearish Thrusting | Green candle that closes deeper into the prior red candle without fully reversing it | Best for reinforcing trend continuation when buyers cannot gain enough pressure. |
See more candlestick patterns in the WR Trading Candlestick Bible PDF.
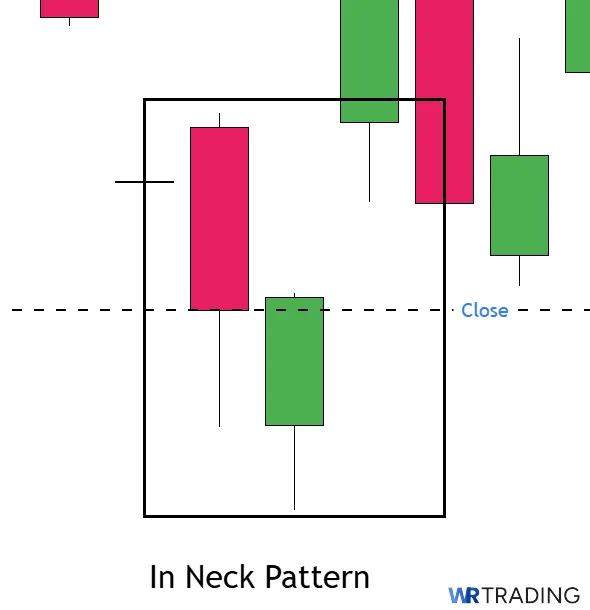
What Is The Opposite Pattern Of The On Neck?
The opposite of the On Neck pattern is the In Neck candlestick pattern, which signals a brief loss of momentum within a downtrend but carries a different outcome. The On Neck shows a failed bounce that closes near the prior candle’s low without entering its range. However, the In Neck closes slightly inside that body, showing a stronger buying response that can slow the trend temporarily. This small difference in closing level shifts the meaning of the pattern from firm continuation to short-term hesitation.
What Are The Limitations Of The On Neck?
The On Neck pattern can offer value in trend-based strategies, but it also has limitations that traders must recognize before relying on it consistently. Most of these issues come from treating the pattern as a complete signal rather than a small part of a broader setup.
It lacks projection, requires confirmation, and often appears in areas where the market isn’t ready to follow through. Here are the key limitations:
- Appears frequently in low-quality locations without trend or structure.
- Offers no built-in targets or exit logic for trade planning.
- Easy to confuse with similar patterns that signal hesitation rather than continuation.
- Fails often when trend strength or volume is missing.
- Requires external indicators to assess strength and pressure.
- Looks bullish to inexperienced traders, leading to wrong-side trades.
Learn Pattern Trading With the WR Trading Mentoring
Trading patterns like the On Neck becomes much more effective when they’re used as part of a complete trading plan that includes structure, confirmation, and trade management. That’s exactly what we teach through WR Trading Mentoring. The program focuses on applying patterns in the right context, filtering out weak signals, and building repeatable setups that work across different markets.
You’ll learn how to recognize when a pattern is actionable, where it fits within market structure, and how to combine it with tools that strengthen your decision-making. Every concept is backed by real chart examples and guided instruction that removes the uncertainty around entries, exits, and trade follow-through.
Through structured lessons and live feedback, you’ll learn how to trade patterns like the On Neck with long-term success, consider joining now.
(Learn To Trade And Read Candlestick Patterns Like A Pro)
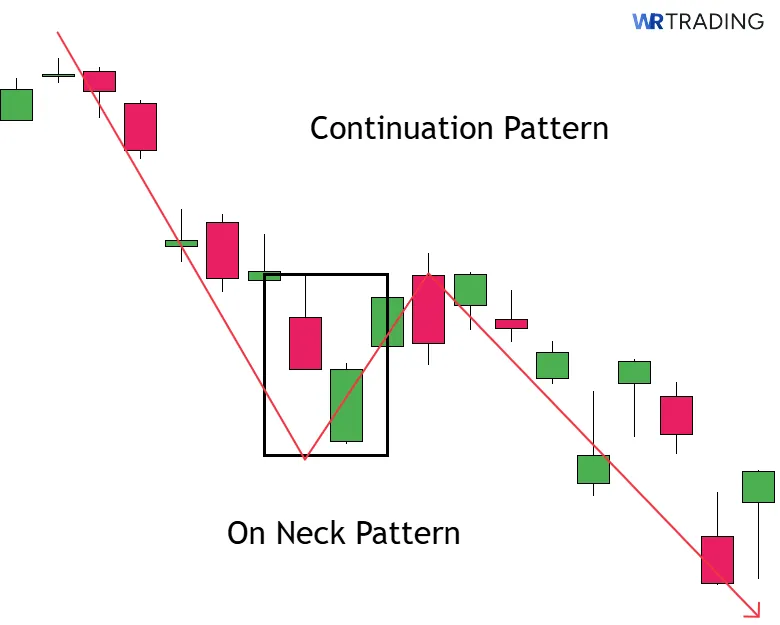
Conclusion: The On Neck Is a Continuation Pattern That Depends on Technical Analysis
To summarize, we’ve covered how the On Neck pattern forms, what it signals, and how traders can use it as part of a structured continuation setup. The pattern highlights a failed bounce inside a downtrend, where buyers are unable to regain control and the trend remains intact. It gives a clear entry trigger just below the second candle’s low, with a logical stop above the high, and it becomes far more reliable when paired with confirmation tools like RSI, volume shifts, or structural rejection.
Based on our experience, this pattern works best when the price is already trending lower and the On Neck forms just beneath a level that buyers have failed to reclaim. It should not be used in sideways markets or without context, as those conditions produce weak follow-through and frequent invalidations. Traders who treat this pattern as part of a larger strategy, rather than relying on it alone, will find that it delivers clean continuation setups with clearly defined risk.
FAQs: Most Asked Questions on the On Neck Pattern
Can the On Neck Pattern Be Used in Automated Trading Strategies?
Yes, the On Neck pattern can be coded into automated trading bots if the conditions are clearly defined. However, without proper filters for trend direction, volume, and confirmation, the results may be inconsistent. Automation should include structure-based logic to avoid false signals.
Can the On Neck Pattern Be Traded During News Events?
It’s not recommended to trade the On Neck during major news events due to volatility spikes. News can override technical signals and cause sharp reversals or invalidations. Pattern-based trades should be avoided when the price is likely to react unpredictably.
What Are Common Mistakes When Using the On Neck Pattern?
One common mistake is entering too early without waiting for the price to break below the second candle’s low. Another is using the pattern in sideways markets or near strong support levels. Misreading structure or ignoring volume often leads to failed trades.
Does Candle Size Matter in the On Neck Pattern?
Yes, size and proportion are important to confirm pressure and rejection. The first red candle should show strong selling, and the second green candle should be small with limited recovery. A large second green candle weakens the message and may change the interpretation entirely.
What Is the Best Way to Filter Out Weak On Neck Patterns?
Use structure, volume, and momentum tools to confirm that the market is aligned with continuation. Avoid setups that form near key support or when volume drops off during the breakdown. Clear pressure and clean price action improve the quality of the signal.
Should the On Neck Pattern Be Backtested Before Using Live?
Yes, backtesting helps you understand how the pattern behaves under different market conditions. It also reveals how often false signals occur and which filters improve results. A well-tested pattern is more likely to produce confidence and consistency in live trading.