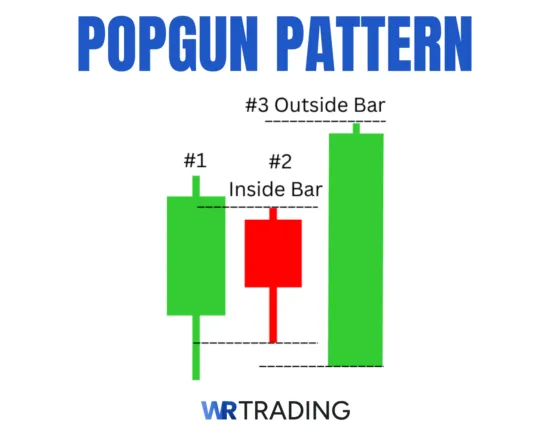
The Popgun candlestick pattern is an ultra-rare three-candle setup that signals a pending expansion in volatility after a brief pause in price action. It begins with a wide range candle, followed by a smaller inside candle that stays completely within the range of the first. The third candle breaks outside that range, either above or below, and closes beyond one of those boundaries.
The pattern is neutral as it does not predict direction until the breakout happens. If the third candle closes higher, it signals a bullish breakout. If it breaks lower and closes weak, it confirms a bearish shift. Traders apply the Popgun pattern to catch breakouts that follow compression, using it to enter just as volatility returns and momentum picks a side.
Our guide explains how the Popgun pattern forms, how to recognize it in real markets, and how to trade it using a clear, structured approach. We tested its strategies, failure signals, and every other aspect needed to trade it correctly.
Key Facts About the Popgun Candlestick Pattern:
- Type of Pattern: Three-candle volatility pattern
- Construction:
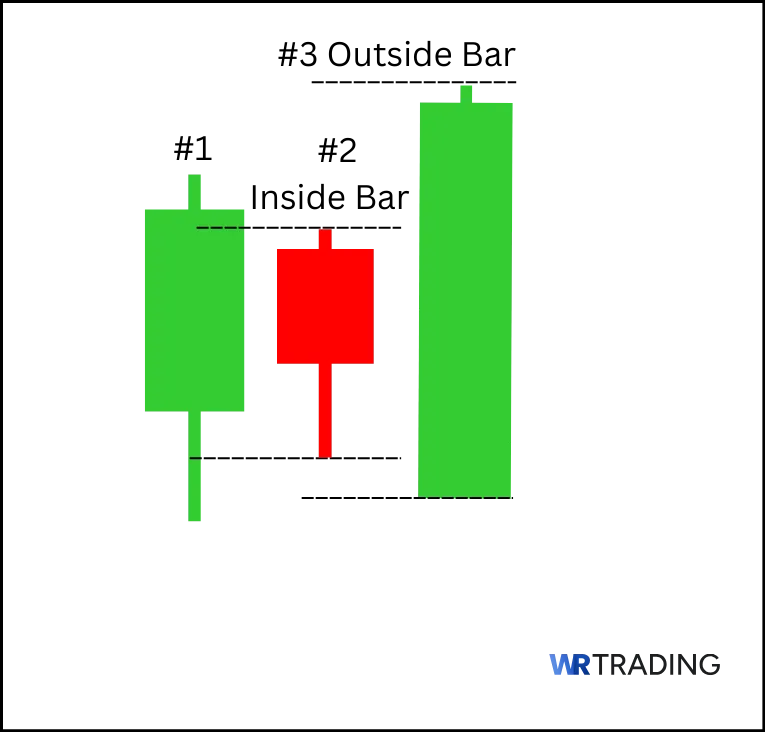
- Candle 1: Any regular bar that defines the initial range.
- Candle 2: Inside bar that trades entirely within the high and low of Candle 1.
- Candle 3: Outside bar that breaks above the high and below the low of Candle 2, closing with clear momentum in one direction.
- Forecast: Anticipates a breakout as range expansion overrides the prior pause.
- Trend Prior to Pattern: Appears during a pullback or just after a sideways drift inside a
- larger trend.
- Opposite Pattern: Inside bar
- Stop Loss Placement: Placed a few ticks beyond the extreme of Candle 3 to protect against a quick reversal.
- Candlestick Success Rate: No reliable information on the success rate of the Popgun
(Learn To Trade And Read Candlestick Patterns Like A Pro)
How Does a Popgun Candlestick Pattern Form?
The Popgun pattern forms across three candles. The first candle creates a clear range between its high and low. The second candle trades completely inside that range, showing reduced volatility and limited interest from either side. The third candle breaks beyond both ends of the inside bar and closes outside that range, confirming a breakout in one direction.
It forms on any timeframe, but the most reliable signals appear from our experience on the 4h and daily charts. On a 4h chart, the full pattern takes 12h to complete. On a daily chart, it forms over three trading days. The smaller the timeframe, the more likely the setup will include noise or false signals, so higher timeframes tend to offer stronger outcomes.
Popgun setups form during consolidations, short pauses in a trend, or after a stretch of volatility has faded. They can appear after strong directional moves or in the middle of tight trading ranges. In all cases, the pattern reflects a shift in volatility, first narrowing, then breaking cleanly. The third candle confirms which side has taken control and completes the structure.
What Does the Popgun Candlestick Pattern Mean?
The Popgun pattern shows a change from low volatility to high volatility. It captures a moment where the market contracts, hesitates, then breaks decisively. The second candle signals that momentum has paused and the range has tightened. The breakout that follows is what gives the pattern its meaning. It shows that one side of the market has regained control and that a larger move may be beginning.
When the price closes above the inside candle’s high, it confirms buyers have pushed through resistance. That kind of breakout signals strength and often leads to follow-through in the same direction. A close below the inside candle’s low shows sellers have taken control, and momentum is shifting downward. Both versions of the pattern mark the end of a quiet period and the beginning of a strong push.
The psychology behind the Popgun shows the inside candle traps the price in a narrow range, creating uncertainty or a buildup of pressure. The outside breakout is the release, and traders step in once the breakout is confirmed, positioning in the direction of the move. Since it happens after a pause, the momentum behind it tends to be sharp and immediate.
Where does the name of the Pattern Popgun Come From?
The name “Popgun” comes from the sudden burst of movement that follows the pattern’s tight, low-volatility setup. Just like a popgun builds pressure before releasing a quick shot, this candlestick sequence compresses the price before triggering a sharp breakout. The pattern’s name reflects the release of energy after a period of silence on the chart, just like a popgun.
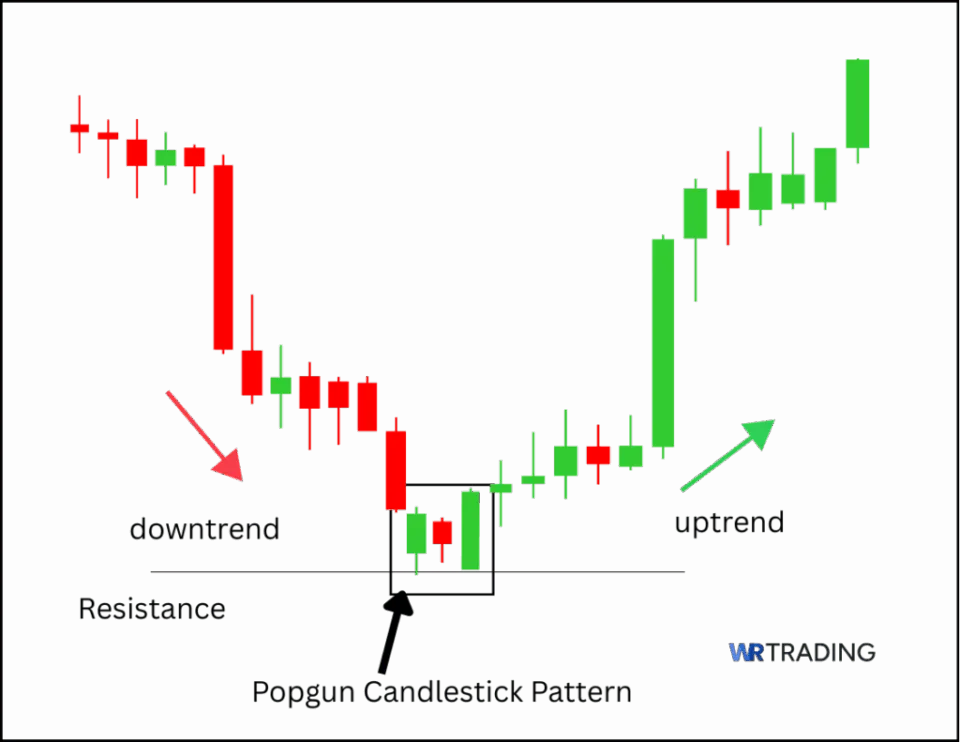
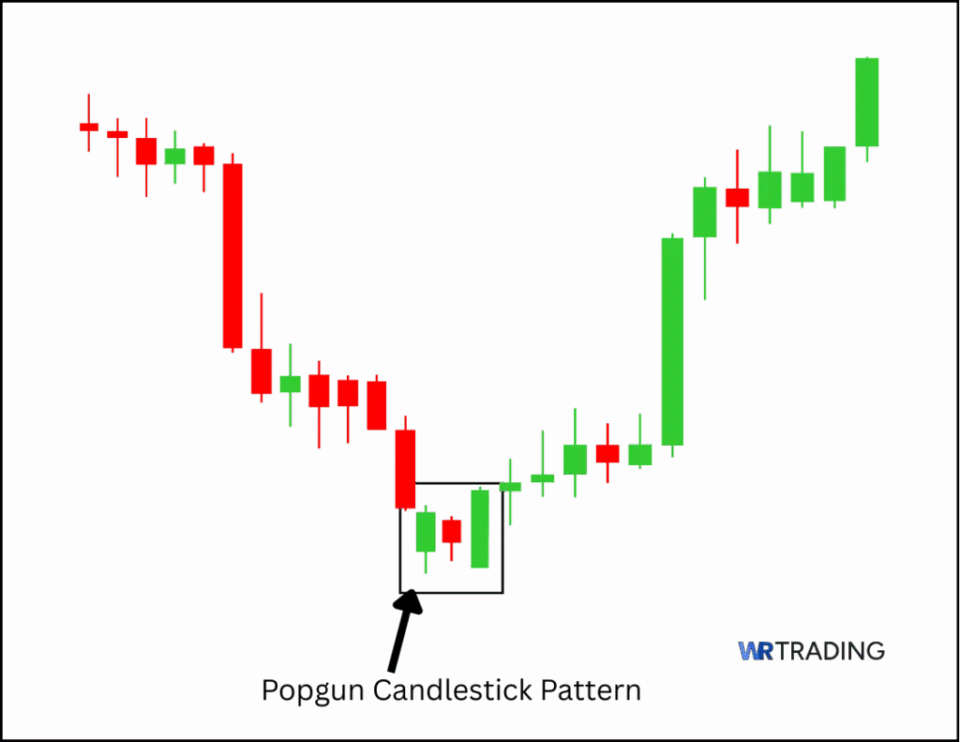
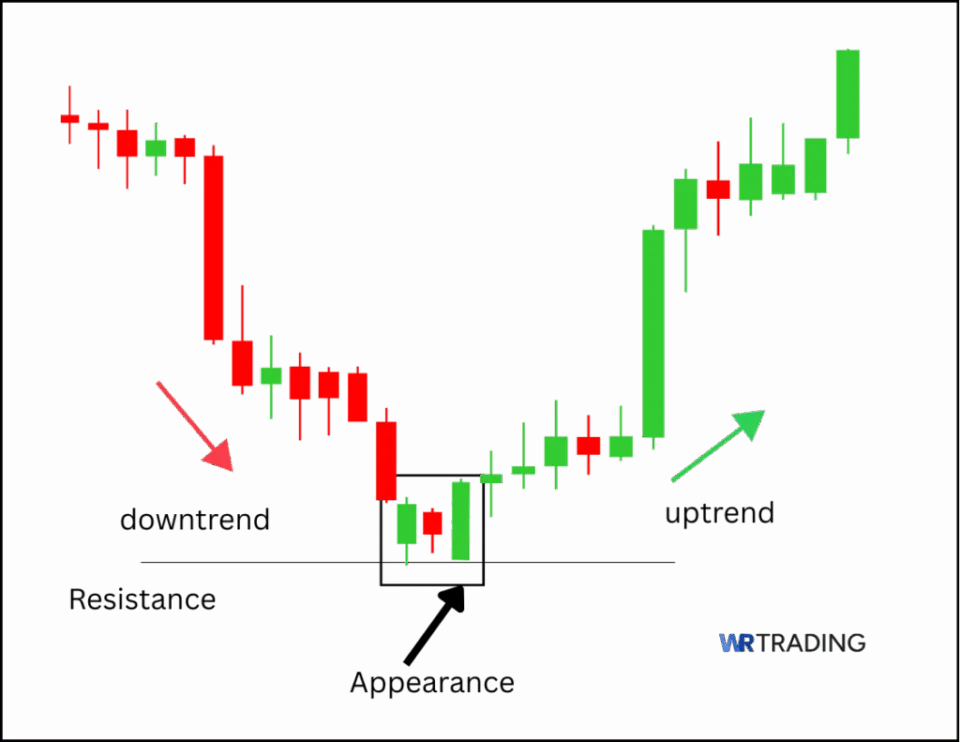
Example of the Popgun Pattern in the Chart
(Learn To Trade And Read Candlestick Patterns Like A Pro)
How to Identify a Popgun Candle in the Chart?
To identify a Popgun pattern, begin by scanning the chart for a clear contraction in price movement. The first candle must have a defined high and low that stands out against the recent bars. The second candle must be fully contained within that range. Its high cannot exceed the high of the first candle, and its low must stay above the low of the first. This inside candle signals that the price has temporarily compressed.
Once that inside bar forms, shift your focus to the next candle. To complete the pattern, the third candle must break both the high and the low of the inside bar. The breakout direction determines the meaning. A close above the inside bar confirms a bullish signal. A close below confirms a bearish one.
Without a full breakout, the pattern is incomplete and should be ignored.
How to Trade the Popgun Candlestick Pattern
Trading the Popgun pattern is about reacting to volatility expansion at the right moment. The aim is to read the pressure buildup, then position with the breakout. This section breaks down how to:
- Find the Right Popgun Candlestick Pattern Setup
- Wait for the Appearance of the Popgun Candle
- Open Your Trade – Entry Point
- Wait For A Confirmation Or Not
- Choose Your Trading Take Profit
1. Find the Right Popgun Candlestick Pattern Setup
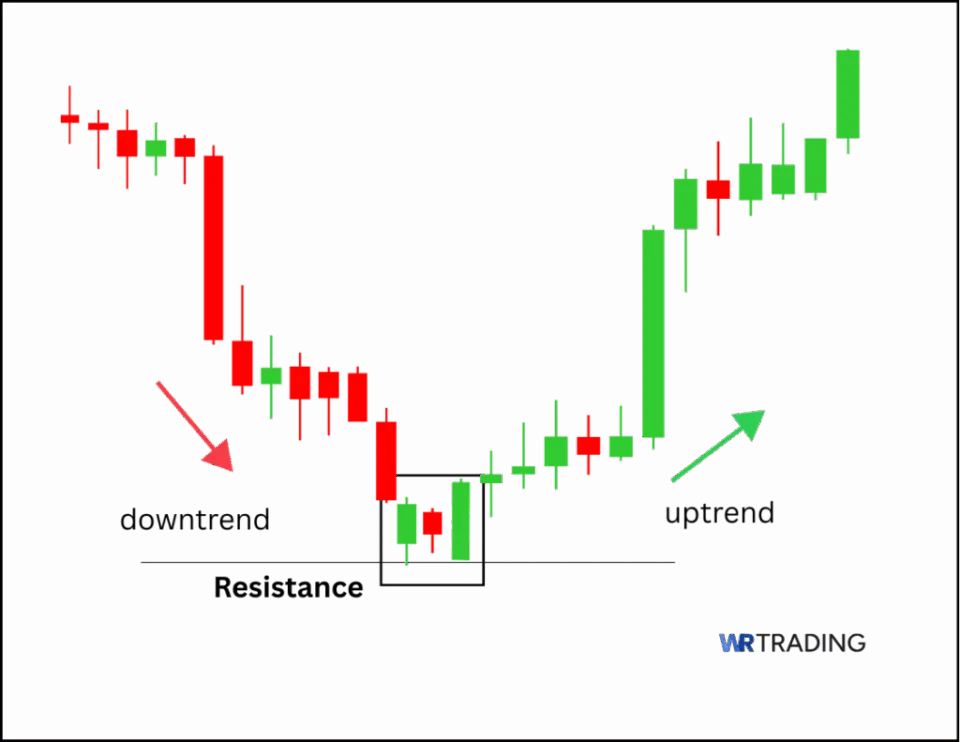
The best Popgun setups appear where markets are paused and pressure is building. Look for them after a strong move that has stalled, inside a range where the price has tightened, or at a major level where both sides are waiting to act. You want a location where traders are watching closely and where a breakout will mean something. The Popgun itself does not generate momentum. It releases momentum that is already building.

Use basic tools like support and resistance levels, trendlines, or moving averages to spot compression zones. You can also combine structure with oscillators like RSI or MACD to confirm momentum is fading before the pattern forms. Once the range starts to coil and the candles get smaller, start watching for the inside bar. That is your signal to prepare for a trade.
There are multiple types of setups to look for:
- Bullish reversal: Appears after a pullback in an uptrend near support or after a sharp drop has stalled.
- Bearish reversal: Forms after a failed rally or bounce in a downtrend near resistance.
- Bullish continuation: Shows up during consolidation in an existing uptrend, with the breakout confirming upward strength.
- Bearish continuation: Develops in a slow downward drift where the breakout confirms renewed selling pressure.
Always check the broader trend and make sure you are trading in the direction of the larger move unless the reversal setup is clear and backed by strong price behavior. Otherwise, you’ll end up in a losing position as the larger trend is likely to prevail.
(Learn To Trade And Read Candlestick Patterns Like A Pro)
2. Wait for the Appearance of the Popgun Candle
Once the inside candle forms, do not enter yet. You need the third candle to confirm the setup. The third candle must break above or below the inside candle and close outside that range. Anything less than a clean breakout is not a Popgun. Wait for the breakout to be clear and visible, it should not be subtle. The stronger the breakout, the higher the follow-through tends to be.
Use candlestick tools or visual markers to help spot when the pattern completes. Drawing a horizontal box around the inside candle’s high and low can help you track the breakout. Some traders set alerts just above and below those levels to stay focused while the third candle develops. You can also use volume tools like OBV or volume histogram to spot a volume surge on the breakout.
Avoid guessing the direction before the breakout happens. Let the chart show its hand first. Your job is not to predict but to react when the conditions are clear.
3. Open Your Trade – Entry Point
Once the third candle has broken out and closed outside the inside bar, you can enter the trade. Do not jump in halfway through the candle. Wait for the close. You want the pattern to be confirmed before you commit your capital. Once that candle is complete and the breakout is clean, place your trade in the direction of the close.
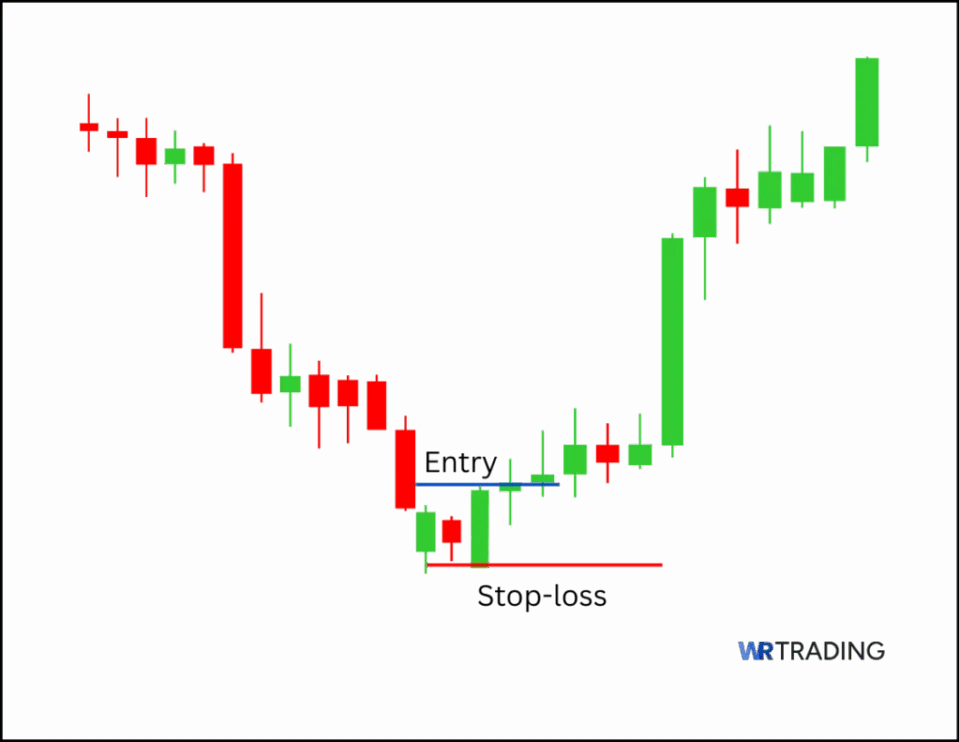
Set your stop just outside the opposite side of the breakout. If you are buying after an upward breakout, place the stop below the low of the inside candle. If you are selling after a downward breakout, place the stop above the high of the inside candle. This gives the trade enough space without being exposed to unnecessary risk.
Position sizing matters here, so only risk a small portion of your capital per trade. Use a fixed dollar risk or a percentage of your account base. Do not oversize just because the setup looks good. Even clean Popgun patterns can fail, so protect yourself before thinking about profit.
4. Wait For A Confirmation Or Not
You can take the trade as soon as the breakout candle closes, or you can wait for another candle in the direction of the trend. However, both approaches have tradeoffs. Opening a trade immediately gives you the best entry and the strongest risk to reward, but you may also catch more false breakouts. Waiting for confirmation reduces false signals but comes with weaker entries and sometimes missed trades.
If you are trading at key levels or during major market opens, taking the breakout without extra signals can make sense. If the pattern forms in a more neutral zone or mid-range area, waiting for confirmation gives more control. Match your decision to the quality of the setup and the strength of the chart.
5. Choose Your Trading Take Profit
Your exit should be based on price structure and the most basic target is the size of the inside bar added to the breakout point, which gives you a quick profit target. You can also target the next resistance level above if you are buying, or the next support level below if you are selling.
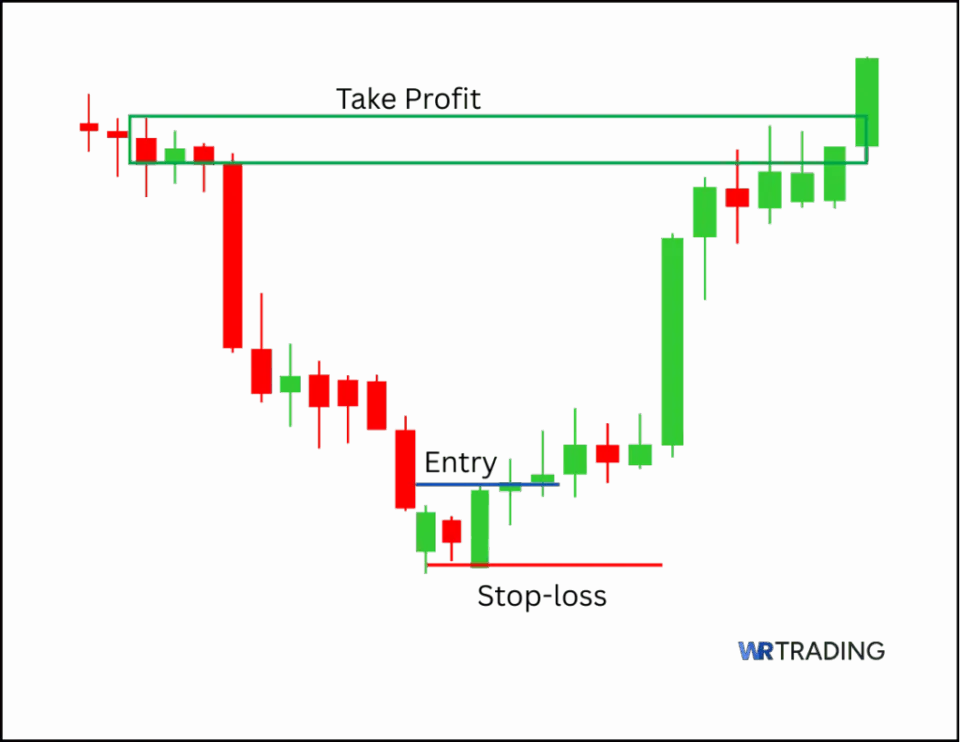
Fibonacci extensions work well with the Popgun pattern when you want to aim beyond the nearest structure. Use the high and low of the inside bar as your reference, then apply the 127 or 161 extension from the breakout candle. These levels often act as magnets when momentum continues. If the breakout happens near a key level and the price moves quickly, using extensions helps you stay in the trade longer without guessing the exit.
Trailing stops are also useful. Once the price moves in your favor, move your stop just below the last swing low in a long position or above the last swing high in a short. You can follow this step by step or use a dynamic tool like a short-term moving average to track progress. Lock in partial profits at the first target, then let the rest run with a trail. This gives you both security and the potential for more profits if the breakout becomes a trend.
(Learn To Trade And Read Candlestick Patterns Like A Pro)
Which Trading Strategies Are Suitable For The Popgun Pattern?
The Popgun pattern is flexible enough to work in multiple scenarios, but you need to apply it with a proven strategy. Without a strategy, you are less likely to succeed in the long run as consistency is important when trading candlestick charts.
The strategies in this section show how to use the Popgun pattern in different environments and each approach is created using different tools. Use the one that fits your trading style and the current conditions on the chart.
- Popgun With Support Or Resistance Confirmation
- Popgun At The End Of A Pullback
- Momentum Continuation After Consolidation
1. Popgun With Support Or Resistance Confirmation
Combine the Popgun pattern with key levels that have already proven themselves on the chart. When the price returns to a strong level and stalls, the inside bar shows hesitation. The breakout that follows provides the signal. Rather than trading every Popgun that forms, you are filtering by location and only taking the setup when it aligns with clear structure.
Mark out the levels using previous swing highs, lows, or major turning points. Once the price returns to one of those areas and starts to slow down, wait for the Popgun to form.
Let the third candle close beyond the range of the inside bar in the direction of the level reaction. For bullish setups, look for a bounce off support. For bearish setups, look for a rejection at resistance. Place your stop just beyond the level in the opposite direction of the breakout and aim for the next zone above or below.
2. Popgun At The End Of A Pullback
In trending markets, one of the safest ways to trade continuation is to wait for a clean pullback, then look for the Popgun to mark the end of the correction. The inside bar forms when the countertrend move starts to lose momentum. As the price breaks out of that bar, the trend is likely to resume. The setup allows you to enter without guessing and gives a clearly defined range for risk.
Use a moving average such as the 20-period exponential or simple average to track the trend direction. Let the price pull back toward that line or just below it. Watch how candles behave as they reach the moving average.
A small inside bar followed by a strong breakout candle is a clean entry signal. Use the low of the pullback as your stop, and measure your first target using the previous impulse leg. You can extend further once the price starts moving in your direction.
3. Momentum Continuation After Consolidation
Strong trends often pause before resuming, giving traders another opportunity to enter. When that pause turns into sideways movement and the price begins to compress, the Popgun becomes a reliable way to reenter in the direction of the trend. You are not predicting a reversal. You are entering after the market confirms that it still wants to move in the same direction.
Draw a short-term consolidation zone inside the larger trend. Use a dynamic guide like the 20-period moving average to track continuation setups. When the Popgun forms inside that consolidation, wait for the breakout to confirm that momentum is returning.
Once the third candle closes in the direction of the trend, take the trade and place your stop outside the inside bar. Use the height of the most recent leg as a baseline for your target and look to trail your stop if the trend accelerates.
What Is The Success Rate Of The Popgun Candlestick Pattern?
There is no official success rate for the Popgun pattern, and no formal research or backtesting has been published to measure how often it produces a reliable breakout. The Popgun was originally described by trader Jeffrey Kennedy, who identified it as a three-candle structure that often appears just before volatility returns.
However, in our experience the Popgun had a success rate of 53-63% and tends to perform better when it forms around major support or resistance, or during short consolidations within a larger trend. When the surrounding chart lacks structure, volume, or clear directional pressure, the breakout that follows is more likely to fail or lose momentum quickly.
Is the Popgun Candlestick Pattern Suitable for Beginners?
No, because the Popgun is too advanced for someone still learning the basics of technical analysis and pattern recognition. The Popgun is difficult to spot in real-time unless you already have experience reading price structure and understanding where breakouts are most likely to occur.
It only works well when it forms near a key level or inside a clear pause during a trend, and those details are easy to miss without enough chart experience. Most of the value comes from how the setup interacts with the rest of the price action, not just the shape itself.
Since it is a very rare pattern, there is a good chance you would overlook it or misread it before it completes. Without knowing what to look for or how to confirm the breakout, the setup loses its edge quickly. The formation might be simple at first, but timing it and placing trades around it takes a level of skill that most beginners have not built yet.
(Learn To Trade And Read Candlestick Patterns Like A Pro)
What Are the Pros and Cons of Trading the Popgun Candle Pattern?
The Popgun pattern can work well when the price is coiled and ready to break. It helps you catch sharp reversals and strong follow-through after pullbacks, but it also comes with risks, like false signals. The Popgun depends on a clean structure and needs confirmation to hold up in weaker markets. Knowing the strengths and weaknesses makes it easier to use it properly.
Pros
- Defined entry and stop level
- Reliable in trending markets
- Quick to validate or reject
- Pairs well with technical tools
- Reduces hesitation in trade execution
Cons
- No directional edge until the breakout candle closes
- Easy to misuse when traded in isolation
- Momentum is not built into the Popgun
- Breakouts can reverse without warning
- Smaller timeframes increase failure rates
What Are The Advantages Of The Popgun Pattern?
The Popgun pattern stands out because of how it captures price compression followed by breakout. It gives you a clear structure to work with and lets you define your entry, stop, and target. These advantages make it a strong addition to breakout or momentum-based strategies when used with proper context.
- Defined entry and stop level: The structure of the inside candle creates a natural boundary for your trade. Once the breakout occurs, you know exactly where to enter and where to place your stop without having to calculate distance based on volatility or use indicator-based bands.
- Reliable in trending markets: When the broader trend is intact but the price starts to pause or pull back slightly, the Popgun can act as a clean continuation signal. It shows you when buyers or sellers are stepping back in after a brief slowdown, giving you a chance to enter just before momentum resumes.
- Quick to validate or reject: You don’t need to wait several candles to know if the pattern is valid. If the breakout fails to close beyond the inside bar, the trade is off. This helps you avoid sitting in weak positions and keeps your execution clean.
- Pairs well with technical tools: The Popgun is best used alongside tools like Fibonacci retracements, key levels, or volume confirmation. These added layers filter out weaker setups and give you more confidence in the breakout that follows.
- Reduces hesitation in trade execution: Many traders hesitate when the price contracts and volatility drops. The Popgun removes that uncertainty by giving you a simple rule to wait for the breakout and go with it. It forces you to trade based on the price action instead of fear or bias.
What Are The Disadvantages Of The Popgun Pattern?
The Popgun pattern gives you structure, but structure alone does not make a pattern tradable, and without the right conditions behind it, it becomes just another breakout that looks clean until it fails. Recognizing these disadvantages will keep you from forcing trades, misreading signals, or relying on setups that have no weight behind them. Knowing where the pattern breaks down is just as important as knowing how it works.
- No directional edge until the breakout candle closes: The Popgun offers no advantage until the third candle confirms the breakout. Many traders get caught trying to guess which way the market will break, and that completely defeats the purpose of the setup. You are trading the confirmation, not the shape.
- Easy to misuse when traded in isolation: Without support, resistance, trend structure, or volume confirmation, the Popgun loses its value. The chart may show a perfect Popgun, but if it forms in the middle of a range or without any clear context, the breakout often goes nowhere.
- Momentum is not built into the Popgun: The Popgun shows contraction and release, but it does not tell you how strong the follow-through will be. A clean breakout candle might close beyond the inside bar, but without actual momentum behind it, the price can stall quickly and trap late entries.
- Breakouts can reverse without warning: Even when the Popgun looks clean and forms near a level, the breakout can reverse immediately. False breakouts are common in fast markets, and the Popgun does not protect you from them. You need to manage risk tightly and avoid assuming that every breakout will hold.
- Smaller timeframes increase failure rates: On charts like the fifteen-minute or lower, the Popgun often becomes unreliable. Price action is less stable and candles can be erratic. Unless you have a high-quality setup backed by strong context, lower timeframes tend to deliver more noise than signal.
Can The Popgun Candlestick Pattern Fail?
Yes, even when the Popgun pattern appears clean, the setup can break down if the conditions surrounding it are incorrect. Certain signals on the chart can expose these weak spots before they turn into losses. Knowing how the pattern fails will help you avoid low-quality trades and focus only on the ones that are likely to be profitable.
- Breakout candle fails to close outside the inside bar: When the third candle breaks the range but closes back inside it or right on the edge, the breakout has no strength behind it. This kind of move fades quickly and returns to the original range. Even though the structure looks valid, the lack of a proper close signals that the breakout has likely failed before it even starts.
- No structure or key level near the pattern: A Popgun pattern without any nearby support, resistance, or trend context is nothing more than price noise. It might still produce a breakout, but without real structure behind it, the move tends to lack follow-through. Patterns that form in the middle of nowhere often attract weak momentum and choppy price action.
- Breakout candle prints with weak volume: If the breakout happens on flat or declining volume, that usually means there is no participation driving the move. Breakouts need pressure, and volume is what shows that traders are actually stepping in. Without that confirmation, the pattern becomes unreliable and often snaps back into the range.
- The setup appears inside a choppy or overlapping range: When the candles leading into the Popgun are full of wicks, overlap, and indecision, the breakout that follows is usually part of that same noise. The pattern might form cleanly, but the context is messy. Most failed breakouts happen when traders try to apply structured patterns in unstructured price action.
- Multiple inside bars appear before the breakout: A standard Popgun has only one inside bar, but when the price keeps compressing across several candles, the breakout becomes less predictable. That kind of extended contraction builds up too much pressure and often releases it in both directions before committing to one. Breakouts from these setups tend to be volatile and difficult to manage.
- Breakout goes directly into a nearby barrier: When the third candle breaks out but runs straight into resistance or support within a few points, the move has little room to develop. The breakout might trigger your entry, but it stalls immediately after. If there is no space beyond the inside bar, the pattern has nowhere to go.
- The breakout appears just before a major market close: Late-day breakouts or patterns that complete near the end of a trading session often fail due to lack of volume. Markets slow down, volatility fades, and setups that rely on momentum fall flat. The signal might look clean, but timing strips the trade of its edge.
(Learn To Trade And Read Candlestick Patterns Like A Pro)
Which Indicators Can Be Combined With The Popgun Pattern?
Certain indicators work naturally with the Popgun pattern because they either confirm volatility shifts or highlight strong breakout zones. Using the right tools alongside the Popgun can help filter out weaker signals and time entries with more precision. Below are several indicators you can use with specific settings to sharpen your edge and avoid guessing.
Relative Strength Index (RSI)
RSI gives a clear read on momentum before the breakout happens. When a Popgun forms and the RSI is already pushing above 60 in an uptrend, it suggests that the move is backed by strength. In a bearish scenario, readings below 40 show that sellers already have control before the breakdown begins. When the RSI flattens between 45 and 55, it often means the market has no real pressure behind it, and the Popgun is more likely to stall or fail.
Volume (Raw Volume or OBV)
Volume is one of the most important confirmations for a Popgun breakout. Once the third candle starts breaking the inside bar’s range, the move needs to be supported by a noticeable increase in volume. That pressure shows commitment, and it confirms that buyers or sellers are stepping in with size. You can also use On Balance Volume (OBV) to track whether pressure has been building over time leading into the setup.
Moving Averages (20 EMA and 50 SMA)
Moving averages help define structure and direction when the pattern itself is neutral. The 20-period exponential moving average works well to highlight short-term momentum, while the 50-period simple moving average shows the broader trend.
When a bullish Popgun forms above both averages, the odds of a clean continuation improve significantly. In bearish setups, look for the pattern forming below the moving averages, especially if price has already rejected off them. Avoid setups where price is chopping directly through the averages with no clear slope or alignment.
Bollinger Bands (20,2)
Bollinger Bands are best used to spot volatility compression before a breakout. When the inside bar of the Popgun forms inside a tight squeeze and the bands contract around the price, it shows that movement has slowed and pressure is building. A breakout candle that closes outside the band confirms that volatility is expanding and the setup has strength behind it.
The signal loses reliability when the price hesitates at the band edge or fails to follow through beyond it. You can also watch for band expansion starting just as the third candle forms, as that often marks the beginning of a sustained push.
Average True Range (ATR)
A 14-period ATR gives a solid view of how much the market is moving and whether the breakout is likely to carry momentum. When ATR has been dropping and a Popgun setup appears, it means the price has tightened and is preparing for a breakout.
Once the breakout candle closes, a rising ATR confirms that volatility is returning and supports the move. You can also use the current ATR value to place your stop by measuring that distance past the high or low of the setup, giving the trade enough room without using a fixed number.
MACD (12,26,9)
MACD is a reliable way to confirm if momentum supports the breakout direction. When the lines are widening and moving in sync with the breakout, it shows the move has force behind it. A bullish Popgun setup gains strength when MACD is already crossing upward or the histogram is expanding in the same direction.
Bearish setups work better when the MACD is pulling down sharply from a recent peak. Avoid signals when MACD is flat or sitting near the zero line with no clear movement, as this often reflects an indecisive market.
Fibonacci Levels (Retracement and Extension)
Fibonacci tools work well when the Popgun appears inside a retracement or just before a leg resumes. Patterns that form near the 38 or 50 percent retracement often trigger clean continuations if the breakout matches the prior trend.
After the breakout is confirmed, Fibonacci extensions like the 127 or 161 levels provide natural targets that align with how the price moves in waves. These levels are more effective when the original leg is clear and the price has already shown structured behavior before the setup.
What Are Similar Patterns to the Popgun Pattern?
Some candlestick patterns share the core structure or behavior of the Popgun, even though the sequence is not identical. The inside bar, which forms the center of the Popgun, also appears in setups that signal price compression or indecision. Patterns like the outside bar and engulfing candles replicate the breakout element, while three candle structures such as Three Inside Up or Three Outside Down combine compression and confirmation in a similar way.
| Pattern Name | Key Characteristic | Best Use Case |
|---|---|---|
| Inside Bar | The price stays within the previous candle’s high and low, creating a pause or contraction | Reflects the second candle of the Popgun and helps signal a breakout is coming |
| Outside Bar | The candle breaks both the high and low of the one before it, closing beyond both ends | Acts like the breakout part of a Popgun, confirming pressure and follow through |
| Three Inside Up | The first candle is bearish, the second is bullish and fits inside it, the third breaks higher | Follows a similar three-step build-up and breakout structure as a bullish Popgun |
| Three Outside Down | Begins with a bullish candle, followed by a bearish candle that swallows it, then another bearish candle | Mirrors a bearish Popgun by combining reversal, confirmation, and continuation |
| Bullish Engulfing | A strong bullish candle completely overtakes the previous bearish one | Similar to the Popgun breakout when buyers step in with control after compression |
These patterns often form in the same places on the chart, like after a pullback, near a range boundary, or right before a breakout. Studying them gives you more flexibility when scanning for trading opportunities since the Popgun appears so rarely. Download our free Candlestick Pattern PDF and Cheat Sheet to learn more about different patterns.
What Is The Opposite Pattern Of The Popgun?
The Popgun pattern stays neutral until the final candle decides its direction. When that third candle closes above the range of the inside bar, it becomes a bullish Popgun. If it closes below, it becomes a bearish one. That last candle is what shifts the pattern from compression into confirmation.
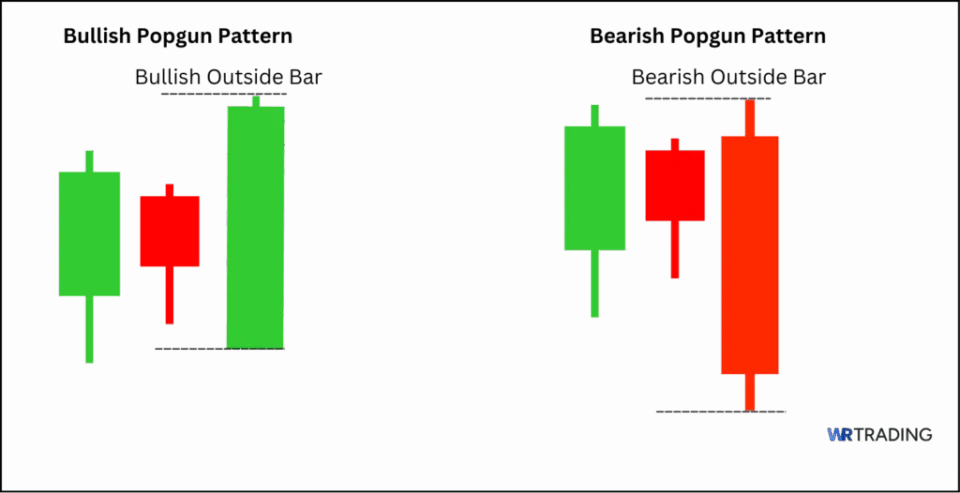
| Section | Bullish Popgun | Bearish Popgun |
|---|---|---|
| Construction | First Candle: Wide-range green candle. Second Candle: Inside bar that stays within the high and low of the first. Third Candle: A green candle breaks above the inside range and closes strong. | First Candle: Wide-range red candle. Second Candle: Inside bar remains inside the high and low of the first. Third Candle: A Red candle breaks below the inside range and closes weak. |
| Forecast | Signals breakout continuation or reversal upward as buyers reclaim control with strength. | Signals breakout continuation or reversal downward as sellers confirm control and push prices lower. |
| Type of Pattern | Three-candle breakout pattern with bullish momentum confirmation. | Three-candle breakout pattern with bearish momentum confirmation. |
| Trend Prior to Pattern | Forms during pullbacks in uptrends or after consolidation near support. | Forms during retracements in downtrends or after consolidation under resistance. |
| Opposite Pattern | Bearish Popgun | Bullish Popgun |
The difference shows up most clearly in where each version forms and what price does next. A bullish Popgun usually appears near a strong level of support or after a clean pullback, where buyers are already positioned to drive prices higher. The bearish version tends to show up near resistance or at the end of a weak rally, where buyers are stretched and sellers step in with force. Both use the same pattern structure, but they behave differently once pressure is released.
What Are The Limitations Of The Popgun?
The Popgun pattern gives you a structured setup, but it has serious limitations that need to be understood. The first is how rarely it appears, as it depends on three specific candles forming in a precise sequence, it shows up infrequently on most charts. That makes it difficult to rely on as a consistent signal source, which is not useful for traders looking for regular entries.
Another limitation is how hard it can be to recognize in real time. When the price is still compressing and the breakout candle has not closed yet, the structure is easy to miss or misread. It becomes clearer after the fact, but by then the best opportunity may already be gone. Here are the main limitations you need to know:
- It’s a rare pattern that forms under specific conditions, so you will not see it often across most charts.
- The Popgun completes quickly, which makes it hard to identify and act on before the breakout candle closes.
- Direction is not clear until the third candle finishes, which can reduce reaction time and limit early entries.
- The pattern struggles in sideways markets, where fakeouts and choppy price action can trigger false signals.
- It loses reliability without a strong trend or nearby support and resistance levels to guide the breakout.
- You cannot trade it in isolation since it offers no edge without confirmation from volume, structure, or momentum.
Learn Pattern Trading With the WR Trading Mentoring
The WR Trading mentoring program is designed to train you to read price action with structure and control. Instead of focusing on surface setups or delayed signals, you are shown how to read what the market is doing as each bar forms. You learn how patterns like the Popgun form from compression, how to confirm them through volume or indicators, and when a breakout is more likely to follow through.
Rather than memorizing patterns or relying on textbook examples, you build experience through repetition and live chart work, where each decision is backed by context and rule-based logic. The training walks you through each part of the process, like what happens before the pattern forms, how to recognize when it carries weight, and how to manage the trade.
You are also given access to live sessions, structured reviews, and constant chart-based training that helps you progress your skill level. The focus is not on speed or signals, but on helping you build the type of thinking that will make you a long-term profitable trader. Consider joining WR Trading now to expand your trading knowledge and skills.
(Learn To Trade And Read Candlestick Patterns Like A Pro)
Conclusion: The Popgun Is a Rare Breakout Pattern That Only Works With Confirmation
The Popgun is a rare candlestick pattern that signals a breakout is about to happen, but it only works when the chart gives you structure, volume, and a strong directional push. Without those elements, the pattern loses all of its value and becomes just another shape on the chart. Most traders fail with the Popgun because they either spot it too late or try to trade it in places where it doesn’t belong.
It is not a strategy by itself, and it will not give you an edge unless you treat it as one part of a larger trading plan. That means reading the trend, tracking where pressure is building, and knowing when the breakout is actually worth taking. Used in the right way, the Popgun gives you clean risk, fast confirmation, and a chance to catch strong moves that others miss.
FAQs: Most Frequenty Asked Questions on Popgun Pattern
Is the Popgun a bullish or bearish pattern?
The Popgun is a neutral pattern until the breakout confirms direction. If the third candle breaks upward, it becomes a bullish signal. If it breaks lower, it signals bearish momentum.
How often does the Popgun pattern appear?
It appears very rarely, even on higher timeframes. The Popgun requires a clean sequence of three candles, which limits how often it forms. Most traders miss it because they are not watching for compression first.
Can beginners trade the Popgun pattern?
Beginners may struggle to identify the Popgun in real time without strong chart experience. It requires an understanding of price context and confirmation tools. With proper training from WR Trading, it can eventually become part of a simple breakout strategy.
Do you need volume confirmation with the Popgun?
Yes, increased volume confirms that a breakout is happening. A strong candle that breaks cleanly with volume support often leads to better follow-through. If volume is weak, the breakout may fade quickly.
Can You Spot the Popgun Before It Completes?
No, but you can anticipate it once you see a strong range candle followed by a clean inside bar. The third candle must close outside that range to confirm, but you can mark the inside bar’s high and low to prepare. Drawing a visual box or setting alerts can help you focus before the breakout.