The Separating Lines is a two candlestick pattern that shows up in strong trending markets that point to momentum continuation. The first candle moves sharply against the trend, often causing doubt or hesitation among traders. Then the second candle opens at the same level as the previous one and closes strongly in the direction of the original trend, effectively separating the signal from the pullback.
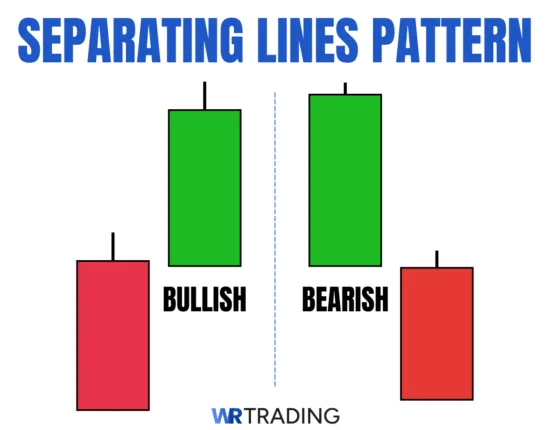
This pattern can form as either bullish or bearish. A bullish Separating Lines pattern appears during an uptrend when a strong red candle is immediately followed by a green candle that opens at the same price and closes higher.
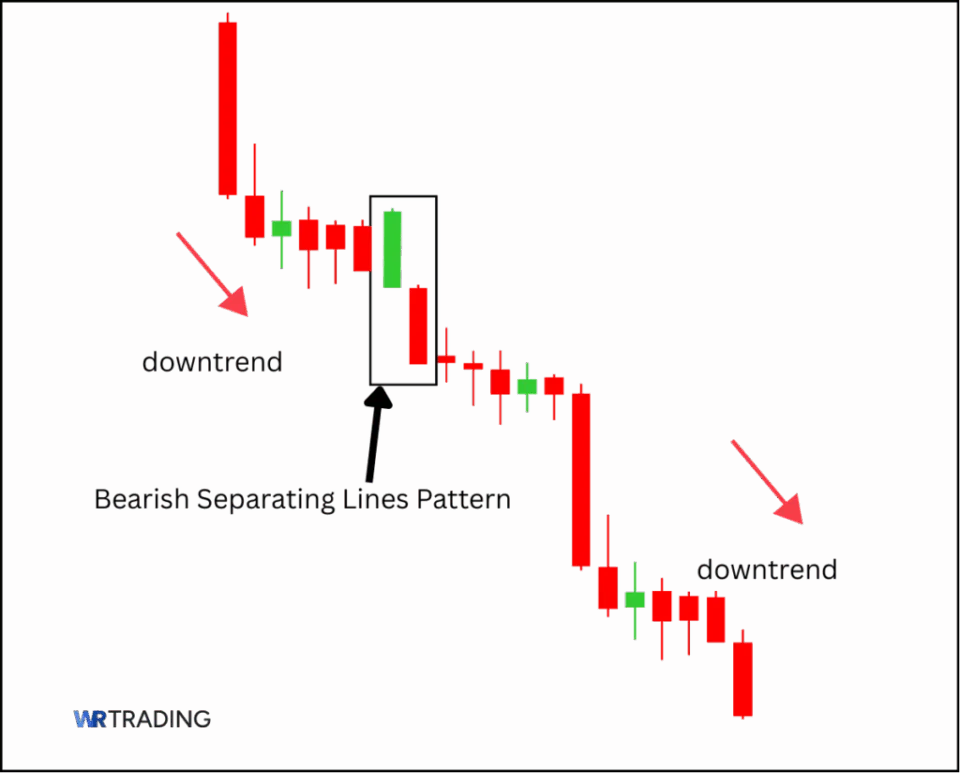
A bearish version forms in a downtrend after a green candle is followed by a red one that opens at the same level and pushes the price lower again. In both cases, the pattern signals that the trend is still alive and that momentum has returned to its dominant direction.
We like using the Separating Lines pattern to confirm that a brief counter move has failed and that the main trend is resuming. In our experience, it’s most effective when it forms near key support or resistance levels, with volume or other tools that confirm market commitment. Our comprehensive guide will explain how to spot the pattern, how to trade it confidently, and how to combine it with other strategies to improve decision-making.
(Learn To Trade And Read Candlestick Patterns Like A Pro)
What Is A Bullish Separating Lines Pattern?
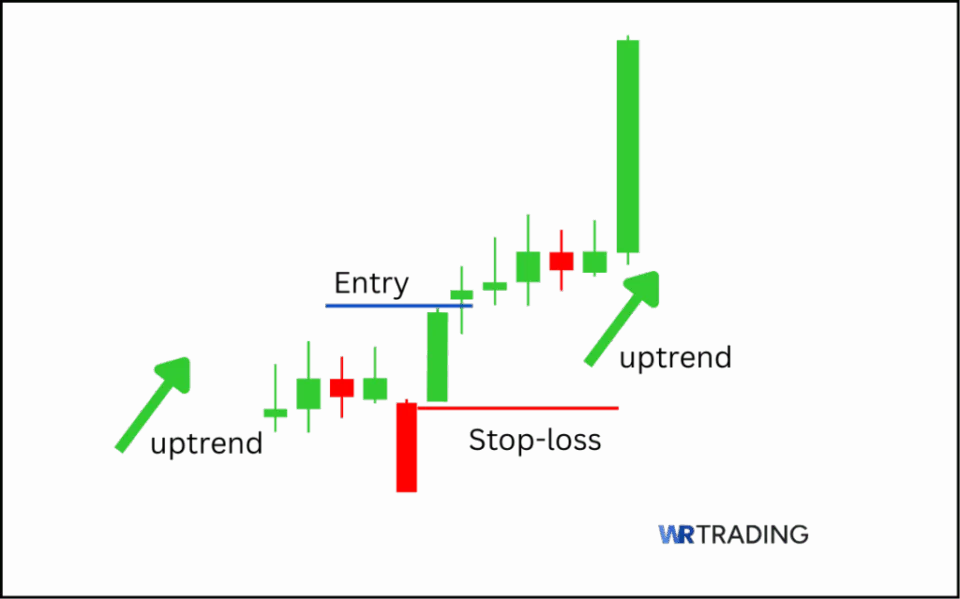
The bullish Separating Lines is a two-candlestick pattern that signals the continuation of an uptrend. It starts with a strong red candle that goes against the bullish trend and gives the impression of a possible pullback or shift in direction. Right after, a green candle opens at the exact same price as the red candle did and pushes the price higher, closing well above the first red candle’s body.
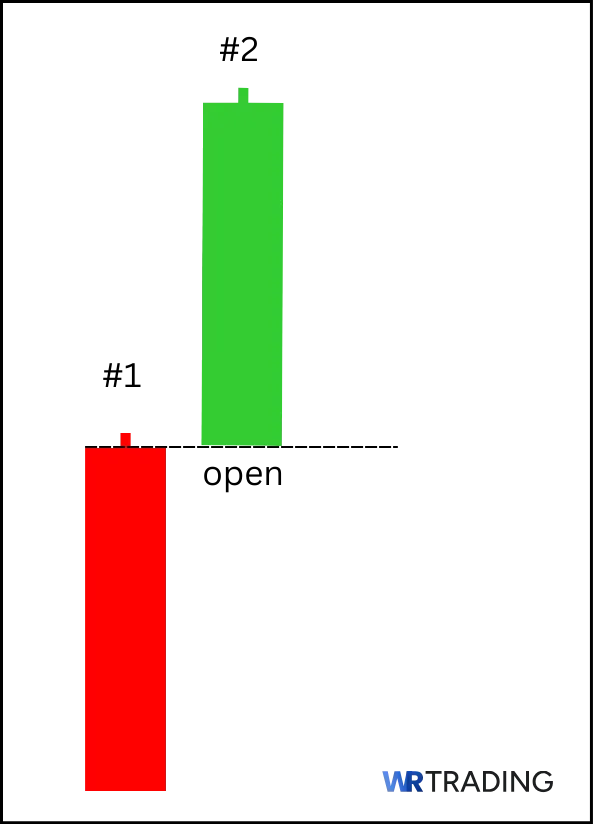
This structure confirms that the downward move failed and that buyers are still in control. The matching open between the two candles sets this pattern apart from others, showing that the market picked up where it left off and rejected the dip. Traders read this pattern as a return to strength and use it to catch trend continuation trades and place long positions.
Key Facts of The Bullish Separating Lines Pattern:
- Type of Pattern: Two-candle bullish continuation pattern.
- Construction Characteristics:
- First Candle: A strong red candle that moves sharply against the trend, creating doubt about if the uptrend will continue.
- Second Candle: A green candle that opens at the exact same level as the red candle and closes higher, reclaiming lost ground and confirming buyer strength.
- Trend Prior to Pattern: Develops within an active uptrend where the price is gradually increasing.
- Trade Forecast: Signals the continuation of the uptrend. The pattern confirms that the pullback has failed and the bulls have regained control.
- Interpretation: The red candle invites speculation that buyers are losing momentum, but the immediate recovery by the green candle shows the uptrend is still intact. The matching open price highlights market commitment and the quick return of bullish sentiment.
- Stop Loss Placement: Set your stop just below the low of the green candle. A break below this point would mean buyers failed to hold their ground, and the signal loses its value.
- Opposite Pattern: Bearish Separating Lines.
- Success Rate: Unofficial sources claim a success rate of 78.1%.
What Is a Bearish Separating Lines Wave Pattern?
The bearish Separating Lines pattern is made up of two candles and points to ongoing downside momentum within a downtrend. It begins with a strong green candle that pushes against the downward direction, creating false hope of a recovery. Then comes a red candle that opens at the exact same price as the first green candle and drives the market lower, closing deep into new lows.
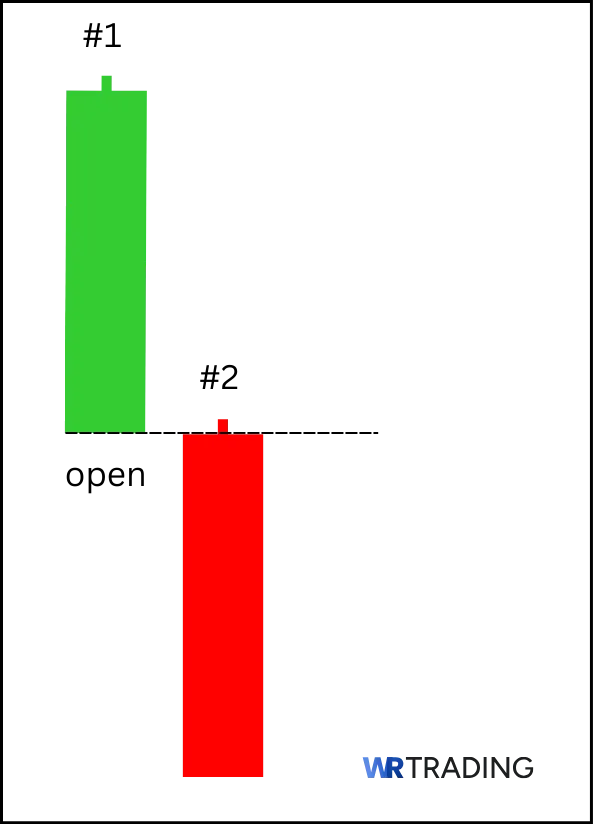
Rather than confirming a reversal, this pattern shuts it down and reaffirms that sellers still dominate. The shared open price between both candles adds weight to the signal, showing that the market didn’t just hesitate but actively rejected the bounce attempt. Many traders watch for this pattern near resistance zones or after brief rallies to time short entries that go with the main trend.
Key Facts of The Bearish Separating Lines Pattern:
- Type of Pattern: Two-candle bearish continuation pattern.
- Construction Characteristics:
- First Candle: A strong green candle that temporarily moves against the downtrend, giving the impression of a possible reversal.
- Second Candle: A red candle that opens at the same price as the previous green candle and closes lower, showing that sellers have rejected the bounce and regained control.
- Trend Prior to Pattern: Forms in a clear downtrend after a shallow rally or reaction bounce that struggles to gain traction.
- Trade Forecast: Signals that the downtrend is continuing. The bounce has failed, and momentum has shifted back to the downside.
- Interpretation: The green candle attempts to challenge the trend, but the red candle cancels it immediately by opening at the same level and pushing lower. It marks the point where sellers take back control with conviction.
- Stop Loss Placement: Place your stop just above the high of the red candle. If the price breaks above that point, the setup has failed and momentum has likely shifted.
- Opposite Pattern: Bullish Separating Lines.
- Success Rate: Unofficial sources claim a success rate of 78.1%.
(Learn To Trade And Read Candlestick Patterns Like A Pro)
How Does a Separating Lines Candlestick Pattern Form?
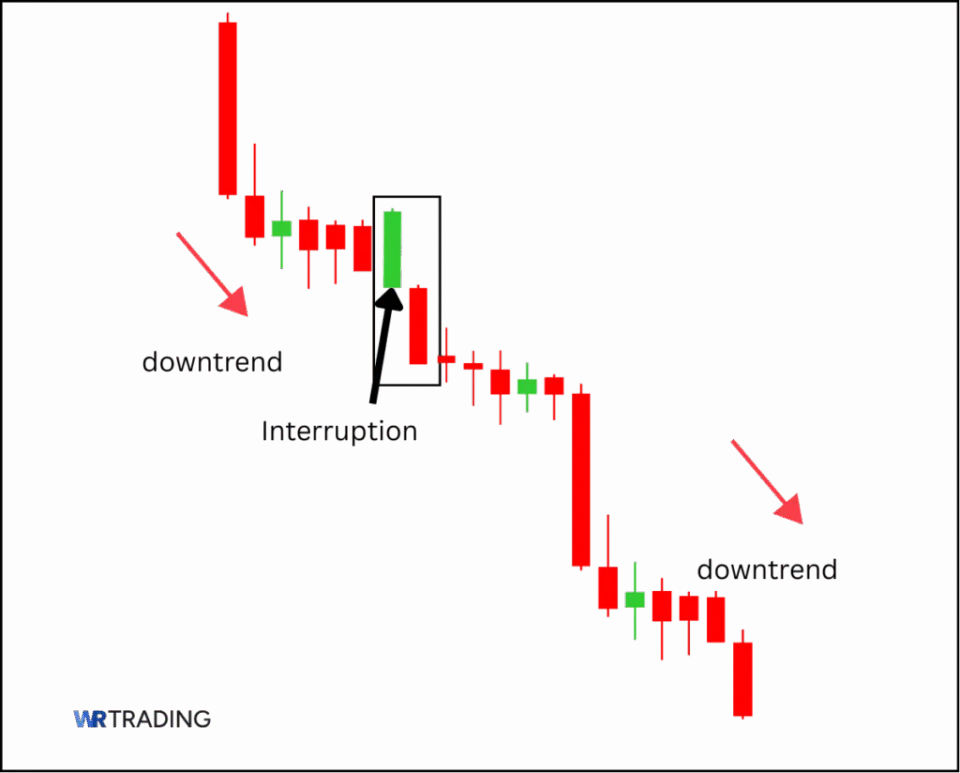
The Separating Lines pattern takes form over two candles, but it’s the interaction between each other and the surrounding candles that defines the signal. It shows up during trending markets when one side briefly loses control, only to recover instantly and reassert dominance. The open of the second candle matches the open of the first, separating the trend from the interruption and sending a strong signal that momentum is back in line.
In bullish markets, the pattern begins with a strong red candle that appears during an uptrend. This first red candle often shakes out weak hands or gives the impression that the trend is losing power. Then the second green candle opens at the same level and closes higher, flipping the pressure back toward the bulls. The green candle must clearly reclaim control by closing beyond the midpoint of the first candle, preferably stronger.
For bearish Separating Lines, the first candle is green and appears during a downtrend. It challenges the trend and hints that buyers are stepping in. However, the next red candle opens at the same price and moves sharply lower, showing the recovery was weak and sellers remain dominant. If this second candle closes beyond the midpoint of the previous candle, it strengthens the signal. This pattern works best when forming near resistance or after a short bounce in an active downtrend.
What Does the Separating Lines Candlestick Pattern Mean?
The Separating Lines pattern reflects how the market handles pressure during a trend, giving you a clear look at how traders react when a pullback briefly challenges momentum. The first candle pulls against the trend and raises doubt, but the second candle resets that narrative by opening at the same level and closing strongly in the direction of the dominant move, signaling that the interruption lacked conviction and was quickly rejected.
The pattern shows that buyers or sellers never truly lost control, price action simply paused, reset, and continued. The matching open on both candles is a sign that the market refused to follow through on the counter move and instead rejoined its original path.
Traders who chased the retracement find themselves trapped, while those trading with the trend regain confidence and often add to their positions. This shift becomes even more meaningful when the second candle forms near a support or resistance level and is accompanied by a volume increase that confirms renewed interest.
Where does the name of the Separating Lines Pattern Come From?
The name “Separating Lines” comes from the way the second candle breaks away from the doubt created by the first. When the first candle forms against the main trend, it creates a moment of uncertainty that causes traders to question if the move is losing strength.
When the second candle opens at the exact same price as the first and then drives back in the trend’s direction, it clearly separates the pullback from the continuation. That matching open is what gives the pattern its name, acting as the line that divides hesitation from commitment.
(Learn To Trade And Read Candlestick Patterns Like A Pro)
Example of the Separating Lines Pattern in the Chart

How to Identify a Separating Lines Candle in the Chart?
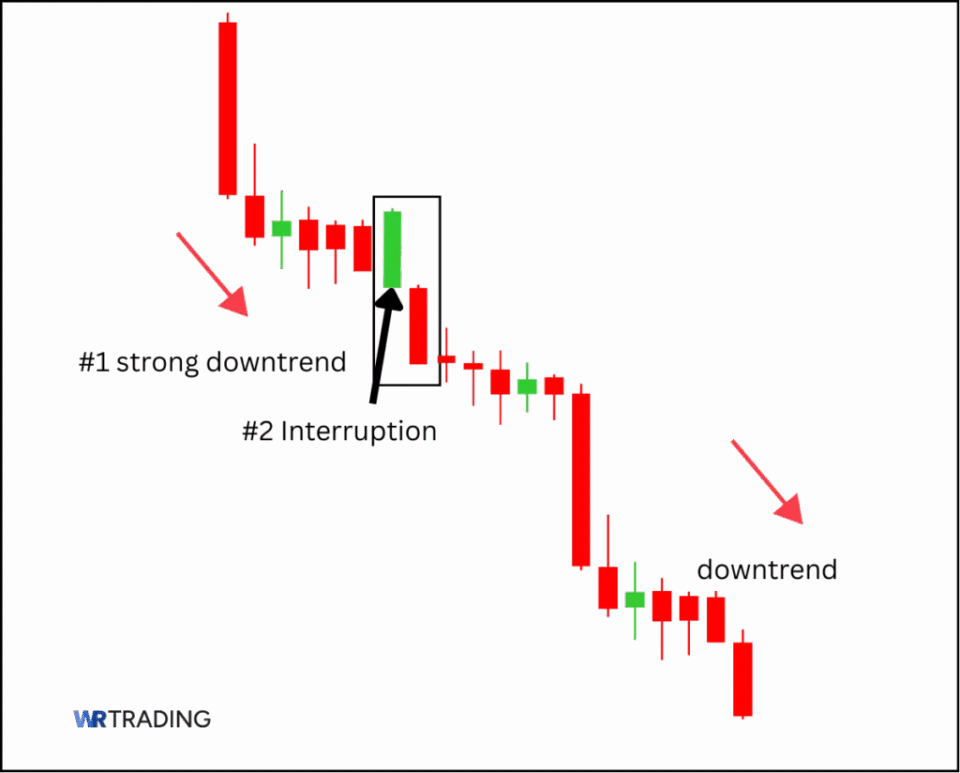
To identify the Separating Lines pattern, watch for strong trends in place, either pushing higher or moving steadily downward. You are not looking for sideways action or consolidation, but clear directional movement with real momentum behind it. The pattern forms when the trend is briefly interrupted by a single candle that moves in the opposite direction, which often looks like the start of a pullback or a hesitation move.
Identifying a Bullish Separating Lines:
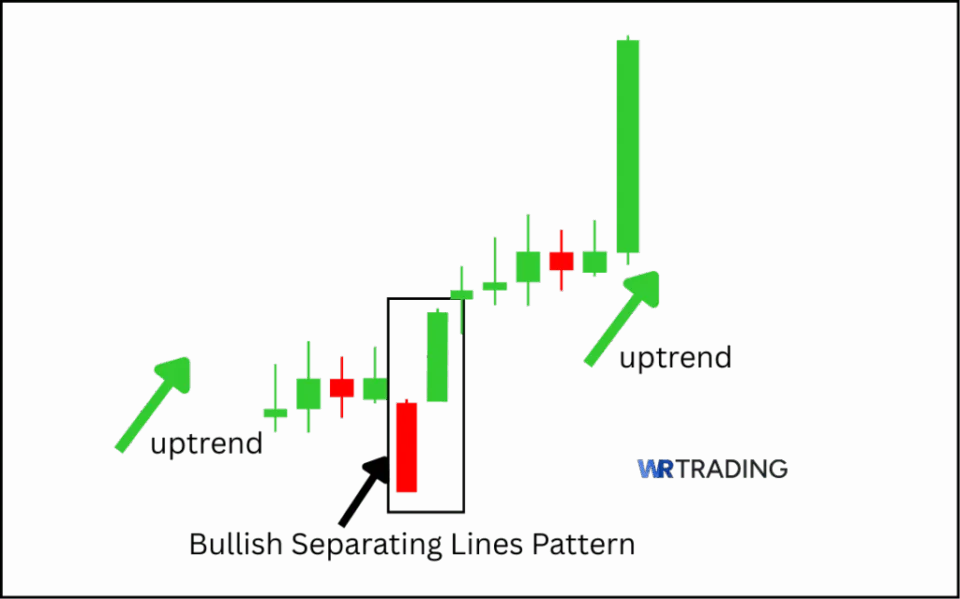
When you are spotting a bullish Separating Lines pattern, focus on charts where the price has already been rising with strength and consistency. You will often see a red candle appear that seems to break that momentum, giving the impression that the uptrend is weakening.
Pay close attention to the candle that comes next. It must open at the same price as the red one before it and then close higher, showing a clear rejection of the dip. This tells you that the selling attempt was overwhelmed quickly and the uptrend has resumed with renewed strength.
Identifying a Bearish Separating Lines:
Scan for a clean downtrend that has already shown strong movement in one direction when searching for the bearish Separating Lines. The pattern starts when a green candle appears to push upward against the trend, which can trick traders into thinking a reversal is beginning. What you need to see next is a red candle that opens at the exact same level as the green candle and then closes deep below it.
That matching open and strong downward finish confirms that the brief bounce was rejected and that sellers are still in full control. When this happens near a key resistance area or is paired with a clear drop in volume on the green candle followed by a spike on the red one, the pattern becomes even more reliable.
(Learn To Trade And Read Candlestick Patterns Like A Pro)
How to Trade the Separating Lines Candlestick Pattern
Trading the Separating Lines pattern is straightforward but can be intimidating if you’ve never encountered this type of pattern before. You need to find the right setup, spot the pattern in real-time, and manage your entry and exit based on what the market is doing around it.
Here’s how to trade the Separating Lines step by step, with everything you need to handle both bullish and bearish versions.
- Find the Right Separating Lines Candlestick Pattern Setup
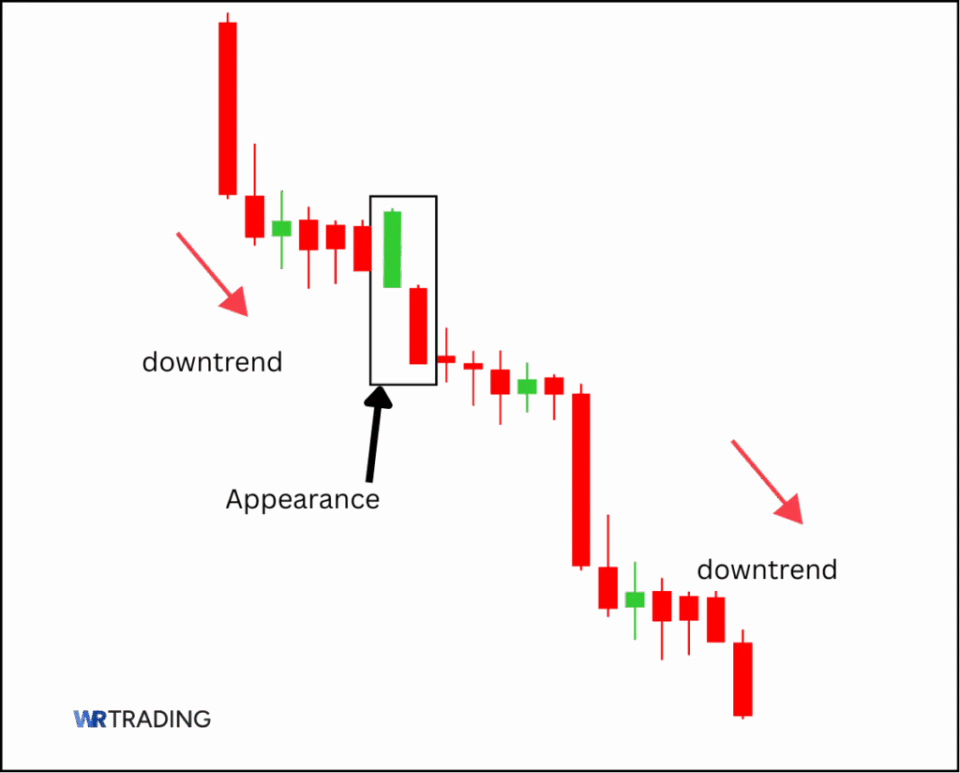
- Wait for the Appearance of the Separating Lines Candle
- Open Your Trade – Entry Point
- Wait For A Confirmation Or Not
- Choose Your Trading Take Profit
1. Find the Right Separating Lines Candlestick Pattern Setup
Before this pattern forms, the market should already be moving with a clear directional bias. In bullish setups, you should be looking for a steady uptrend with strong green candles, rising volume, and few signs of exhaustion. When the price is climbing with conviction, the first red candle that moves against that trend often makes traders think a reversal is starting.
When trading the bearish Separating Lines, focus on a clean downtrend with strong red candles, where buyers step in briefly to interrupt the move. You want a trend that has momentum, not one that is choppy or stuck in a tight range.
Check the strength of the trend with a tool like the ADX set to 14. Anything above 25 usually confirms a trend with enough momentum. Combine that with a look at swing highs or lows to make sure the price is not sitting inside consolidation. The Separating Lines work best when it shows up in clean conditions where the trend has room to extend.
2. Wait for the Appearance of the Separating Lines Candle
Once you identify the trend and market environment, your next step is to wait for the pattern to appear correctly. Do not anticipate the second candle because you need to see the full formation to avoid false signals.
The first candle must go against the trend and look convincing enough to suggest a possible pause or reversal. Only then can the second candle act as a rejection. The open of both candles must match almost exactly and if the second candle opens even slightly above or below, the pattern loses its meaning and should be discarded.
The strength of the second candle is the main focus of the pattern. In bullish patterns, the green candle must close well above the midpoint of the red one. In bearish patterns, the red candle must push deeply below the body of the first green one. Weak closes or candles that barely move are not worth trading. Only enter trades based on Separating Lines that meet the full criteria and show real energy in the direction of the trend.
3. Open Your Trade – Entry Point
Your entry should always follow the confirmation of the second candle and do not enter while the second candle is still forming or based on assumptions that it will close in your favor. Wait until the candle has fully printed and then assess the setup. If all the conditions are met, place your trade as close to the candle’s close as possible. The best entries are immediate since you are trading the momentum that just came back into the trend, not waiting for another pause.
Also, check where the next resistance or support is and make sure there is enough space for your trade to run. For bullish setups, confirm that you are not running into overhead resistance in the next few candles. For bearish setups, ensure there is room below to follow through before the next support zone. This helps you avoid Separating Lines that look good but fail because there was no room for the price to move.
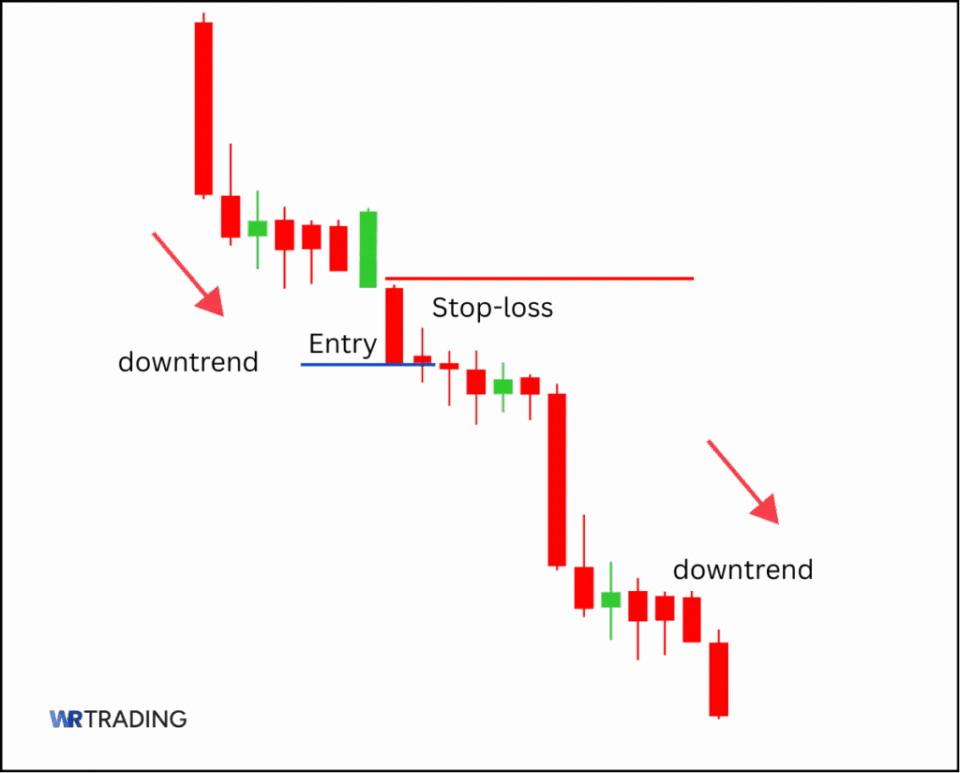
Place your stop loss just beyond the extreme of the pattern. In a bullish Separating Line, the stop should go slightly below the low of the second candle since a break beneath that level shows the trend may be failing. In a bearish setup, position your stop just above the high of the second candle, as a push above that point cancels the momentum shift back to the downside.
4. Wait For A Confirmation Or Not
The Separating Lines pattern can be traded directly after the second candle forms, but some traders prefer extra confirmation to filter out weak signals. One way to confirm is to watch for volume on the second candle. If the move comes with a clear spike in volume, it confirms that traders are backing the move and that momentum has returned. Another way is to check for a follow-through candle that moves in the same direction and closes beyond the body of the second candle.
However, waiting for confirmation can also cause you to miss the ideal entry. If the trend is strong and the Separating Lines meet all conditions, entering on the close of the second candle can give you the best reward to risk. In slower markets, or if the setup forms near key levels, confirmation becomes more useful. We’ll go over some confirmation tools that could be used with the Piercing Line later on.
5. Choose Your Trading Take Profit
Where you take profits depends on the size of the trend, the distance to the next major level, and the strength of the move that followed the pattern. The simplest method is to use the average size of the last trend swing. Measure the last leg of the trend before the pattern formed and use that range as a guide for what to expect next.
If the last push covered thirty points, your target after the Separating Lines should aim for something similar, unless strong resistance or support is closer. You can also use tools like Fibonacci extensions or a trailing stop based on Average True Range to manage your exits.
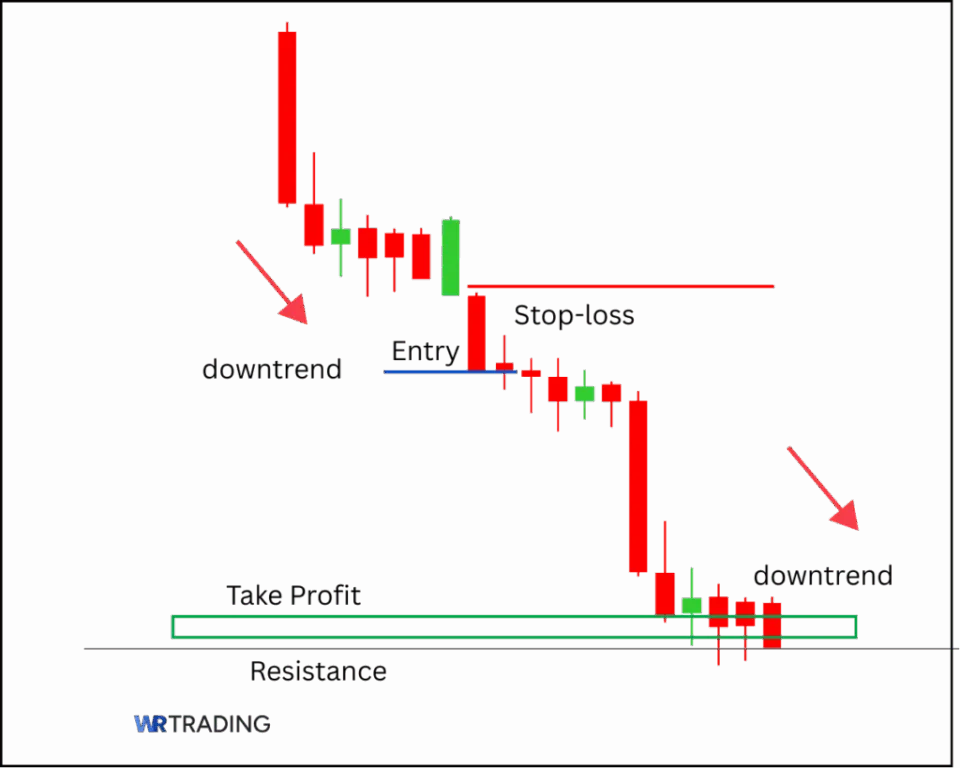
Moreover, if the pattern forms near a breakout level, you might choose to trail your stop under swing lows or above swing highs to ride the trend as far as it goes. Do not set fixed targets that ignore context to avoid losing trades. Let the chart structure tell you how far the price can reasonably go and adjust your position accordingly. The goal is not just to catch the move but to exit where the momentum starts to fade.
(Learn To Trade And Read Candlestick Patterns Like A Pro)
Which Strategies Can Be Used For The Separating Lines Candlestick Pattern?
The Separating Lines pattern works best in strong trending markets, where its structure confirms that a brief interruption has failed and momentum has returned. Traders do not rely on this signal alone. Instead, they use it as part of a larger plan that includes trend context, confirmation tools, and proper risk management. The strategies below show you how to put it all together using clear setups, detailed steps, and real-world logic.
- Continuation After Trend Confirmation
- Volume-Based Confirmation Entry
- Trendline Bounce with Separating Lines Confirmation
- Using RSI Divergence for Support
1. Continuation After Trend Confirmation
When trading the Separating Lines pattern in a well-established trend, your edge comes from reading the bigger picture before reacting to the candles. You want the market to be making clear directional progress, not moving sideways or showing conflicting signals. The pattern becomes more reliable when it appears after a brief pause that looks like a possible reversal but fails to hold. That hesitation often shakes out weak hands before the trend resumes with strength.
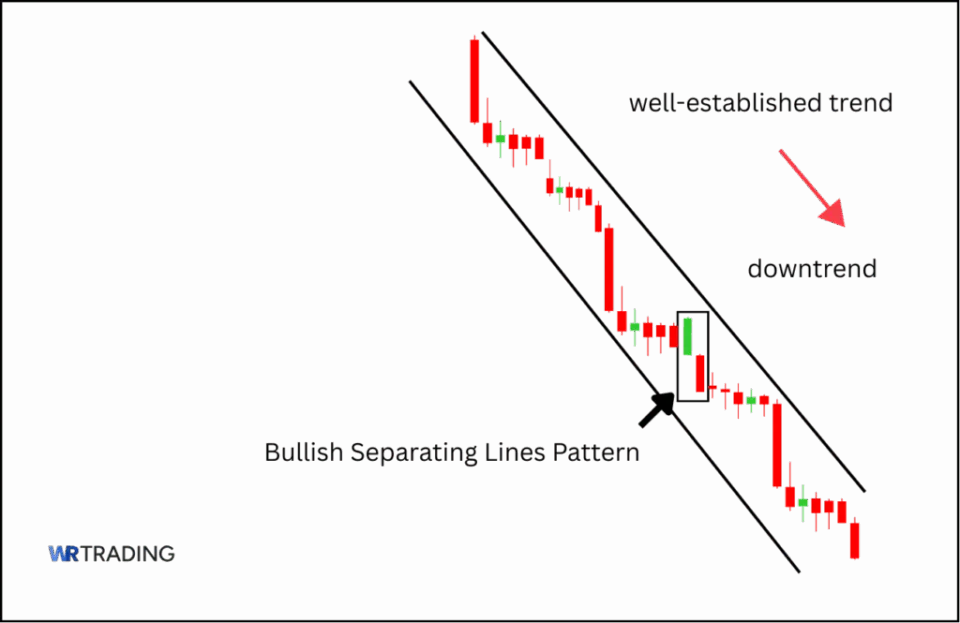
Use a moving average such as the 20 EMA as your trend filter. In bullish charts, the price should stay above the EMA with clean higher closes, and the red candle that begins the pattern should not break far below it. Once the green candle prints and finishes higher than the first, it signals the trend has held steady.
In bearish charts, the price should remain under the EMA with strong downward momentum, and the green candle should not close far above it. The red candle that follows must close lower, confirming the bounce has failed. In both versions, your stop goes beyond the pattern’s range, and your target is based on recent swing structure or the strength of the move leading into the setup.
2. Volume-Based Confirmation Entry
Volume reveals if the Separating Lines carries weight or is just chart noise. When a Separating Lines pattern prints but the volume remains weak, the move might be fake or part of a larger trap. You want to see a clear increase in volume on the second candle of the pattern. That tells you traders are stepping in, supporting the continuation of the dominant trend. Stronger volume confirms that the market agrees with what the price is suggesting.
To apply this strategy, use standard volume bars or a volume oscillator with a short lookback like 10 or 14 periods. Track how volume behaves during the Separating Lines and in the candles just before and after it. The best setups will show a dip in volume during the pullback candle, followed by a spike on the confirmation candle. This pattern of quiet followed by strong volume is a classic sign that the market was coiling for a move and is now ready to continue.
3. Trendline Bounce with Separating Lines Confirmation
The following strategy can strengthen the Separating Lines signal by combining it with a trendline that the price has respected multiple times. Draw a trendline across the lows of a bullish move or the highs of a bearish one. When the price pulls back to that trendline and prints a Separating Lines pattern, you are watching the market reject the trendline with force. This shows the line is still valid and traders are defending it.
To trade this, wait for the confirmation candle of the pattern to close and check how it interacts with the trendline. If the trendline holds and the price bounces with a strong close, you can use the low of the pullback candle as your stop.
Entry comes just after the close of the confirmation candle, and targets are set using the previous structure or the trend’s average move range. This is a classic price action method that turns the Separating Lines into a higher-probability continuation setup.
4. Using RSI Divergence for Support
Even though the Separating Lines is a continuation pattern, it can sometimes show up when the trend is stalling. The RSI can help you identify whether momentum still supports the trend or if strength is fading. Look for situations where the pattern forms and RSI shows no divergence against the trend. This confirms that the trend remains healthy and the pattern can be trusted.
Set the RSI to 14 and check whether the indicator is rising during bullish Separating Lines or falling during bearish ones. The ideal setup is when RSI dips during the first candle of the pattern and then turns back in the trend direction as the second candle forms.
That shift in RSI supports the idea that the move was just a brief pause. Avoid setups where RSI diverges sharply, since that may indicate the trend is nearing exhaustion despite what the candles suggest.
What Are the Pros and Cons of Trading the Separating Lines Candle Pattern?
The Separating Lines pattern stands out for its structure, how easy it is to read, and offering a reliable continuation signal when the market is already trending. Nevertheless, like many patterns, it comes with limitations, such as it struggles in sideways markets, depends on confirmation, and can confuse traders who misread its strict structure without proper context. Here are the pros and cons of the Separating Lines:
Pros
- Clear continuation signal
- Works well with indicators
- Good structure for entry and stop-loss
- Supports re-entries in active trends
- Easy to recognize visually
Cons
- Limited use in ranging markets
- Requires confirmation from other sources
- Strict construction criteria
- Needs trend clarity to function well
- Can be misread by beginners
What Are The Advantages Of The Separating Lines Pattern?
The Separating Lines pattern gives traders a clear visual signal that the trend is ready to continue after a short pause or pullback. This makes it an effective pattern for those who trade in the direction of momentum and need confirmation before entering. The pattern works well across different timeframes and provides structure in situations where many traders might hesitate or wait too long to rejoin a trend.
Here are some of the main advantages that make this pattern useful:
- Clear continuation signal: The Separating Lines confirms that the trend has resumed after a temporary counter move, which helps traders when entering a trade in the same direction as the broader market move. It works well in both bullish and bearish markets and does not require complex interpretation once the structure is known.
- Works well with indicators: You can combine this pattern with indicators like moving averages, volume, or RSI to add another layer of confirmation. These tools help verify if the trend has real strength behind it or whether the pullback might turn into a reversal.
- Good structure for entry and stop-loss: The Separating Lines creates a clear range for placing entry points and stop losses. Traders can use the low or high of the pattern candles as a risk boundary, which gives more control over trade planning and improves risk-to-reward ratios.
- Supports re-entries in active trends: When the market is trending but has already moved far, many traders hesitate to enter because they fear missing the move. The Separating Lines pattern gives a clean opportunity to rejoin without chasing price action, making it suitable for breakout pullbacks or trend consolidations.
- Easy to recognize visually: Once you understand the pattern’s structure, it is easy to spot on a chart without needing special tools or software. The two-candle setup is distinct and stands out in clean trends, making it beginner-friendly and consistent across timeframes.
(Learn To Trade And Read Candlestick Patterns Like A Pro)
What Are The Disadvantages Of The Separating Lines Pattern?
The Separating Lines pattern offers many benefits, but it also has limitations that can lead to poor outcomes when not understood or applied in the incorrect context. It’s a pattern that performs best in trending markets but loses accuracy in messy or slow conditions. Relying on the visual setup alone without confirming context or supporting tools can weaken its performance.
These are five drawbacks that traders should be aware of when using this pattern:
- Limited use in ranging markets: The Separating Lines loses reliability when used during sideways price action or choppy trends. In these conditions, the second candle might look convincing but lacks the momentum required to drive follow-through, which often leads to failed trades or quick reversals.
- Requires confirmation from other sources: On its own, the Separating Lines may not be enough to justify a trade. Volume, structure, or momentum indicators are often needed to confirm that the move is genuine, and traders who skip this step may enter based on a weak signal.
- Strict construction criteria: The Separating Lines is defined by the second candle opening exactly at the same price as the first. Even a slight difference in the opening price can disqualify the pattern, which makes it harder to identify unless you are manually scanning charts.
- Needs trend clarity to function well: The pattern depends on a strong, active trend to be effective. Without clear direction or volume behind the move, the two candles can mislead traders into thinking momentum has returned when the trend is actually stalling or reversing.
- Can be misread by beginners: New traders may confuse the pattern with other two-candle setups or act too quickly based on the visual appearance alone. Without proper context or education, it is easy to misinterpret what the pattern is saying about the market’s next move.
Does the Separating Lines Pattern Have Failure Signals?
Yes, the Separating Lines pattern can fail in several ways, like when the trend is weak or traders misread the signal without proper confirmation. While it works well in trending markets, there are specific failure signals that show when the setup has lost reliability. These signs show up right after the pattern forms and should be used to decide if the move is worth trading or best avoided.
- Weak Follow-Through After the Second Candle: When the second candle finishes strong but the following candles show no continuation, the pattern begins to break down. A true Separating Lines setup requires momentum to return quickly after the confirmation candle closes. If the price stalls or moves sideways, it signals hesitation and a shift in market sentiment.
- Second Candle Closes Below Previous Candle’s Open (Bullish Setup): I the second green candle fails to close above the red candle’s open, it weakens the entire pattern. The expected follow-through from buyers has not materialized, showing either lack of conviction or increased selling pressure. This variation should be treated with caution and not traded unless volume or another indicator confirms strength.
- Second Candle Closes Above Previous Candle’s Open (Bearish Setup): A bearish Separating Lines pattern loses reliability when the second red candle closes higher than the previous green candle’s open. This structure means the trend continuation has not been established and buyers are still active. When this happens, you should avoid entering short positions based on the pattern alone.
- Appears During a Sideways Market: When the pattern forms during a choppy or range-bound market, it often lacks power and context. The Separating Lines is a trend-based pattern and needs momentum to succeed. In sideways conditions, the signals can be misleading and often result in false breakouts.
- No Volume Support on Second Candle: If the second candle in the Separating Lines prints without a noticeable increase in volume, the strength behind the move is questionable. Volume is critical in confirming trend continuation because it shows the level of participation. Without it, the move may lack follow-through and become a trap.
- Second Candle Rejected by Key Level: A second candle that closes near resistance (bullish) or support (bearish) but fails to break it signals possible rejection. These levels often act as turning points when not broken cleanly. If the price immediately pulls back, it shows that the market was not ready to continue.
- Overshadowed by Larger Opposing Candle: Sometimes a strong counter candle appears right after the pattern and completely erases its progress. This shows that the attempt to continue the trend has failed and that the market may reverse or enter consolidation. It is a direct sign that the Separating Lines setup has not worked.
What Is The Success Rate Of The Separating Lines Candlestick Pattern?
There are no large-scale studies or backtests that measure the exact success rate of the Separating Lines candlestick pattern. It has not been included in academic research or public testing by sources like Bulkowski or trading firms. However, some sources cite that the hit rate ranges around 78.1% based on their research.
That said, its success rate improves significantly when used in strong trending markets. The pattern works best when price action confirms momentum before and after the setup. Traders who wait for clean confirmation, apply volume analysis, and avoid flat or choppy environments tend to find more reliable outcomes. Used correctly, the Separating Lines pattern can become a consistent trend-following tool rather than a guessing game based on candle shapes alone.
Is the Separating Lines Candlestick Pattern Suitable For Beginners?
Yes, the Separating Lines pattern is suitable for beginners because of its simple structure and how clearly it stands out on the chart. It only involves two candles, is easy to recognize in trending markets, and does not require advanced analysis to understand the basic setup.
There are also plenty of confirmation tools available, such as volume, moving averages, and momentum indicators, which help new traders decide if the trend is likely to continue before entering a trade.
Which Indicators Can Be Combined With The Separating Lines Pattern?
The Separating Lines candlestick works best when backed by tools that confirm trend continuation and reject false moves. Since the pattern focuses on a failed pullback followed by a strong return in the trend direction, the right indicators can help verify that momentum has returned and the signal is worth trading. You should never rely on the candle structure alone. Instead, combine it with tools that highlight trend strength, price confirmation, and volume activity.
- Moving Average (20 EMA or 50 EMA): The most common trend-following tool, the moving average, helps confirm that the price is still respecting the larger structure. When trading a bullish Separating Lines pattern, make sure the price is holding above the 20-period EMA and that the red candle does not close significantly below it. For bearish patterns, the price should stay beneath the EMA and the second candle must close lower to confirm continuation. The moving average keeps you aligned with the broader direction.
- Volume Indicator (Standard or Volume Profile): Volume helps confirm that the second candle in the pattern is backed by real market interest. A rise in volume during the second candle shows that the counter move has been rejected and traders are supporting the trend. If the volume stays low, it may signal indecision. Use this to filter out weak setups that may otherwise look valid on price action alone.
- RSI (Set to 14): The Relative Strength Index shows momentum conditions. In bullish Separating Lines setups, the RSI should stay above 40 or bounce higher after the pattern forms. For bearish cases, it should remain under 60 and start moving lower once the pattern completes. RSI confirms whether the market has enough strength to carry the move forward.
- MACD (12,26,9): The MACD is a powerful way to confirm that the trend is gaining momentum again. After the Separating Lines pattern prints, look for the MACD line to cross the signal line in the direction of the trade. Bullish setups gain strength when the crossover happens below the zero line and starts curving upward. Bearish setups need the opposite, a clean downward cross showing pressure is back.
- Average True Range (ATR) – 14 Period: The ATR tracks recent volatility and helps with setting stop loss and take profit levels. After a Separating Lines pattern forms, check if ATR is stable or rising. High ATR levels suggest follow-through is more likely. Use the ATR reading to place your stop beyond the low or high of the second candle, giving the trade space to work without being too loose.
- Bollinger Bands (20,2): Bollinger Bands are useful when the Separating Lines forms near the outer edge of the band. A bullish setup near the lower band that snaps back up is stronger when followed by a close above the midline. For bearish patterns, look for prices rejecting the upper band and returning lower. Use the bands to check how extended the price move was before the pattern formed.
- ADX (Average Directional Index) – Set to 14: ADX confirms the presence of a trend and if it has strength. Values above 25 show the trend is active and can support a continuation pattern. When the Separating Lines pattern appears and ADX is rising, you have a strong case to trade the move. If ADX is flat or low, the pattern might appear valid but has a low probability of success.
(Learn To Trade And Read Candlestick Patterns Like A Pro)
What Are Similar Patterns To The Separating Lines Pattern?
The Separating Lines pattern is built for continuation trades in trending markets, and while they stand out for their opening alignment and directional commitment, other patterns can offer similar clarity under the right conditions.
Each of the alternatives listed below helps traders spot strong sentiment, re-entry setups, or trend-confirming signals when the market pauses and then resumes. What separates them is how they form, what they reveal about market structure, and when to act on them.
| Pattern Name | Main Characteristics | Best Use Case |
|---|---|---|
| Mat Hold | Five-candle continuation pattern where the trend pauses briefly before surging again. Starts with a strong move, followed by three small candles, and finishes with a breakout. | Best used in established trends when the price pauses for a moment. The entry comes on the final candle as the price confirms that the pullback was shallow and strength remains. |
| Rising Three Methods | A strong bullish candle is followed by three small bearish candles that stay within its range, then a final bullish candle pushes higher and breaks resistance. | Works well during strong uptrends to confirm that the market is taking a pause for gains. The final candle provides a clean continuation entry above the pattern. |
| Three White Soldiers | Three strong bullish candles form consecutively, each closing higher with little to no wick. Reflects powerful sentiment and momentum. | Best used after a major support test or during breakout conditions when momentum has clearly shifted. Offers strong entry signals without hesitation. |
| Three Black Crows | Three long bearish candles open within the previous body and close lower, indicating sustained selling pressure without retracement. | Ideal after a failed rally or false breakout. The consistent downward closes signal a change in direction and an opportunity to follow the momentum. |
| Bullish Kicker | A sudden bullish reversal pattern where a red candle is followed by a green candle that opens at or above the previous open and closes higher. | Useful when momentum shifts suddenly in favor of buyers. The gap in opening price confirms that sentiment has changed sharply. |
Find more alternative patterns in our All Candlesticks Pattern PDF for free on WR Trading.
What Is The Difference Between The Separating Lines and The Mat Hold Pattern?
The Separating Lines and Mat Hold patterns are both continuation formations, but they differ in length, structure, and the kind of trend behavior they reflect. Separating Lines is made up of two candles and gives you a fast continuation signal after a short-term interruption. Meanwhile, the Mat Hold is a five-candle pattern that reflects a slower and more controlled form of trend continuation.
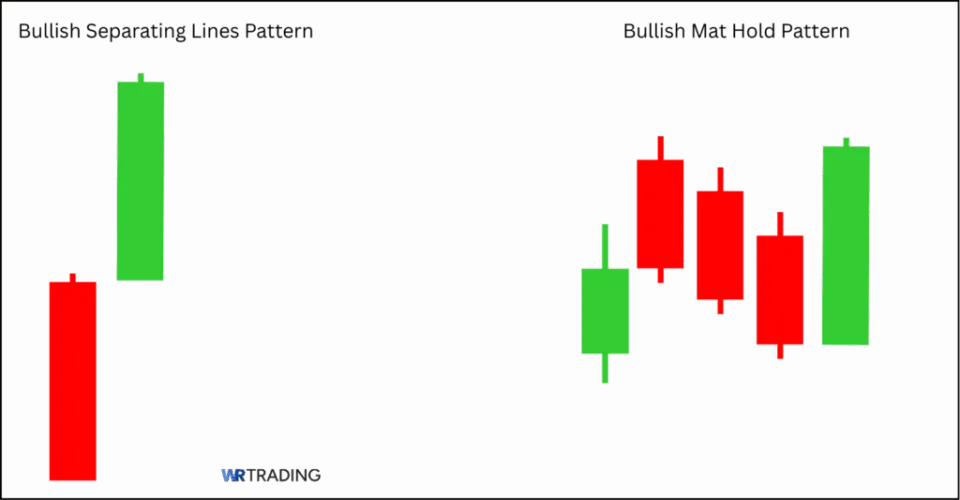
It starts with a strong candle in the direction of the trend, followed by three smaller candles that pause or drift sideways. The final candle breaks back in the trend’s direction and confirms that momentum is continuing. This setup shows a market that is resting before continuing rather than rejecting a pullback.
| Section | Separating Lines | Mat Hold |
|---|---|---|
| Construction | First Candle: Moves against the direction of the trend, appearing like the start of a reversal. Second Candle: Opens at the exact same price as the first candle and closes strongly in the direction of the prevailing trend. | First Candle: A large candle moving in the direction of the trend. Second to Fourth Candles: Small-bodied candles that remain within the range of the first. Fifth Candle: A strong continuation candle that breaks above or below the entire structure, confirming the trend is resuming. |
| Forecast | Signals fast resumption of the dominant trend after a failed counter move. | Suggests the trend is pausing temporarily and is likely to continue after consolidation. |
| Type of Pattern | Two-candle trend continuation pattern. | Five-candle trend continuation pattern. |
| Trend Prior to Pattern | Appears during a strong, clear trend that experiences a momentary pullback or hesitation. | Forms in active trends after a strong impulse move, signaling a pause before the next leg. |
| Best Use Case | Works best in fast-moving trends where a minor counter candle creates hesitation, followed by a quick return to strength. | Most effective when the trend is mature and the market shows signs of orderly consolidation before continuing. |
(Learn To Trade And Read Candlestick Patterns Like A Pro)
What Is The Difference Between The Separating Lines and The Thrusting Candlestick Pattern?
The Separating Lines and Thrusting patterns are both two-candle formations that appear in trending markets, but their structure and meaning are different. The Separating Lines pattern delivers a strong continuation message by opening the second candle at the exact same price as the first and closing in full alignment with the trend.
The Thrusting pattern has a weaker tone and leaves more room for interpretation. While it also has two candles and forms during an existing trend, the second candle in this case does not reclaim full control. Instead, it pushes into the body of the first candle but fails to close beyond its midpoint, creating a partial retracement that shows hesitation rather than conviction.
Traders often interpret this as a pause rather than a commitment, and the setup requires additional context or indicators to become reliable. In short, the Separating Lines reinforces the strength of the trend, while the Thrusting pattern simply signals that the pullback might be running out of momentum but has not been completely rejected.
| Section | Separating Lines Pattern | Thrusting Pattern |
|---|---|---|
| Construction | First Candle: A strong candle against the trend (red in bullish version, green in bearish version). Second Candle: Opens at the same level as the first candle’s open and closes strongly in the direction of the trend. | First Candle: A strong candle in the direction of the trend. Second Candle: Moves in the opposite direction, closes within the body of the first but does not pass its midpoint. |
| Forecast | Signals a strong continuation of the current trend after a failed attempt to reverse. | Suggests a potential pause or minor retracement, but without strong conviction of trend resumption. |
| Type of Pattern | Two-candle continuation pattern. | Two-candle hesitation pattern. |
| Trend Context | Appears during well-established trends after a brief interruption. | Forms in ongoing trends, but during mild counter-moves that lack momentum. |
| Strength of Signal | Strong, direct signal that the trend remains intact. | Moderate to weak signal that may need confirmation. |
| Best Use Case | Used to re-enter the market in the direction of the trend after a quick pullback. | Watched for signs that the countertrend move is slowing, sometimes used to anticipate a continuation. |
What Are The Limitations Of The Separating Lines?
The Separating Lines candlestick pattern offers a clear view of trend continuation, but it has limits like performing badly in sideways markets, not being ideal for short timeframes, and can be confused with other patterns. These are the main drawbacks you should be aware of before trading this pattern.
- Unreliable without context or confirmation from volume or trend tools.
- Requires precise candle alignment or the pattern loses meaning and becomes useless.
- Performs poorly in sideways markets or when momentum is flat.
- Can appear similar to other continuation patterns, leading to confusion.
- Not ideal on lower timeframes where noise can distort the second candle’s strength.
- May form during news or volatility spikes, which can create false signals.
- Loses value when used in trends that are already extended or exhausted.
Learn Pattern Trading With the WR Trading Mentoring
The WR Trading mentoring program teaches you how to recognize patterns like the Separating Lines based on structure, not just signals. You are trained to look at price action through a wider lens, where each candle is analyzed in-depth. With the Separating Lines pattern, you learn how to confirm that the trend is resuming, what tools to use to validate the setup, and when the market conditions support continuation rather than reversal.
Instead of memorizing chart examples, you build your skill by working through real setups in live sessions and structured chart work. You learn how to track momentum, manage risk, and apply rules that help remove guesswork from your trades. Each part of the mentoring process focuses on clarity, repetition, and correct execution under pressure. The goal is not to chase signals, but to develop consistent decision-making that holds up in any market condition.
(Learn To Trade And Read Candlestick Patterns Like A Pro)
Conclusion: The Separating Lines Is a Powerful Beginner-Friendly Candlestick Pattern
The Separating Lines candlestick pattern gives traders a reliable way to stay with strong trends without chasing entries or getting shaken out by minor pullbacks. When it forms with a clear structure and matches the dominant direction of the market, it tells you that momentum has not faded and that the trend is ready to continue.
We showed how to read both the bullish and bearish versions, how to confirm them, and which tools can improve your accuracy. From our experience, this pattern works best when you do not try to force it into sideways conditions or weak trends. It is not a reversal signal, and using it in the wrong context can lead to premature entries.
However, when traded correctly, it offers clean setups with logical stops and targets. We recommend combining it with basic volume confirmation, trend filters like moving averages, and a clear understanding of where the market is in its overall structure. Used properly, the Separating Lines pattern can become one of the most practical continuation tools in your trading plan.
FAQ: Frequently Asked Questions on Separating Lines Candlestick Pattern
What Is the Separating Lines Candlestick Pattern?
The Separating Lines is a two-candle continuation pattern that shows trend momentum resuming after a brief interruption. The first candle moves against the trend, followed by a second candle that opens at the same price and closes in the trend direction. It signals that the original trend has rejected the pullback and is ready to continue.
How Do I Identify a Valid Separating Lines Setup?
Look for a strong trending market, followed by a single candle that temporarily moves in the opposite direction. The second candle must open at the same price as the first and close in the direction of the original trend with conviction. Any deviation from this structure weakens the signal.
What Is the Difference Between Bullish and Bearish Separating Lines?
Bullish Separating Lines form in an uptrend and involve a red candle followed by a green one that continues the move higher. Bearish Separating Lines occur in downtrends and involve a green candle followed by a red one that resumes the selling. The core structure remains the same, but the direction and color of the candles are reversed.
Can the Separating Lines Pattern Fail?
Yes, the pattern can fail when the trend is weak or the second candle lacks strength. It also fails when the opening prices of both candles do not match closely or when the price action becomes choppy. Always confirm with market context and avoid setups in unclear trends.
Is the Separating Lines Pattern Good for Beginner Traders?
Yes, it’s simple to identify and easy to understand when viewed in the right context. Beginners benefit from its clear structure and the way it works with popular confirmation tools. It helps reinforce trend-following habits and avoids overcomplicating entries.