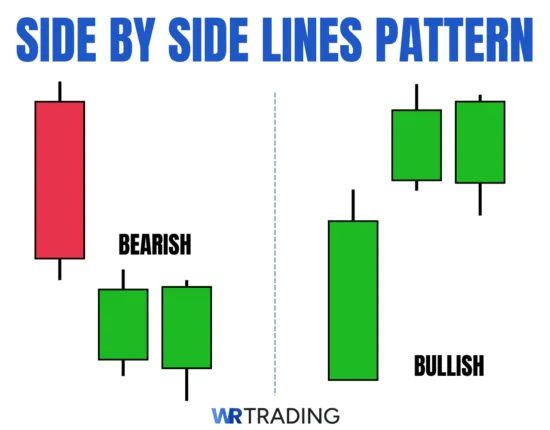
The Side By Side White Lines is a continuation candlestick pattern that appears in both bullish and bearish forms, signaling that the current trend is likely to continue. It typically consists of three candles: a strong trend candle, followed by two smaller candles of the same color that open around the same level and stay close in range – a clear sign that momentum is holding steady rather than reversing.
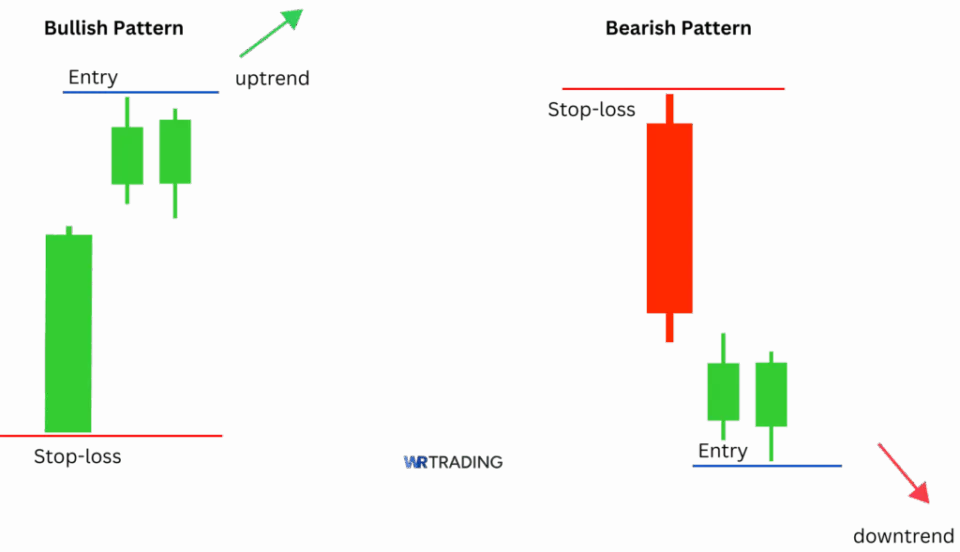
In its bullish form, the pattern emerges during an uptrend, with the first candle showing strong buying pressure, and the second and third candles reflecting a brief pause or consolidation – but without a loss of conviction from the bulls. In the bearish version, the same logic applies in reverse, with consistent selling pressure confirmed.
To trade this pattern, you’ll first want to identify that it’s forming within a clear existing trend. Once the pattern has fully formed (after all three candles have closed), a continuation entry can be considered when the price breaks above the third candle in a bullish version, or below it in a bearish one – ideally with confirming volume or momentum indicators.
Used correctly, the Side By Side White Lines pattern can provide clean, low-conflict entries that align with the dominant trend. While not as flashy as reversal setups, its subtle consistency often pays off when you’re trading with the broader market context, not against it. At WR Trading, we’ve delved deep into the intricacies of this pattern, testing its efficacy across different market conditions. Our experience underscores the importance of not only recognizing the pattern but also integrating it into a comprehensive trading strategy.
(Learn To Trade And Read Candlestick Patterns Like A Pro)
What is a Bullish Side By Side White Lines Pattern?
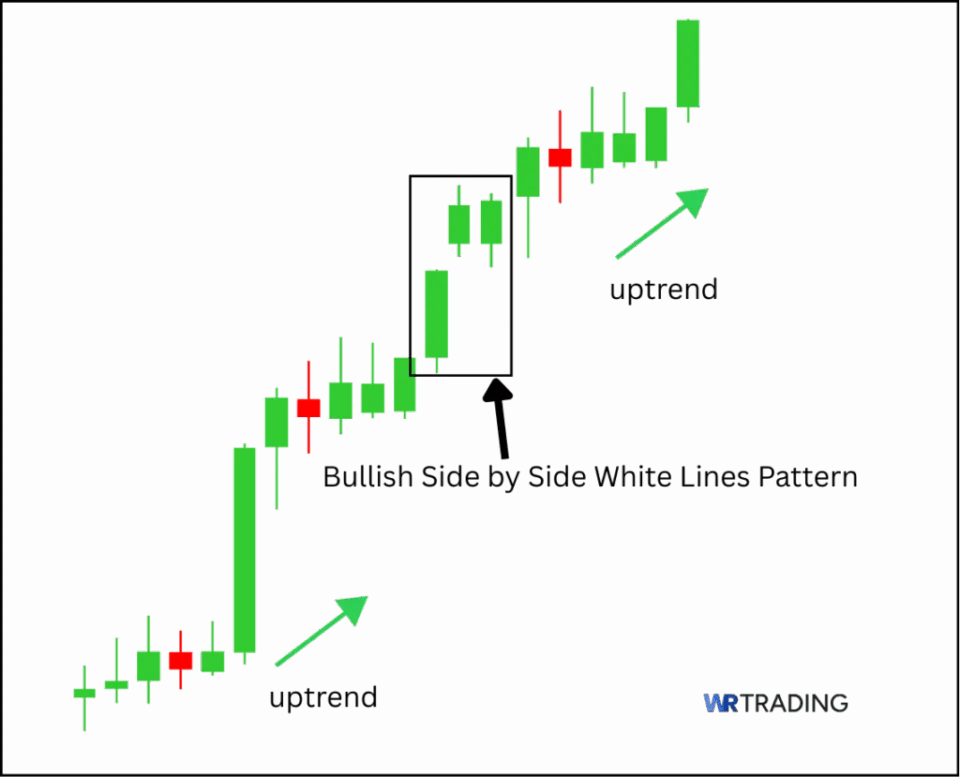
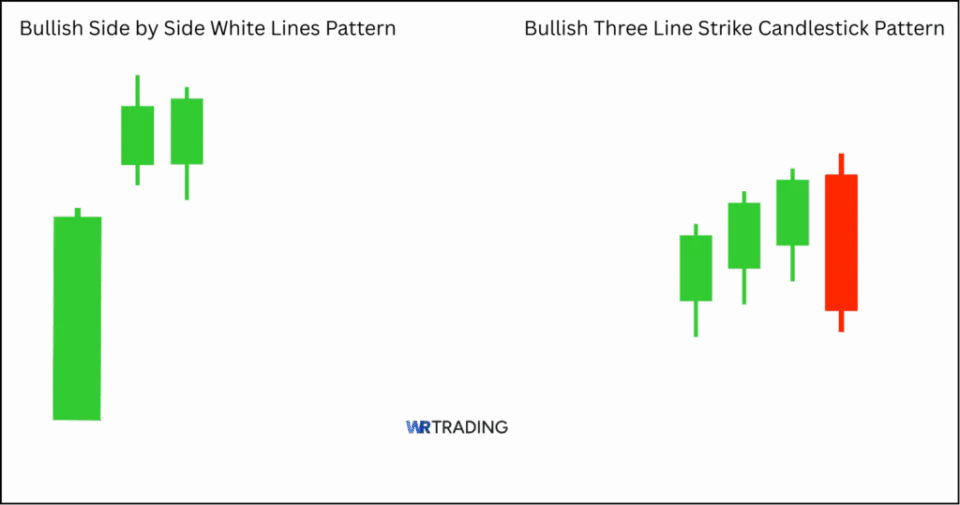
The Bullish Side By Side White Lines pattern is a three-candle formation that typically appears during an uptrend, signaling the continuation of bullish momentum. It consists of a long white (or green) candle, followed by two smaller white candles that open at or near the same price level, forming a visual alignment on the chart.

Key Facts of The Bullish Side By Side White Lines Pattern:
- Type of pattern: Continuation
- Construction characteristics: First candle is a long white body; second and third candles are smaller white bodies opening at or near the same price level.
- Trend prior to pattern: Uptrend
- Trade forecast: Continuation of the bullish trend.
- Interpretation: Indicates sustained buying pressure and market confidence.
- Stop-loss placement: Below the low of the first candle.
- Opposite pattern: Bearish Side By Side White Lines
- Success rate: Approximately 66% in predicting bullish continuations.
What is a Bearish Side By Side White Lines Pattern?
Conversely, the Bearish Side By Side White Lines pattern emerges during a downtrend, suggesting the continuation of bearish momentum. It features a long black (or red) candle, followed by two smaller white candles that open at or near the same price level, indicating a temporary pause before the downtrend resumes.
Key Facts of The Bearish Side By Side White Lines Pattern:
- Type of pattern: Continuation
- Construction characteristics: First candle is a long black body; second and third candles are smaller white bodies opening at or near the same price level.
- Trend prior to pattern: Downtrend
- Trade forecast: Continuation of the bearish trend.
- Interpretation: Reflects temporary buying interest before sellers regain control.
- Stop-loss placement: Above the high of the first candle.
- Opposite pattern: Bullish Side By Side White Lines
- Success rate: Moderate reliability; 55 – 65%, effectiveness increases with additional confirmation.
(Learn To Trade And Read Candlestick Patterns Like A Pro)
How is the Side By Side White Lines Pattern Formed?
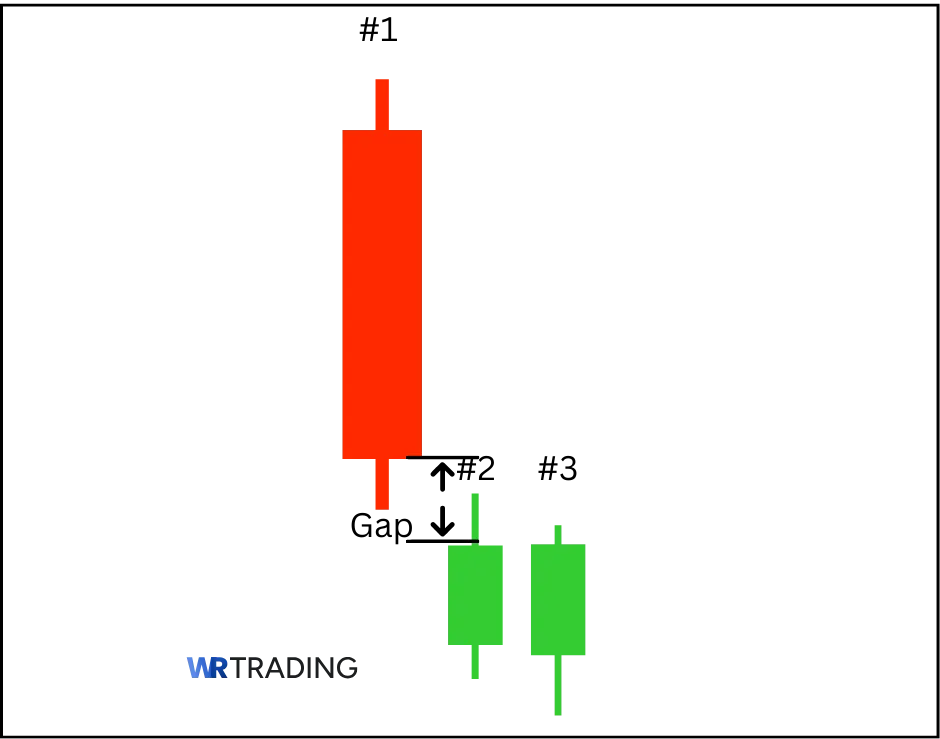
The formation of the Side By Side White Lines pattern involves three candles:
- First candle: A long-bodied candle in the direction of the prevailing trend (white for bullish, black for bearish).
- Second candle: A smaller candle of the opposite color that opens at or near the same price level as the first candle.
- Third candle: Another small candle of the same color as the second, also opening at or near the same price level.

This structured formation typically occurs over three trading sessions and is more significant when it appears after a strong trend, indicating a potential continuation.
What does the Side By Side White Lines Candlestick Pattern Mean?
The Side By Side White Lines pattern reflects a temporary consolidation in the market, where the prevailing trend pauses before resuming. It’s a continuation candlestick pattern that typically forms in the midst of a well-established trend, either bullish or bearish.
It reflects a brief pause in momentum, where the dominant side (buyers or sellers) momentarily consolidates before continuing in the same direction. The pattern consists of three candles, and its reliability lies in the fact that no real reversal pressure enters the market during its formation.
In breaking down the psychological and technical meaning of each candle within the pattern, we see:
- First Candlestick – a strong trend candle: In the bullish version, this is a long white (or green) candlestick that confirms buyer dominance. It represents a continuation of an uptrend, showing strong market conviction and aggressive buying. In the bearish form, the first candle is a long red candle, continuing the downtrend with heavy selling pressure.
- Second Candlestick – a smaller candle gaps away but opens near the previous close: Second Candlestick – a white (bullish) candle that gaps away but opens near the previous candle’s close: In the bearish variant, this candle gaps down and opens near the close of the preceding large black (bearish) candle. Despite being white (or green), it signals only a brief pause or consolidation in the downtrend rather than a reversal. Importantly, there is no sign of strong bullish opposition, just a leveling off, indicating that the bears remain in control and are preparing for the continuation of the downtrend. In the bullish variant, the second candle gaps up and opens near the close of the preceding large white (bullish) candle. It signals a temporary consolidation or pause in the ongoing uptrend. The candle maintains the same bullish sentiment, reinforcing that the bulls are still dominant and the upward trend is likely to continue without interruption.
- Third Candlestick – another candle matching the second in range and sentiment: The third candle mirrors the second, opening around the same level and again closing in the direction of the prevailing trend. This repetition suggests control remains with the same side, bulls in an uptrend, or bears in a downtrend, and that the temporary pause is not the beginning of a reversal, but simply a momentary regroup.

In interpretation, the pattern shows a sequence of strong momentum → consolidation → reaffirmed control. The alignment of the second and third candles, with no meaningful pushback from the opposing side, confirms that the trend is likely to continue.
From a psychological perspective, the Side By Side White Lines pattern tells us that the market is not in conflict, there’s no significant indecision or reversal pressure, just a shallow breath before the next move. Traders often view this pattern as a signal to stay in an existing trend, or in some cases, as a low-risk opportunity to join it, especially when confirmed by momentum indicators or a breakout above/below the third candle.
While less dramatic than reversal setups, this pattern’s quiet consistency offers high utility when traded in the direction of the dominant move, particularly in trending forex, equity, or futures markets. The appearance of two small candles after a strong move signifies indecision, but the alignment suggests that the dominant trend is likely to continue.
Indeed, other patterns are far more indicative of a change in direction, and it’s important not to be confused by the Side By Side White Lines pattern and interpret it as a reversal-it’s indicative of a continuation.
Where does the Name of the Side By Side White Lines Pattern come from?
The name “Side By Side White Lines” derives from the visual appearance of the two smaller white candles that align horizontally on the chart, resembling white lines placed side by side.
(Learn To Trade And Read Candlestick Patterns Like A Pro)
An Example of the Side By Side White Lines Pattern
To illustrate how the pattern unfolds in a real-world context, let’s use the EUR/USD forex pair during a well-established bullish trend.
First candle: A long green candle (opens at 1.1000, closes at 1.1100)
This initial candle confirms strong bullish momentum. It opens lower and pushes upward steadily, closing near the session high. The absence of long wicks shows minimal opposition from sellers, and the size of the candle reflects strong conviction from buyers.
Interpretation:
- Buyers are clearly in control.
- Bullish sentiment dominates the market.
- Momentum is firmly to the upside.
Second candle: A smaller green candle (opens at 1.1105, closes at 1.1120)
This candle opens just above the previous close, with a modest upward range. It’s smaller in size, indicating a pause in momentum, but it closes higher, maintaining the bullish direction. There’s no significant wick to the downside, showing no meaningful bearish pressure.
Interpretation:
- Momentum slows, but bullish intent remains intact.
- The gap-like open suggests ongoing optimism.
- Buyers are consolidating gains, not retreating.
Third candle: Another small green candle (opens at 1.1100, closes at 1.1130)
This third candle opens near the same level as the second and also closes higher. The proximity of the two smaller candles in both open and body range gives the classic “side by side” look. This repetition confirms the continuation bias, the bulls are holding their ground and steadily advancing.
Interpretation:
- Consolidation continues without disruption.
- Buyers maintain control across all three sessions.
- The pattern reflects stability, not indecision.
By way of final analysis, this three-candle sequence doesn’t signal a reversal, rather, it reinforces the continuation of the current bullish trend. Here’s what the story tells us:
- A strong uptrend is already in place (first candle).
- A short consolidation follows, with no bearish pressure (second candle).
- The bulls quietly reaffirm control with a nearly identical third candle (third candle).
From a trading perspective, the Side By Side White Lines pattern is a signal to stay with the trend or even consider adding to an existing long position, especially if confirmed by volume upticks or a breakout above the third candle’s high. In a bearish version of the pattern, the logic is identical but flipped, supporting trend continuation to the downside.
To summarize this example (EUR/USD):
- First candle: Long green candle opens at 1.1000, closes at 1.1100.
- Second candle: Smaller green candle opens at 1.1105, closes at 1.1120.
- Third candle: Another small green candle opens at 1.1100, closes at 1.1130.
The tight structure and upward closes signal that the bulls are still firmly in control, and the trend is likely to continue. This type of pattern offers clean trend confirmation for disciplined traders looking to trade with momentum and minimize second-guessing.
(Learn To Trade And Read Candlestick Patterns Like A Pro)
How to Identify the Side By Side White Lines Pattern?
To identify the Side By Side White Lines pattern, begin by confirming that the market is in a clearly defined trend, either upward or downward. This is a continuation pattern, so it only holds significance when it appears within an existing move, not in sideways or uncertain market conditions.
- First candle: Look for a long-bodied candle in the direction of the current trend. In the bullish version, this is a strong green candle reflecting confident upward momentum. In the bearish version, it’s a long red candle showing persistent selling pressure. This first candle sets the tone and confirms that the dominant side is in control.
- Second candle: The second candle is a smaller-bodied green candle, opening near the close of the first candle. In most cases, there will be a small gap or slight offset, but the important factor is that it maintains alignment with the prevailing trend. This candle is narrower in range, signaling a short pause or consolidation in momentum, but not a reversal.
- Third candle: The third candle should also be small in body size, and should open near or at the same price as the second candle. It follows through slightly in the same direction but again does not show any significant volatility or opposition. This tight clustering of two smaller candles gives the “side by side” appearance that gives the pattern its name.
Together, the three candles suggest a period of orderly consolidation following a strong move, without any meaningful challenge from the opposing side. The pattern is valid in both bullish and bearish contexts, as long as it follows a consistent trend and the two smaller candles remain aligned and supportive of that trend.
The trick to identifying this pattern is to note a strong trend candle to begin the sequence, two smaller, same-colored candles that open around the same level and move in the same direction, along with no significant wicks or volatility that would suggest market hesitation or reversal risk.
Once the pattern has fully formed, traders typically wait for a break above the high (in bullish setups) or below the low (in bearish setups) of the third candle to confirm the trend continuation. While it’s a relatively quiet and subtle formation, it’s highly reliable when paired with volume support or trend-following indicators like moving averages or ADX.
Without that confirmation candle or supportive context, the Side By Side White Lines pattern should be treated cautiously and not traded in isolation.
How to Trade the Side By Side White Lines Pattern?
Trading this pattern involves several steps that consider its meaning and the psychology behind its formation:
1. Find the Right Setup for the Side By Side White Lines
The overall visual structure of this pattern consists of three candles, beginning with a strong trend candle, followed by two smaller candles of the same color, each opening around the same level. The two smaller candles appear “stacked” side by side, giving the pattern its distinctive name. This alignment represents a momentary pause in momentum, not a reversal.
To find the correct setup, look for this pattern within a well-established trend, either a clear uptrend or downtrend. The ideal context is one where the market is making consistent higher highs and higher lows (for bullish patterns) or lower highs and lower lows (for bearish patterns). Spotting this formation after a strong trending move, especially near a significant support or resistance level, can offer high-probability continuation signals.
Use your broader technical analysis, such as trendlines, moving averages, or ADX, to confirm that the trend is healthy and not exhausted. When the Side By Side White Lines pattern emerges in this environment, it signals that the prevailing side is consolidating temporarily before continuing in the same direction.
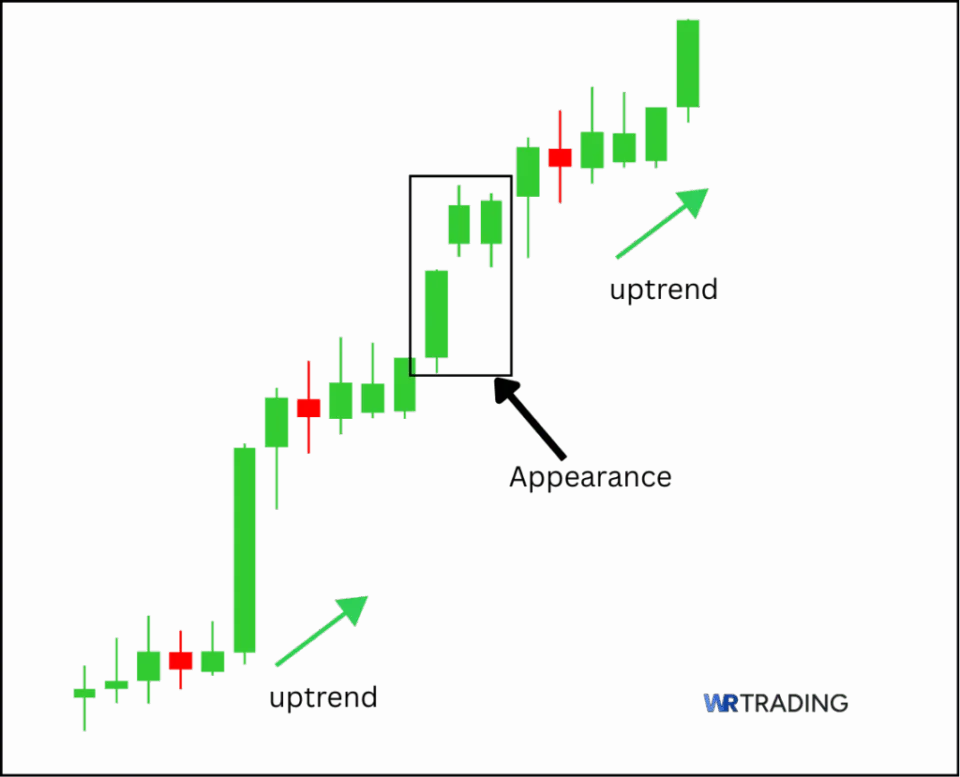
2. Wait for the Appearance of the Side By Side White Lines Candlestick Pattern
Monitor the chart for the formation of the three-candle pattern, ensuring that the two smaller candles are aligned and follow the initial long-bodied candle.
3. Open Your Trade – Entry Point
Enter the trade in the direction of the prevailing trend after the pattern is confirmed. Set a stop-loss below the low of the first candle for a bullish pattern or above the high for a bearish pattern. Determine your position size based on your risk management strategy and the types of assets you’re trading.
4. Wait for a Confirmation or Not
Once the Side By Side White Lines pattern has formed, the next decision is whether to enter your trade immediately or to wait for additional confirmation. This will largely depend on your trading style, your risk management approach, and how aggressively or conservatively you prefer to trade continuation setups.
Option 1: Wait for Confirmation (More Conservative)
Some prefer to wait for confirmation of the continuation before opening a position. While the pattern itself suggests trend persistence, confirmation helps filter out false signals, particularly in slower or less liquid markets.
Common confirmation signals include:
- A strong breakout candle in the direction of the trend (bullish or bearish), closing above the high (in uptrends) or below the low (in downtrends) of the third candle in the pattern.
- Volume spike supporting the breakout, suggesting renewed interest and strength from institutional or high-volume traders.
- Continuation signal from a momentum indicator, such as:MACD histogram or signal line continuing in the direction of the trend, the RSI staying above 50 (in uptrend) or below 50 (in downtrend), or a bounce from a dynamic support/resistance level (e.g., 20 EMA or 50 EMA) that coincides with the pattern.
The pros of this approach are that it avoids entering during false consolidations or temporary pauses that don’t follow through, and it also adds confidence through data-backed confirmation.
Cons include the fact that it may result in a delayed entry, reducing your risk-to-reward ratio, and you might miss the optimal entry point if the trend resumes quickly.
Option 2: Enter Immediately After the Pattern (More Aggressive)
Some other traders will choose to enter as soon as the third candle closes, especially if all three candles appear clean, orderly, and in a strong trending context. This anticipates the continuation before confirmation appears, aiming to capture more of the move.
The entry tactic is:
- In a bullish pattern, place a buy stop just above the high of the third candle.
- In a bearish pattern, place a sell stop just below the low of the third candle.
- Set a tight stop-loss just beyond the second candle’s low/high or behind a key moving average.
With this approach, the benefits are that it enables early positioning with better entry pricing and higher potential return, and allows you to capitalize on explosive momentum if the trend resumes swiftly.
On the other end of the stick, there is a higher risk if the trend stalls or reverses, and it requires greater discipline, precision, and often tighter stops.
Ideal Entry and Risk Management Strategy
Regardless of whether you wait for confirmation or enter early, a structured approach will help protect capital and improve consistency.
- Entry Conservative: Enter after a strong candle breaks and closes beyond the third candle’s high (bullish) or low (bearish).
- Entry Aggressive: Enter on the open of the next candle or set a pending order just beyond the third candle.
- Stop-loss: Place just beyond the minor consolidation of the two small candles. For tighter setups, consider the low/high of the third candle with appropriate position sizing.
- Take-profit: Target a 2:1 or 3:1 reward-to-risk ratio, and use measured move projections, previous swing highs/lows, or Fibonacci extensions to help set realistic exits.
While the Side By Side White Lines pattern is a relatively dependable continuation signal, it should still be used as part of a broader trading plan. Waiting for confirmation via price action or supporting indicators can significantly improve its success rate, especially in volatile or uncertain conditions.
5. Choose Your Trading Take Profit
Set your take profit level based on previous price targets or support/resistance levels, while also ensuring that the risk-reward ratio aligns with your trading plan.

(Learn To Trade And Read Candlestick Patterns Like A Pro)
Which Strategies can be used for the Side By Side White Lines Candlestick Pattern?
The Side By Side White Lines pattern offers you a clean, structured continuation signal that can be enhanced by several trading strategies. While the pattern alone reflects temporary consolidation within a trend, combining it with supporting tools and techniques helps confirm its reliability and sharpen your edge.
1. Volume-based Strategy
With this strategy, focus on volume behavior during and immediately after the formation of the pattern. Ideally, volume remains steady or slightly diminished during the second and third candles (indicating a calm pause), then surges on the breakout candle that follows.
This volume expansion confirms that the dominant side (buyers in a bullish setup, sellers in a bearish one) is regaining momentum and continuing the trend. This approach work because this pattern represents quiet consolidation. A rise in volume on the breakout confirms market conviction and validates the trend continuation.
Tip: Look for volume acceleration on the candle that breaks above (or below) the pattern’s range. Avoid entries on low-volume drift.
2. Breakout Strategy
This method involves placing a buy stop (in bullish patterns) just above the high of the third candle, or a sell stop (in bearish patterns) just below the low. You’ll enter the trade when price breaks cleanly beyond the pattern.
To manage the trade:
- Place a stop-loss just beyond the consolidation range (below the low of the third candle for bullish setups).
- Use a trailing stop or predefined target based on recent price structure or volatility.
This works because the Side By Side White Lines pattern signals trend continuation, a breakout confirms that price is resuming its previous direction.
Tip: For added safety, wait for a full candle close beyond the pattern rather than entering on a wick.
3. Indicator-based Strategy
Pair the pattern with technical indicators like:
- RSI (confirming momentum above 50 in an uptrend or below 50 in a downtrend)
- MACD (look for signal line alignment with the trend)
- ADX (a rising ADX above 25 can confirm trend strength)
These indicators help reinforce the idea that momentum remains in favor of the trend, especially useful when the Side By Side White Lines pattern forms after a parabolic move, and it works because this is a subtle pattern, and indicators help quantify hidden strength that isn’t always clear from price alone.
Tip: Look for RSI continuation, not reversal. An RSI > 55 during a bullish pattern strengthens the signal.
4. Support/Resistance Strategy
Look for the Side By Side White Lines forming near a resistance (in bullish trends) or key support (in bearish trends) level. The pattern is more dependable when it bounces off a known level and resumes the trend.

This is especially effective when:
- The pattern occurs after a pullback to support in an uptrend.
- The pattern forms at a prior consolidation breakout zone.
It works because the pattern alone signals continuation. If it forms at a respected technical level, that confluence increases confidence and precision.
Tip: Use Fibonacci retracement levels, prior highs/lows, or moving averages to spot these zones.
5. News-based Strategy (Fundamental Overlay)
Always check the economic calendar for upcoming high-impact news that may affect your setup. In a trending market, if the pattern forms ahead of news that supports the trend, it can signal a powerful follow-through move.
For example: If you’re trading EUR/USD and the pattern forms ahead of bullish euro data, it reinforces the continuation. This succeeds because when fundamentals and technicals align, momentum often accelerates in the pattern’s direction, turning a moderate move into a breakout run.
Tip: Avoid opening trades just before major news releases, unless your plan includes volatility buffers or wider stops.
6. Combining Strategies for Higher Probability Setups
The best trades often use multiple strategies in unison, like:
- A Breakout Strategy confirmed by a rising MACD and increased volume
- A Support Zone Setup validated by RSI staying strong above 50
Avoid trading the Side By Side White Lines pattern in isolation, while reliable, it performs best as part of a multi-factor strategy with clearly defined entry and exit rules.Always consider risk-to-reward ratios and use the pattern’s tight structure to place efficient stop-loss orders just beyond the consolidation zone.
(Learn To Trade And Read Candlestick Patterns Like A Pro)
What is the Success Rate of the Side By Side White Lines Candlestick Pattern?
The Bullish Side By Side White Lines pattern has a success rate of approximately 66% in predicting bullish continuations. The Bearish Side By Side White Lines pattern shows a moderate reliability, with an average 6% price movement within 10 days in a downtrend.
This is considered a moderate success rate in forecasting trend continuations. According to Thomas Bulkowski, the bullish variant of this pattern functions as a continuation signal approximately 66% of the time, based on an analysis of over 4.7 million candle lines.
Similarly, the bearish version of the Side By Side White Lines pattern is considered rare and demonstrates moderate reliability. Studies have shown that over 60% of these patterns result in an average 6% price movement within ten days when occurring in a downtrend .
If anything, this indicates that while the pattern can be a useful tool in technical analysis, it should not be relied upon in isolation. Factors that influence the hit rate:
- Market conditions: Volatility and trend strength (the effectiveness of this pattern can vary depending on market conditions and should be used in conjunction with other technical indicators and risk management strategies).
- Volume: Higher volume can increase the efficacy of the pattern, as it’s indicative of a sustained trend.
Is the Side By Side White Lines Candlestick Pattern Suitable for Beginners?
The Side By Side White Lines pattern can be suitable for beginners, but with certain caveats. The pros for beginners would include:
- Simplicity: The pattern consists of three candles, making it relatively straightforward to identify.
- Clear indication: It provides a clear signal of trend continuation, which can be helpful for novice traders.
Cons beginners might experience with this pattern include:
- Rarity: The pattern is relatively rare, which means beginners may not encounter it frequently in live trading and thus mistrust it due to a lack of familiarity.
- Moderate reliability: Its success rate is moderate, so relying solely on this pattern without additional confirmation can be risky.
In summary, while the Side By Side White Lines pattern can be a useful addition to a beginner’s toolkit, it’s essential to use it alongside other technical analysis tools and not depend on it exclusively for trading decisions.
What are the Pros and Cons of the Side By Side White Lines Pattern?
Pros
- Trend continuation signal: Helps identify the continuation of existing trends.
- Clear structure: The pattern’s formation is straightforward, aiding in quick recognition.
- Applicable across markets: Can be used in various markets, including stocks and forex.
Cons
- Rarity: The pattern doesn’t occur frequently, limiting trading opportunities.
- Moderate success rate: Not the most reliable pattern, necessitating additional confirmation.
- Potential for misinterpretation: Without proper context, traders might misread the pattern’s implications.
What are the Advantages of the Side By Side White Lines Pattern?
The Side By Side White Lines pattern offers several advantages:
- Clarity in trend continuation: The pattern provides a clear signal that the current trend is likely to continue, which can be valuable for traders looking to ride ongoing market movements.
- Ease of identification: Its distinct three-candle formation makes it relatively easy to spot on charts, even for those new to technical analysis.
- Versatility: Applicable across various markets and timeframes, allowing traders to incorporate it into different trading strategies.
By integrating this pattern into a broader trading strategy that includes other indicators and risk management techniques, you can enhance your decision-making process and generate more profitable trades.
What are the Disadvantages of the Side By Side White Lines Pattern?
Despite its advantages, the Side By Side White Lines pattern has some limitations:
- Rarity: The pattern is relatively uncommon, which can limit its utility in day-to-day trading.
- Moderate reliability: With a success rate around 66%, it’s not among the most reliable candlestick patterns, necessitating additional confirmation.
- Potential for false signals: Without corroborating indicators, the pattern can sometimes lead to false assumptions about market direction.
You should be cautious and use this pattern in conjunction with other technical analysis tools to mitigate potential risks.
Can the Side By Side White Lines Pattern have Failure Signals?
Yes, the Side By Side White Lines pattern can produce failure signals, and factors contributing to such failures include:
- Lack of volume confirmation: Without increased trading volume, the pattern’s signal may lack strength.
- Contradictory indicators: If other technical indicators suggest a different market direction, the pattern’s reliability decreases.
- Market conditions: In highly volatile or news-driven markets, the pattern’s predictive power can diminish.
To reduce the likelihood of acting on false signals, you should seek confirmation from additional technical indicators and consider the broader market context before being swayed to place a trade.
Which Indicators can be Combined with the Side By Side White Lines Pattern to Increase its Success?
To enhance the reliability and performance of the Side By Side White Lines Candlestick Pattern, traders often combine it with various technical indicators. While the pattern itself reflects a temporary consolidation within a trend, supporting tools can help confirm momentum, filter out noise, and increase your win rate when trading it.
Here are five indicators that can be incorporated into your Side By Side White Lines trading strategy:
Moving Average
Overlaying moving averages on your chart can help you validate the trend direction and confirm that the market environment supports a continuation setup.
If the pattern forms:
- Above a rising 50-day or 20-day MA, it reinforces a bullish continuation.
- Below a falling MA, it supports a bearish continuation.
The Side By Side White Lines pattern signals a pause, not a reversal, when that pause occurs in alignment with a trending MA, you’re stacking probabilities in your favor. You can also use the 9 EMA and 21 EMA crossover to track short-term trend momentum alongside the pattern.
RSI (Relative Strength Index)
The RSI is a powerful momentum indicator that can confirm whether the market has the strength to support continuation.
- In a bullish version of the pattern, look for RSI holding above 50.
- In a bearish version, RSI should remain below 50.
The RSI shows whether bulls or bears are in control. If RSI stays in momentum territory while the pattern forms, it signals that the trend is likely to resume. An RSI breakout from a short-term consolidation at the same time the pattern breaks is a strong confirmation signal.
Volume Analysis
Volume analysis plays a vital role in confirming the Side By Side White Lines pattern. You want to see:
- Stable or slightly declining volume during the two small candles (indicating low opposition).
- Followed by a volume surge on the breakout candle.
A breakout backed by strong volume reflects real conviction, not just drift. When volume supports the move, continuation is more likely. Use volume indicators like On-Balance Volume (OBV) or Volume Profile to spot accumulation zones forming beneath the pattern.
MACD Strategy (Moving Average Convergence/Divergence)
MACD helps identify whether momentum is building or fading in the direction of the pattern.
- A bullish MACD crossover (MACD line crossing above the signal line) adds confidence to a bullish pattern.
- A bearish crossover supports a bearish continuation.
MACD captures the underlying momentum that price alone can’t always show, it adds timing precision to your setup. Look for MACD crossovers near or just after the formation of the pattern for the most relevant signals.
Multi-Indicator Confluence
You’ll get the best results by combining multiple indicators with the pattern, such as:
- Side By Side White Lines + MACD crossover + RSI holding above 50
- Or: Pattern + 20 EMA support + volume spike on breakout
Stacking confirmations creates higher-probability trades and helps filter out low-conviction setups. Build a checklist or ruleset that includes at least two supporting indicators before acting on the pattern.
While the Side By Side White Lines is a clean and visually simple pattern, combining it with indicator-based confirmation transforms it from a passive signal into a powerful, actionable setup. Whether you’re a day trader, swing trader, or longer-term investor, integrating these tools helps you trade with greater clarity, discipline, and confidence.
Tip: Don’t trade this pattern in isolation, use it as a core structure within a broader, rule-based strategy.
(Learn To Trade And Read Candlestick Patterns Like A Pro)
What are Similar Patterns to the Side By Side White Lines Pattern?
Several candlestick patterns share similarities with the Side By Side White Lines Candlestick Pattern:
| Pattern Name | Description |
|---|---|
| Rising Three Methods | A bullish continuation pattern with three small bearish candles between two large bullish candles. |
| Falling Three Methods | A bearish continuation pattern with three small bullish candles between two large bearish candles. |
| Three White Soldiers | Three consecutive long bullish candles indicating a strong uptrend. |
| Three Black Crows | Three consecutive long bearish candles indicating a strong downtrend. |
Understanding these patterns can provide you with additional tools for analyzing market trends, which in turn allows for more consistently successful trading. Learn more patterns in our free Candlestick Patterns PDF.
What is the Difference Between the Side By Side White Lines Pattern and the Three Line Strike Candlestick Pattern?
While both patterns involve three candles, they serve different purposes and have distinct formations:
| Aspect | Side By Side White Lines | Three Line Strike |
|---|---|---|
| Number of Candles | 3 | 4 |
| Pattern Type | Continuation | Reversal |
| Formation | Three candles of the same color with similar sizes | Three candles in the direction of the trend followed by a larger opposite candle. |
| Signal | Indicates trend continuation | Suggests a potential trend reversal. |
Recognizing the differences between these patterns is crucial for accurate technical analysis and applying effective trading strategies.
What are the Limitations of the Side By Side White Lines Pattern?
The Side By Side White Lines pattern has several limitations:
- Rarity: The pattern doesn’t occur frequently, which can limit its practical application.
- Moderate reliability: With a success rate around 66%, it’s not among the most dependable patterns.
- Dependence on market conditions: Its effectiveness can vary based on market volatility and other external factors.
- Need for confirmation: The pattern should be used in conjunction with other indicators to confirm signals.
You should be aware of these limitations, and incorporate comprehensive analysis techniques to mitigate potential risks-never take the pattern as a standalone indicator.
Learn Pattern Trading with WR Trading Mentoring
You can enhance your trading skills by learning how to effectively identify and utilize candlestick patterns like the Side By Side White Lines through WR Trading’s mentoring program.
Our experienced mentors provide personalized guidance, helping you understand market dynamics, develop robust trading strategies, and manage risks effectively.
By joining our mentoring program, you’ll gain access to:
- In-depth training: Comprehensive lessons on technical analysis and candlestick patterns.
- Personalized support: One-on-one sessions with seasoned traders to address your specific needs.
- Practical application: Real-world trading scenarios to apply your knowledge and build confidence.
Take the next step in your trading journey with WR Trading Mentoring, and transform your approach to the markets into one of consistent profitability.
(Learn To Trade And Read Candlestick Patterns Like A Pro)
Conclusion: Mastering the Side By Side White Lines Pattern
The Side By Side White Lines Candlestick Pattern serves as a valuable tool in your arsenal, offering legitimate insights into potential trend continuations. While it boasts a moderate success rate, its effectiveness is enhanced when used in conjunction with other technical indicators and sound risk management practices.
From our experience, this pattern is particularly useful for traders who prefer a structured approach to technical analysis. Its clear formation and the psychological insights it provides into market sentiment make it a reliable component of a comprehensive trading strategy.
Due to its rarity, however, you’ll need to be patient and wait for the pattern to form under favorable market conditions. The Side By Side White Lines Candlestick Pattern can be a powerful indicator when used correctly, which means combining it with other technical tools and maintaining your disciplined trading practices.
It’s a standard and valuable tool for traders of many types to enhance their ability to identify and capitalize on trend continuation opportunities, when they occur.