The Tasuki Gap is a candlestick pattern in technical analysis that gives insight into market continuations following a strong movement in prices. It is a structured chart formation that is used by traders to identify potential continuation signals in a trend.
The Tasuki Gap pattern comes in two varieties, which include the Upside Tasuki Gap, that is, the bullish continuation and the Downside Tasuki Gap, that is, the bearish continuation. These patterns have similar characteristics but appear in opposite contexts and show different movements.
These patterns are characteristics formed by market psychology. Traders either choose to buy into strength or sell into weakness.

Key Facts about the Tasuki Gap Candlestick Pattern:
- First Candle: A strong white or green candle for upside Tasuki and a strong red or black candle for downside gap.
- Second Candle: Another white or green candlestick for upside Tasuki and red or black for downside Tasuki.
- Third Candle: A black or red candle for upside Tasuki and a white or green candle for downside Tasuki.
- Type of Pattern: Upside and Downside patterns. Also known as bullish and bearish patterns.
- Trend Prior Pattern: Before an upside pattern forms, there has to be an uptrend. For a downside trend, there has to be an established downtrend.
- Opposite Pattern: The opposite of an upside Tasuki gap is a downside Tasuki gap and vice versa.
- Entry options: Placing a buy-stop order above the high of the second candle for upside Tasuki. Placing a sell-stop order below the low of the second candle.
- Stop Loss Placement: Stop loss is placed just below the low of the third candle for upside and above the high of the third candle for downside.
- Interpretation: The upside Tasuki Gap means that buyers remain in control despite a minor pullback. The downside Tasuki Gap means sellers are in control.
(Learn To Trade And Read Candlestick Patterns Like A Pro)
What Is An Upside Tasuki Gap Pattern?
The upside Tasuki gap is a candlestick pattern that forms during an uptrend. This signify a bullish continuation in an existing uptrend. This three-candle formation indicates that despite a temporary pullback or buying pressure, buyers remain in control of the market, and the upward price movement is likely to resume.
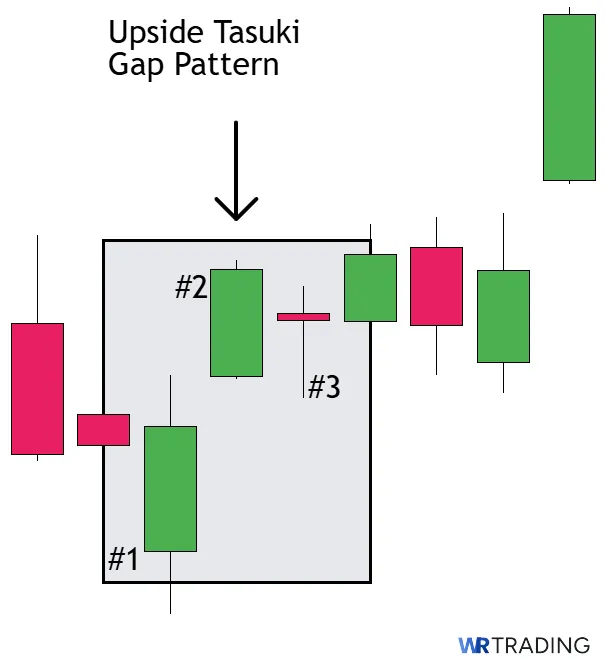
An upside Tasuki Gap consists of three candles:
- A bullish candle that continues the upward momentum. This is recognized by a white or green candlestick.
- A second bullish candle that shows strong buying pressure. It opens above the close of the first candle, creating a visible gap between the two candles.
- A bearish candle that opens within the body of the second candle, it moves downward and closes inside the gap, but does not fill it completely.
An upside Tasuki gap acts as a bullish continuation signal, encourages traders to stay on target and know when to exit or add to bullish positions. It also confirms the bullish strength with a brief retracement.
The initial gap up shows strong bullish conviction and enthusiasm. The third bearish candle represents natural profit-taking after a quick advance. The inability of the bearish candle to fill the gap completely indicates that selling pressure is limited and temporary.
With an upside Tasuki gap, buyers are likely to wait to enter the market at slightly lower prices, providing support that prevents a complete retracement. Buyers have the upper hand, and the uptrend is intact.
When confirmed by volume or indicators like RSI or MACD, this pattern becomes even more reliable for planning bullish trades.
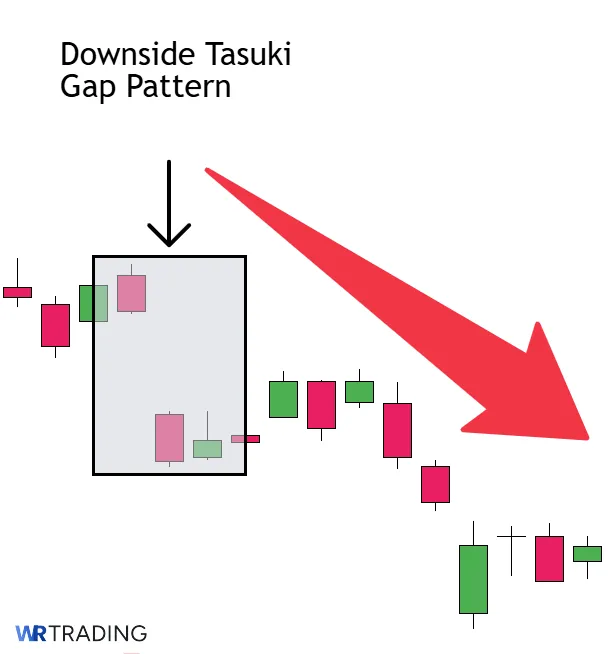
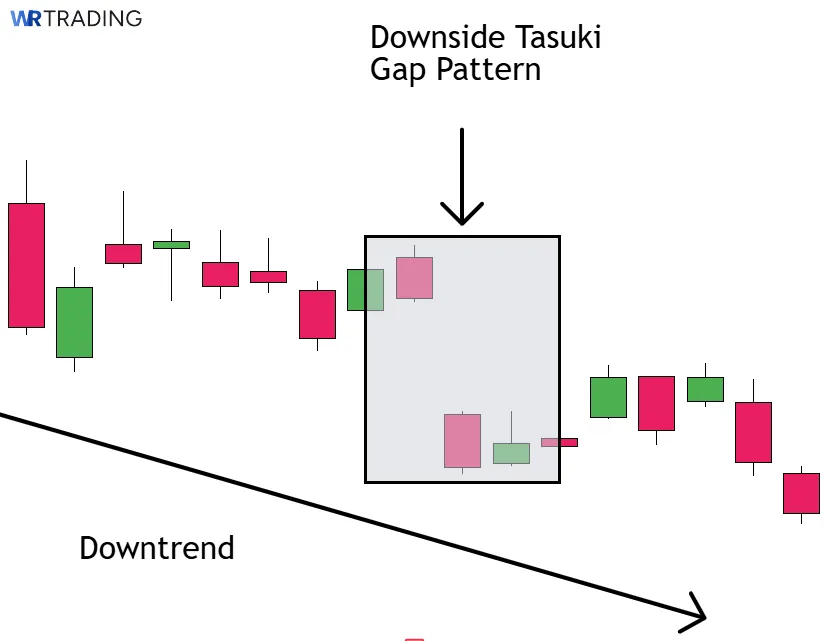
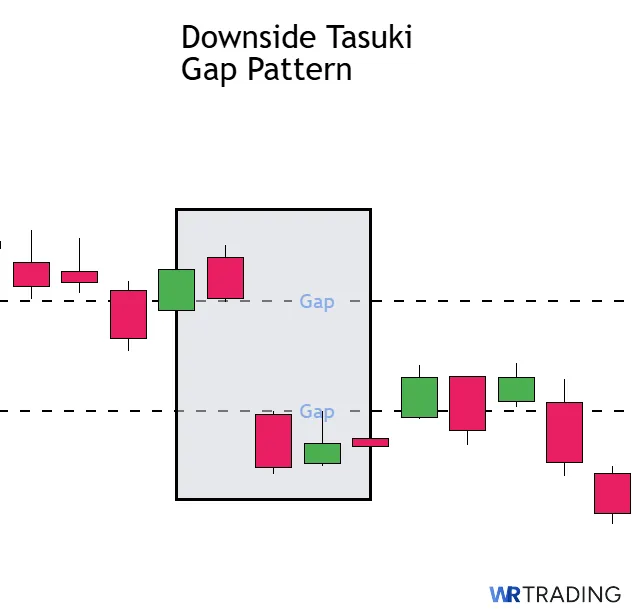
What Is a Downside Tasuki Gap Pattern?
The Downside Tasuki Gap is a bearish pattern that is formed during a downtrend. It indicates that sellers are in control of the market and the downtrend is likely to resume.
During a downtrend, a gap down is followed by a partial, but incomplete, retracement into the gap. This type of pattern indicates that, despite some bargain hunting, the bearish sentiment remains strong enough to prevent the gap from being completely filled.
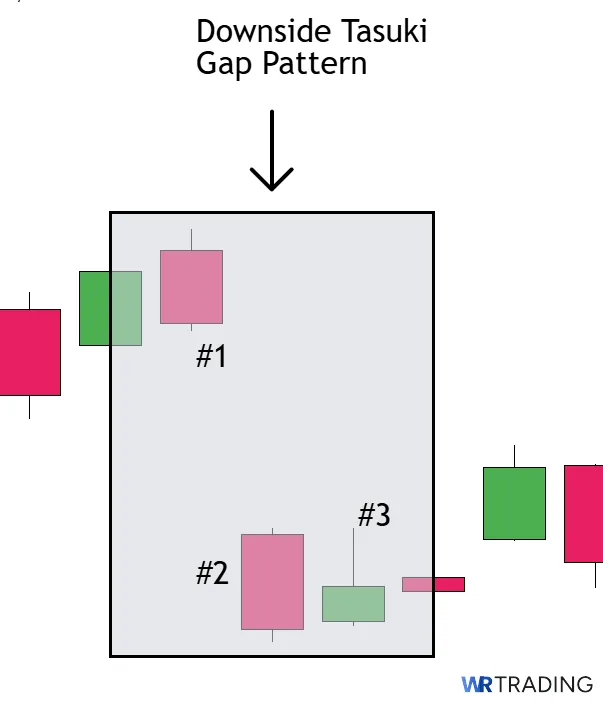
A Downside Tasuki Gap includes three candles, and this is what they look like:
- The first candlestick is a strong bearish candle that continues the downtrend. It shows decisive selling pressure. It is indicated by red or black colour.
- The second candlestick also indicates a bearish movement that opens with a gap down. It opens just below the close of the first candle, creating a visible gap between the two candles. This gap represents intensified selling pressure. That is, the supply is more than the demand, so prices jump lower before any trading occurs.
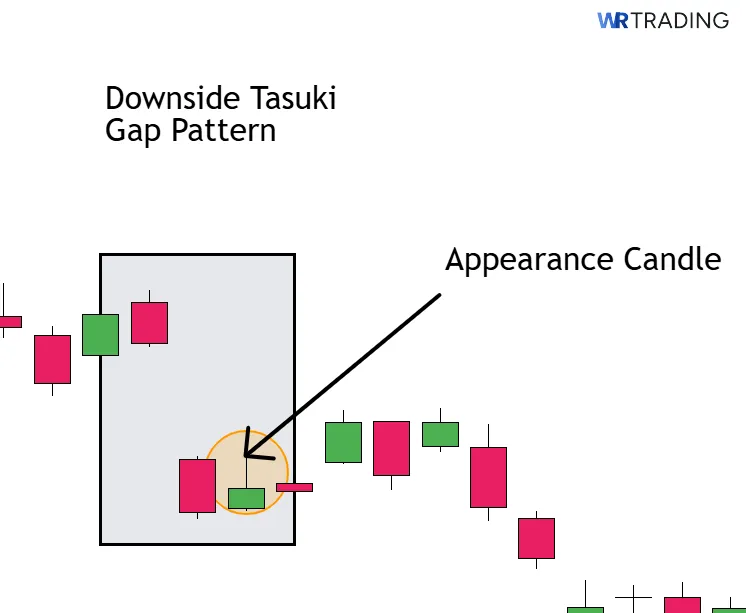
- The third candle is a bullish candle that opens by writing the body of the second candle and moves upward. It appears between the first and second candle but does not completely close the gap. It is indicated by white or green colour.
A downside Tasuki gap signals bearish continuation. It suggests that a downward momentum will likely resume and help traders identify spots to enter or add to short positions. It shows that despite a strong decline, the buying pressure was insufficient to erase the bearish gap.
The Downside Tasuki Gap can be interpreted to mean that the initial gap down shows strong bearish conviction and selling pressure. The third candlestick represents a short covering or bargain hunting after a quick decline. The inability of the candlestick to fill up the gap indicates that buying pressure is limited and temporary.
Is a Tasuki Gap Candlestick Pattern Bullish Or Bearish?
The Tasuki Gap candlestick pattern can be either bullish or bearish. It all depends on the market trend in which it appears. When the pattern forms during an uptrend, it is bullish. When it forms during a downtrend, it is bearish.
(Learn To Trade And Read Candlestick Patterns Like A Pro)
How Is The Tasuki Gap Pattern Formed?
The Tasuki Gap pattern is formed within an existing trend. It can be either upward or downward. It also consists of a specific three-candle sequence that develops over three consecutive trading periods.
It’s a structured pattern, meaning it follows a clear and repeatable setup. The formation of the Tasuki Gap pattern requires an existing price movement because it is a trend continuation rather than a reversal.
- For the Upside Tasuki Gap, the pattern forms during an existing uptrend, where prices have been consistently moving higher with bullish momentum.
- For a Downside Tasuki Gap, the pattern forms during an existing downtrend, where prices have been consistently declining with bearish momentum.
Both trends require only three candles to form the complete pattern. These candlesticks can form at any time frame depending on the chart you are analysing.
What Does The Tasuki Gap Candlestick Pattern Mean?
The Tasuki Gap candlestick pattern reflects market psychology and the tug-of-war between buyers and sellers during an ongoing trend. Whether it’s the Upside Tasuki Gap or the Downside Tasuki Gap, the meaning lies in how the market reacts to a brief pullback and whether that pullback gains traction or gets rejected.
Upside Tasuki Gap Trading Psychology
The Upside Tasuki Gap means that buyers are in full control. The first two bullish candles show strong buying momentum. While the third bearish candle attempts to pull back and close the gap shows that sellers are weak and cannot reverse the direction.
Buyers show confidence in the market by pushing prices higher with the first bullish candle. Then, when the second candle opens with a gap up, prices move up because buyers are willing to pay more before sellers can respond.
The upside Tasuki gap shows buyers’ optimism and fear of missing out on making a huge profit. Buyers are confident and even after a small dip, they do not let the price fall far. They see this gap as confirmation that the uptrend is intact.
Downside Tasuki Gap Trading Psychology
Psychologically, the Downside Tasuki Gap is the opposite. Sellers are less confident despite temporary reliefs. The initial strong bearish candle shows sellers confidently driving prices lower. Then the second candlestick opens with a gap down, that is, prices drop lower.
This is because desperate sellers are willing to accept reduced prices before buyers can stabilize the market. This gap represents panic and shows sellers’ fear of holding their positions during further decline. The third candle shows bargain-hunting behavior as some opportunistic buyers step in. This creates temporary buying pressure. However, this buying pressure proves insufficient to close the gap.
This means that while some bargain hunting occurred, sellers remain dominant and new sellers emerge at slightly higher prices, preventing a complete retracement.
This pattern reveals that despite temporary relief, the underlying bearish sentiment remains firmly in control. The incomplete filling of the gap serves as evidence that sellers still outnumber buyers at these price levels. Sellers remain aggressive. While buyers try to push back, but lack conviction, so the downtrend continues.
In both patterns, the Tasuki Gap shows a short test of trend strength. The market’s failure to reverse confirms the dominant side, buyers in an uptrend or sellers in a downtrend.
Where Does the Name of the Tasuki Gap Come From?
The name “Tasuki Gap” comes from the Japanese word ‘Tasuki’, which is a traditional sash or cord used to hold up the sleeves of a kimono when working. This reference was chosen because the pattern represents a sleeve (the gap) being held up but not completely closed.
(Learn To Trade And Read Candlestick Patterns Like A Pro)
What Is An Example Of The Tasuki Gap Pattern?
Here are examples of an upside and downside Tasuki gap:
Upside Tasuki Gap
During a strong uptrend on the EUR/USD 4-hour chart, an Upside Tasuki Gap pattern emerged:
- First Candle: A large bullish (green) candle closed near 1.0450, indicating strong buying momentum.
- Second Candle: The next candle opened with a gap up at 1.0475 and closed higher at 1.0500, reinforcing the bullish trend.
- Third Candle: A small bearish (red) candle opened within the body of the second candle and closed at 1.0480. This partially fills the gap, but does not close it entirely.
Downside Tasuki Gap
Here is what a downside Tasuki gap pattern would look like:
- First Candle: A strong bearish (red) candle closed at 1.0500. This reflects significant selling pressure.
- Second Candle: The following candle opened with a gap down at 1.0480 and closed lower at 1.0475, continuing the downward momentum.
- Third Candle: A small bullish (green) candle opened within the body of the second candle and closed at 1.0450. This partially fills the gap but fails to close it completely.
How To Identify The Tasuki Gap Pattern?
Identifying the Tasuki Gap pattern requires recognition of candlestick formations within an existing trend. Whether you are looking for an upside or downside Tasuki Gap, the method is the same.
Here is a step-by-step way to identify the patterns:
Look For An Existing Trend
The first step is to find a clear trend. For an upside gap, look for an uptrend where prices have reached higher highs and lower lows. You can find this across 5-7 candlesticks. For a downside gap, search for a downtrend with lower lows and higher highs over a time frame.
The Tasuki Gap pattern is a continuation pattern, so you can only find it within the context of a pre-existing trend.
Find The First Candle
After identifying an existing trend, look for a candle that matches the direction of the trend. Bullish candle in uptrend and bearish candle in downtrend. This candle shows momentum and lays the foundation for other candlesticks.
Look For a Gap Between Candle 1 and Candle 2
The second candle opens with a gap in the same direction as the trend. A second candle that opens a gap up is a bullish while a candle that opens a gap down is a bearish candle.
Spot The Third Candle
The third candle should open within the body of the second candle without completely filling it. The key rule is that the candle should not fully close the gap. If it does, the pattern is invalid.
The Tasuki Gap pattern can appear across all timeframes but is more reliable on 1-hour, 4-hour, or daily charts. When searching for this pattern, focus on the following:
- Candlestick charts, not line or bar charts
- Pullback in trends
- Trending markets instead of ranging or consolidating charts
- Charts after a significant news or event that may trigger gaps
(Learn To Trade And Read Candlestick Patterns Like A Pro)
How To Trade The Tasuki Gap Pattern?
Trading the Tasuki Gap pattern requires you to combine technical analysis with risk management and confirmation rules. While the pattern is a clue, entering the market blindly is risky. Here is a step-by-step guide on how to trade the Tasuki Gap Pattern:
- Find the right setup for the Tasuki Gap
- Wait for the appearance of the Tasuki Gap candlestick pattern
- Open your trade entry point
- Wait for a confirmation or not
- Choose your trading take profit
Find the Right Setup for the Tasuki Gap
Before anything else, you should find the right setup. Here is how you can find it:
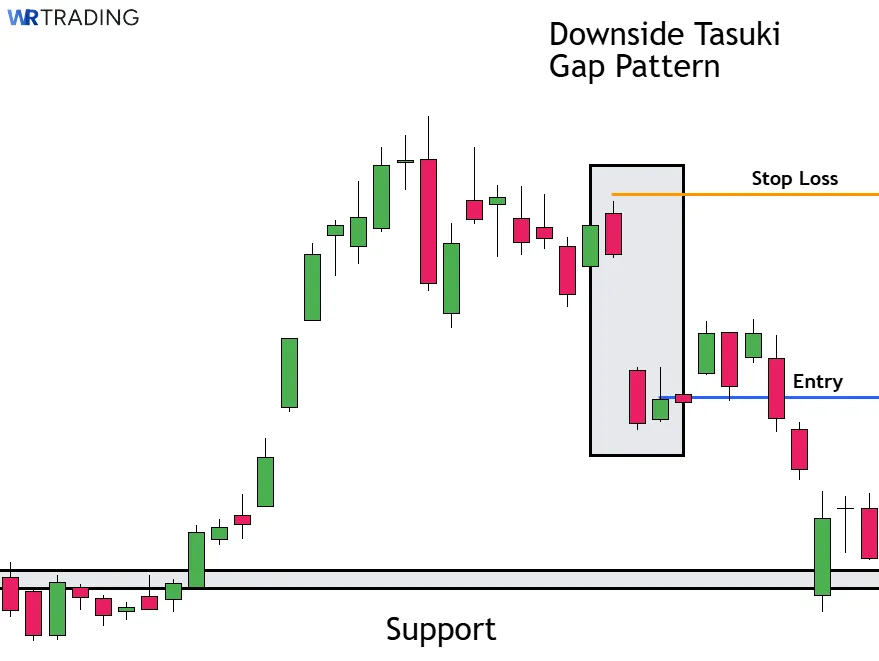
- Look for an existing strong uptrend or downtrend
- Spot key resistance or support levels
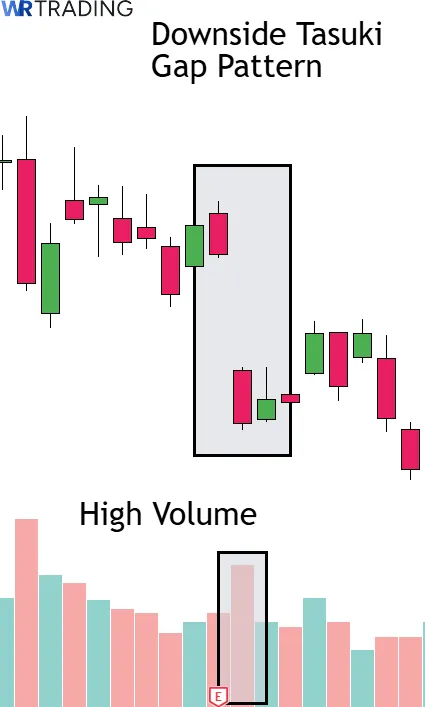
- Find the increasing volumes that support the uptrend or downtrend
- Identify trade continuation and reversal
Wait For The Appearance Of The Tasuki Gap Candlestick Pattern
Once you have identified the right setup, you need to do the following:
- Wait for the three-candle sequence of the Tasuki Gap
- Make sure the third candle does not fill the gap completely
Open Your Trade Entry Point
After confirming the pattern, open your trade entry point. Here is how:
- Enter your trade at the close of the third candle
- Place your stop loss just below or above the low or high of the third candle
- Use risk management rules, such as risking not more than 1–2% of your trading capital per trade.
Wait For a Confirmation Or Not
You may choose to wait for additional confirmation before entering the market. Here are the parameters for confirmation:
- A strong candle closing in the trend direction right after the third candle
- A volume increase, confirming market interest
- Indicators like RSI staying above 50 for bullish or below 50 for bearish
- Gap area becomes support in an uptrend or resistance in a downtrend
- Price remaining above key moving averages in uptrends or below them in downtrends
When the confirmation candle is weak, indecisive, or shows reversal, it may be best to wait.
Choose Your Trading Take Profit
Set your trading take profit based on the following:
- The length of the gap moves
- Nearby support/resistance levels
- 1:2 or 1:3 risk-to-reward ratio based on your stop-loss distance.
(Learn To Trade And Read Candlestick Patterns Like A Pro)
What Is The Success Rate Of The Tasuki Gap Candlestick Pattern?
The Tasuki Gap candlestick pattern has a relatively good success rate. It ranges from 57% to 67%. For the Upside Tasuki Gap, the success rate is up to 57%. In combination with additional indicators, it can improve to around 58 to 62%. These success rates are supported by Thomas Bulkowski’s research published in his “Encyclopedia of Candlestick Charts.”
The factors that influence the success rate of the Tasuki Gap candlestick pattern include:
- Market Conditions: The pattern tends to perform better in stable and strong trending markets.
- Timeframe: The higher the time frame, the more reliable the pattern. Daily or 4-hour charts often show more reliable patterns compared to lower time frames.
- Confirmation Indicators: Using additional tools like RSI, MACD, or volume analysis can confirm if the pattern is reliable.
- Pattern Context: The presence of the Tasuki Gap near key support or resistance levels can increase its hit rate
- Market Session: The pattern’s reliability increases during major market sessions like the London or New York sessions due to higher liquidity.
What Are The Pros And Cons Of the Tasuki Gap Pattern?
Here are the pros and cons of the Tasuki Gap pattern:
Pros
- Clear trend continuation signal
- Easy to spot with practice
- Boost confidence in trending markets
- Helps define entry and stop-loss placement
- Supports both bullish and bearish trends
- Can improve accuracy when combined with indicators
- Works across multiple timeframes
Cons
- Requires a pre-existing trend to be effective
- Moderate success rate without confirmation
- May produce false signals in unstable markets
What Are The Advantages Of The Tasuki Gap Pattern?
There are many advantages of this gap pattern for forex traders, especially for trend traders. The most popular ones are its clear trend continuation signal, dual-sided application (bullish & bearish), and precise entry and stop-loss placement.
Other advantages include:
- Clear Trend Continuation Signal: This pattern is a sign that a current trend is likely to continue. This helps traders avoid false reversals and understand the market momentum.
- Easy to Spot with Practice: The pattern is easy to spot once you are familiar with the three-candle structure. This makes it easy for beginners.
- Works in Both Bullish and Bearish Markets: The gap can form as an Upside Tasuki Gap (bullish) or a Downside Tasuki Gap (bearish) regardless of the market direction.
- Useful on Multiple Timeframes: Whether you’re trading for 15-minute, 1-hour, or swing trading on the daily chart, this pattern allows you to take advantage of trend continuation setups.
- Enhances Entry and Stop-Loss Accuracy: The structure of the Tasuki Gap helps you define a precise entry and stop-loss point.
- Boosts Accuracy When Combined With Indicators: When used alongside alternatives, the Tasuki Gap becomes a strong confirmation pattern. It helps improve overall accuracy and decision-making.
- Strengthens Confidence in Trending Markets: Due to trend psychology, the gap adds confidence when you’re unsure whether a move has momentum.
What Are The Disadvantages Of The Tasuki Gap Pattern?
Despite its usefulness, the Tasuki Gap pattern has several limitations that forex traders need to know. They include:
- Requires a Pre-Existing Trend to Be Effective: The Tasuki Gap is a continuation pattern, which means it relies heavily on an established uptrend or downtrend.
- Moderate Success Rate Without Confirmation: When used alone, the success rate is moderate. So it has to be combined with other tools to be reliable.
- False Signals in Unstable Markets: In unstable markets, Tasuki Gaps often lead to fake signals. What looks like a continuation trend may quickly reverse, especially if the third candle closes the gap unexpectedly.
(Learn To Trade And Read Candlestick Patterns Like A Pro)
Can The Tasuki Gap Have Failure Signals?
Yes, the Tasuki Gap candlestick pattern can have failure signals. The failure can be to a significant degree, depending on the context in which it happens.
Here are the reasons why the pattern might have failure signals:
- Weak Trend Foundation: If the pattern appears in a weak trend, the continuation may never occur, and this leads to a reversal.
- Gap Closure by the Third Candle: If the third candle unexpectedly fills the gap, the pattern is useless.
- Lack of Confirmation: Entering the trade immediately after spotting the pattern, without any confirmation from indicators, increases the risk of a fake signal.
- Unexpected News or Volatility: Economic events or breaking news can alter technical patterns completely, causing sudden reversals even after a perfect-looking Tasuki Gap pattern.
Which Indicators Can Be Combined With the Tasuki Gap to Increase Its Success?
Combining technical indicators with the Tasuki Gap pattern can improve its predictive reliability and confirm trend strength. Here are the indicators that can be combined with Tasuki Gap:
Relative Strength Index (RSI)
RSI measures the speed and magnitude of price movements.

- Settings: 14-period with 70 overbought and 30 oversold
- How to Use With Tasuki Gap: Confirm Tasuki Gap signals when RSI maintains trend-supportive readings, that is above 50 for uptrends, below 50 for downtrends. Avoid patterns where RSI suggests exhaustion. RSI between 50 and 70 for bullish trend is still healthy. While RSI between 30 and 50 supports bearish trend.
MACD (Moving Average Convergence Divergence)
MACD tracks the relationship between two moving averages to identify momentum changes.
- Settings: Fast and slow EMAs should be 12 and 6, respectively, while the signal line should be 9
- How to Use With Tasuki Gap: Enter trades when the MACD histogram bars maintain or increase their trend direction after pattern completion. MACD line should be above the signal line with the histogram rising for an upside gap, while MACD line should be below the signal line with the histogram falling for a downside gap.
Moving Averages (MA)
Moving averages smooth price action to identify trends.
- Settings: EMA 20 for short-term trend and EMA 50 for intermediate trend
- How to Use With Tasuki Gap: Confirm Tasuki Gap signals when price identifies these moving averages as support or resistance. A price above both EMAs confirms a strong uptrend, while a price below both EMAs confirms a strong downtrend.
Volume Indicator
Volume indicators measure buying and selling pressure by adding volume on up days and subtracting it on down days.
- Setting: Use the standard default volume indicator
- How to Use With Tasuki Gap: Look for higher-than-average volume on the gap candles, especially the first and second candles. Volume should not drop sharply on the third candle. Rising volume supports the conviction behind the trend continuation.
What Are Similar Patterns To The Tasuki Gap Pattern?
The Tasuki Gap pattern belongs to a family of continuation formations that share similar forecasting implications. These patterns include:
| Pattern | Type | Forecast | Description |
|---|---|---|---|
| Rising Three Methods | Bullish Continuation | Trend Continues Up | A long bullish candle, followed by 3 small pullback candles, then another bullish candle. The five candles confirm an uptrend continuation. |
| Falling Three Methods | Bearish Continuation | Trend Continues Down | A long bearish candle, followed by 3 small bullish pullback candles, then another bearish candle. |
| Three White Soldiers | Bullish Reversal/Continuation | Bullish Momentum | Three strong bullish candles in a row, often seen at the end of a downtrend or during a continuation. |
| Three Black Crows | Bearish Reversal/Continuation | Bearish Momentum | Three strong bearish candles in a row, often marking continuation or reversal down. |
| Side-by-Side White Lines | Bullish Continuation | Uptrend Continues | Two or more white (bullish) candles that open with a gap up and move in parallel. It shows buyer strength. |
| Upside Gap Two Crows | Bearish (Complex) | Potential Reversal | A bearish setup where two bearish candles appear after a gap up. It is sometimes confused with Tasuki but signals a reversal. |
Download our Candlestick Patterns PDF to learn more formation alternatives for free!
What Is The Difference Between The Upside Tasuki Gap And The Downside Tasuki Gap?
Both patterns belong to the Tasuki Gap candlestick family, but their directions, implications, and trading signals are different. Here is how:
| Feature | Upside | Downside |
|---|---|---|
| Trend Direction | Appears in an uptrend | Appears in a downtrend |
| First Candlestick | White or green | Red or black |
| Second Candlestick | Opens with a gap up | Opens with a gap down |
| Third Candlestick | Red or black | White or green. |
| Forecast | Bullish | Bearish |
| Market Psychology | Represents temporary profit-taking after strong buying pressure | Represents temporary bargain hunting after strong selling pressure |
| Stop Loss Placement | Below the low of the third candle or the unfilled gap | Below the high of the third candle or above the unfilled gap |
| RSI Indicator | RSI remains above 50 | RSI remains below 50 |
Is The Tasuki Gap A Type Of Gap On The Stock Market?
Yes, the Tasuki Gap is a type of gap on the stock market. It is a three-candle continuation pattern where the second candle creates a gap and the third candle partially fills that gap.
What Is The Upside Gap 3 Methods?
The Upside Gap Three Methods is a bullish continuation candlestick pattern that shares some similarities with the Upside Tasuki Gap. However, there are differences in structure and interpretation.
The upside gap 3 method opens with an initial bullish candle and a second candle that opens gap up. However, unlike the upside Tasuki gap third candle that partially fills up the gap, the upside Gap 3 Methods completely fills up the gap.
Despite this difference, the psychological meaning, forecast, and outcome remain the same.
What Are The Limitations Of the Tasuki Gap Top Pattern?
The Tasuki Gap Top Pattern offers valuable insights into trend continuation, but like any candlestick pattern, it has its limitations. These limitations include:
- Needs a Strong Existing Uptrend
- Low Volume Can Give False Signals
- Gap May Be Fully Filled
- Easily Confused With Similar Patterns
- Not Ideal Alone for Trade Entries
Learn Pattern Trading With The WR Trading Mentoring
At WR Trading, we believe that understanding candlestick patterns like the Tasuki Gap can give traders an edge in forex trading. That is why we have designed our mentoring program in a way that takes your regular trading skill a step higher.
The WR Trading mentoring will help you understand how to spot candlestick patterns and failures signals before they cost you money. You will also get one on one lessons from our trained professionals.
Begin your journey to becoming a confident pattern trader today. Join our mentorship program today.
(Learn To Trade And Read Candlestick Patterns Like A Pro)
Conclusion: Mastering the Tasuki Gap for Smarter Trades
The Tasuki Gap candlestick pattern is an important trading tool for forex traders. The three-candle pattern helps traders identify both bullish and bearish markets.
The pattern is popular for the gap between the first and second candle and the third candle, which fills the gap without fully reversing the trend. Each pattern affects the trading psychology of both buyers and sellers. Buyers are more confident in a bullish market, while sellers are more confident in a bearish market.
When you understand how the pattern is formed and how to identify it, you are one step closer to making profit. While the pattern is not a guaranteed signal, it provides clarity when combined with the right market conditions and confirmation techniques.