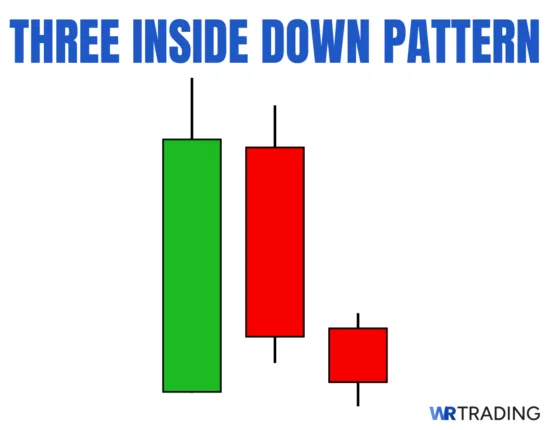
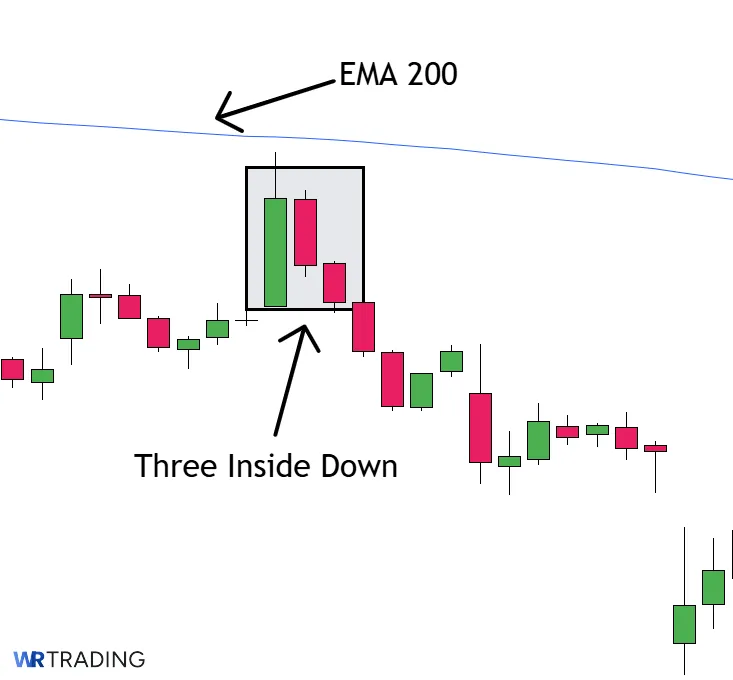
The Three Inside Down is a three-candle bearish reversal pattern that signals a bearish shift after buyers have pushed the market higher. It begins with a strong green candle with continued bullish momentum. The second red candle forms entirely within the first green candle’s body, showing hesitation or early weakness. The third red candle then breaks below the first candle’s low and closes lower, confirming that sellers have taken control and the prior upward move is losing steam.
It often develops at or near resistance levels, following an overextended rally or a failed breakout. The structure reflects a breakdown in bullish control, where buyers are unable to hold their ground and sellers quickly take advantage. Many traders use the pattern as a sign that the uptrend is likely ending or pausing, and that now is the time to take profits, close out a position, or enter a short trade.
Pros of the Three Inside Down Pattern:
- Confirms bearish momentum with structure and follow-through
- Offers a clean reversal signal when the price stalls near resistance
- Useful for catching early signs of a trend shift before the breakdown accelerates
Now we’ll break down how the Three Inside Down pattern sets up, what confirms it, and how it fits into real trading situations.
Keyfacts of the Three Inside Down Pattern
- Type of Pattern: Three-candle bearish reversal pattern.
- First Candle: A strong bullish candle that continues the existing uptrend, closing near its highs and showing clear buyer control.
- Second Candle: A smaller-bodied candle that opens inside the first candle’s real body and closes slightly lower, showing hesitation and loss of momentum.
- Third Candle: A strong bearish candle that closes beneath the first candle’s low, confirming a clear shift from bullish strength to selling pressure.
- Forecast: Signals that buyers are losing control and a potential bearish reversal is beginning once the third candle closes strongly.
- Trend Prior to Pattern:
Forms after a rally, bullish retracement, or sustained uptrend where buyers previously dominated. - Opposite Pattern: Three Inside Up.
- Stop-Loss Placement: Most commonly placed just above the high of the first candle to protect against sudden bullish continuation.
- Candlestick Success Rate: Historical success rate around 60%.
(Learn To Trade And Read Candlestick Patterns Like A Pro)
How Does a Three Inside Down Candlestick Pattern Form?
The Three Inside Down pattern develops at the top of an upward move and marks a transition from buyer strength to growing selling pressure. It forms after a rally, when the price has pushed into resistance or stretched beyond recent highs. The setup often follows wide-bodied green candles or back-to-back bullish closes.
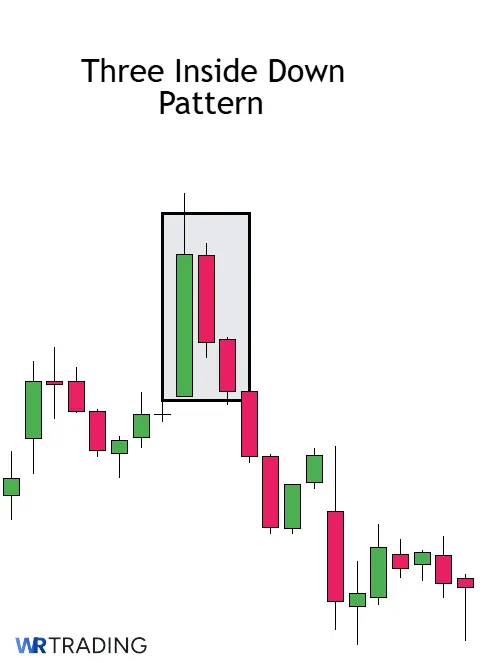
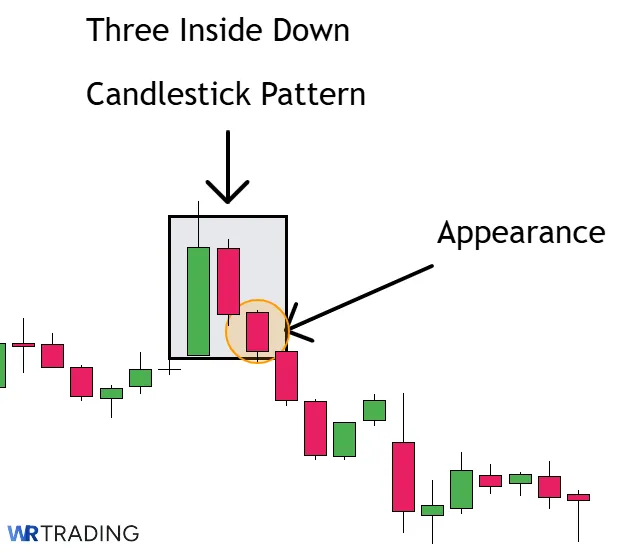
The first candle continues the prior trend with a strong green close. The second candle forms inside the body of the first, showing hesitation. It doesn’t break above or below it just holds inside the range. The third candle is the confirmation: it breaks below the first candle’s low and closes red, confirming that sellers have taken over the momentum.
The total time it takes depends entirely on the chart’s timeframe. On a 1-hour chart, the setup completes in three hours. On a daily chart, it spans three full days. The pattern is time-bound to three consecutive sessions.
What Does the Three Inside Down Candlestick Pattern Mean?
The Three Inside Down signals that bullish momentum is fading and sellers are stepping in with intent, showing a transition from strength to weakness. The first candle confirms that buyers are still in control. However, the second stays inside the first, showing hesitation and reduced follow-through. When the third candle closes below the low of the first, that’s the turning point. It confirms sellers have pushed past short-term support and taken control of the market’s direction.
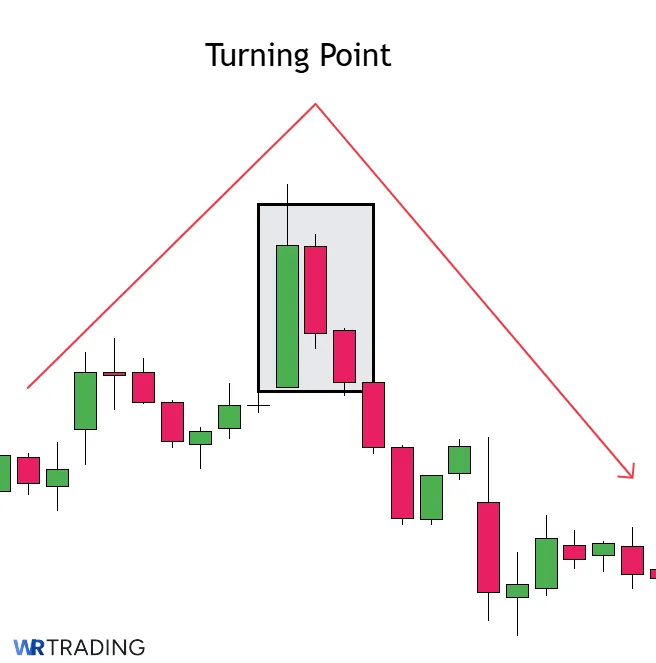
Traders take this as a sign that the prior rally may be ending and a reversal is underway. It becomes more reliable when the pattern forms at a resistance level or after an overbought run. The signal is straightforward: buying pressure has stalled, and sellers are now pushing the price down.
Example of the Three Inside Down Pattern in the Chart
In the EUR/USD 4-hour chart, the price was climbing and reached around 1.31 before stalling near a known resistance zone. The first candle of the pattern formed as a strong green candle, closing near its high at 1.31, showing continued bullish momentum from the prior sessions.
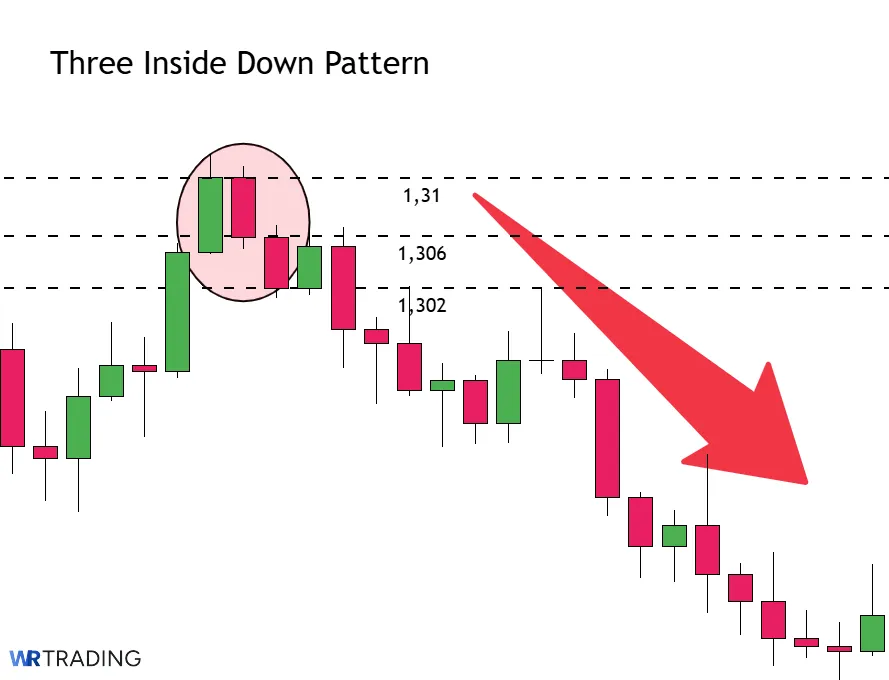
The second candle opened at around 1.31 but showed hesitation early in the session. It remained completely inside the range of the first candle and closed slightly lower at 1.306, forming a small red bar that hinted at fading buyer strength. The third candle opened at 1.306 and dropped with conviction. It closed red at 1.302, breaking below the low of both prior candles and confirming that sellers had stepped in.
(Learn To Trade And Read Candlestick Patterns Like A Pro)
How to Identify a Three Inside Down Candle in the Chart?
To identify the Three Inside Down, begin by focusing on markets that have recently pushed higher. This pattern tends to appear near the end of short-term rallies or after the price hits a known resistance level. Look at zones where previous upswings failed, since it’s more likely to show up there. The setup stands out more when buyers appear exhausted and prices start slowing near a ceiling.
You’ll want to search for this structure on clean charts, ideally on the 4-hour or daily timeframe, where price action is easier to read. Check areas with prior rejection or where other confirmation tools like RSI are showing overbought levels.
How to Trade the Three Inside Down Candlestick Pattern
Trading the Three Inside Down pattern requires structure, rules, confirmation, and a plan for risk management. This section breaks down the full process from setup to execution. You’ll learn:
- Find the Right Three Inside Down Candlestick Pattern Setup
- Wait for the Appearance of the Three Inside Down Candle
- Open Your Trade – Entry Point
- Choose Your Trading Take Profit
1. Find the Right Three Inside Down Candlestick Pattern Setup
The best setups appear after either a persistent upswing or a temporary bullish pullback inside a broader downtrend. On a four‑hour or daily chart, you should see a series of higher highs that carry the market toward visible resistance. When the price touches that barrier and immediately prints a large green candle, the first piece of the Three Inside Down is in place.
Add a technical layer such as a 61.8 percent Fibonacci retracement, a flat 200‑period moving average overhead, or confluence with a psychological round number to strengthen the case that the rally is reaching exhaustion. Momentum readings help too; an RSI value above seventy or a Stochastic Oscillator crossing down from the overbought zone are strong signs that upside drive is fading.
2. Wait for the Appearance of the Three Inside Down Candle
Once price enters a key resistance zone, shift your focus to the structure of the candles. For a valid Three Inside Down, the first green candle should show bullish strength, but the second red candle must stay within the first candle, not engulfing it. The third red candle must then break below the first candle’s low and close decisively lower. Weak closes or candles without strong body-to-wick ratios are less reliable.
Volume helps here too, since rising volume on the third candle compared to the first two sessions shows that sellers are gaining momentum. If indicators like MACD are crossing down or RSI is moving out of overbought territory during the setup, it increases the reliability of the reversal.
(Learn To Trade And Read Candlestick Patterns Like A Pro)
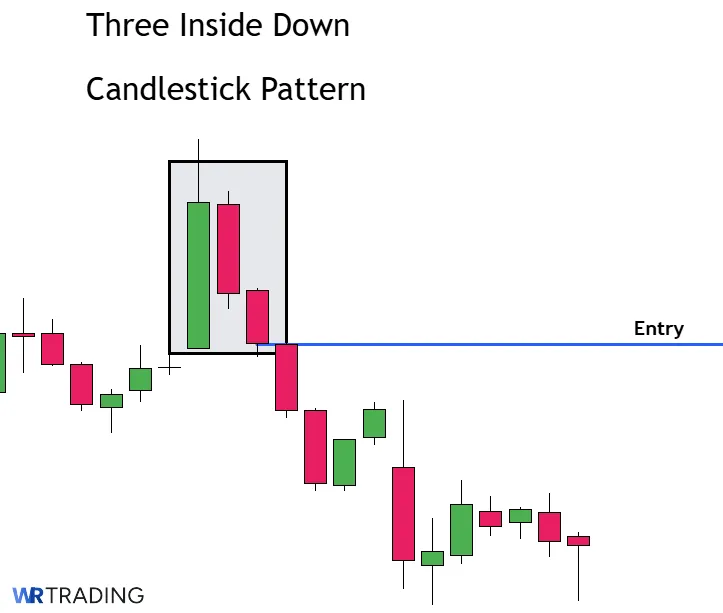
3. Open Your Trade – Entry Point
Once the third candle of the Three Inside Down pattern closes below the first candle’s low, the setup becomes active. A standard entry is taken at the close of the third candle to align with the confirmed shift in momentum. Traders who prefer more precision sometimes wait for a small retest after the third candle finishes, like a minor bounce toward the breakdown level, before opening their short position. This method can sometimes offer a better reward-to-risk ratio but requires fast execution.
It’s important that the entry feels natural based on how price behaves after the third candle closes. If the market hesitates or stalls after the pattern, it’s often better to wait. However, if the price immediately pushes lower, that follow-through confirms that sellers are stepping in with strength.
4. Choose Your Trading Take Profit
First profit targets are set at the last swing low, previous support zones, or a Fibonacci retracement of the prior bullish leg (38.2%, 50%, or 61.8%). Once the price reaches initial targets, many traders move the stop-loss to break-even to protect the position.
However, if momentum stays strong, traders can hold the position longer, aiming for a deeper pullback or full trend reversal. Use trailing take profits and stop losses if you plan to continue the trade. Scaling out of the position as targets are hit helps manage emotions and keeps the trade logical instead of emotional.
What Are The Best Trading Strategies For The Three Inside Down Candlestick Pattern?
A candlestick pattern like the Three Inside Down gains real value only when used with a consistent trading plan. Below you will find three strategies that use the Three Inside Down so you can choose the one that fits your trading style.
Resistance Rejection with Moving Averages
One of the strongest places to trade a Three Inside Down is near resistance zones backed by dynamic resistance from moving averages. Look for price rallying into a horizontal resistance level that aligns closely with a falling 50 EMA or 100 EMA. When the price tests this combined barrier and a Three Inside Down forms, it signals that sellers are stepping in with conviction.
Trades are entered after the third candle closes below the first candle’s low. Stop-losses are placed above the moving average or pattern high to allow for normal volatility. The first target is set at nearby swing lows, while further profits can be captured if the price accelerates and follows through with the broader trend.
Trendline Rejection Setup
In downtrending markets, the Three Inside Down can act as a continuation signal after a rally into a descending trendline. Traders first draw a trendline connecting lower highs. When the price rallies into this trendline and stalls, the appearance of a Three Inside Down provides a clean setup to rejoin the broader downtrend.
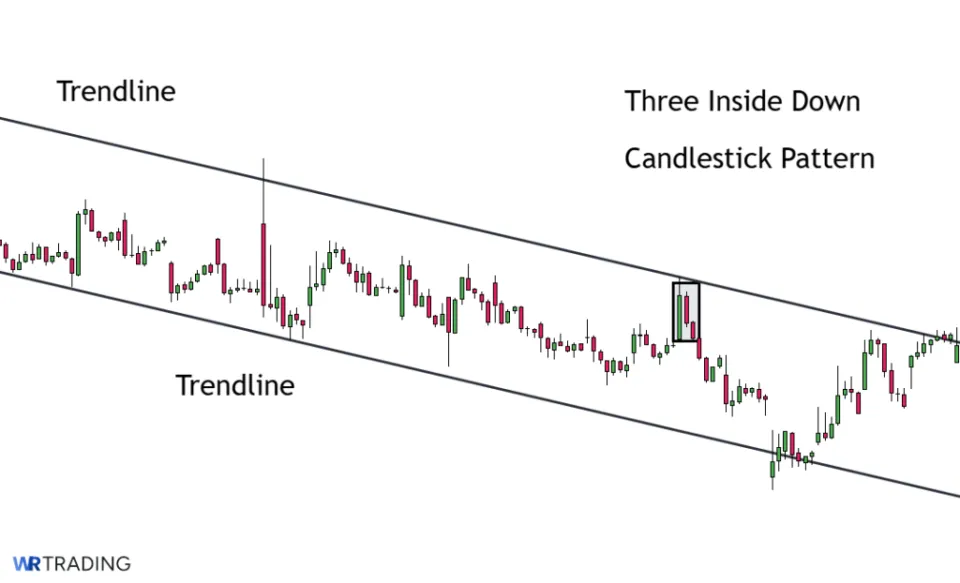
The entry is taken after the third candle confirms, with stops placed slightly above the trendline or pattern high. Initial profit targets are set at the most recent swing low. If momentum builds, place trail stops above lower highs to stay with the trend for a deeper move.
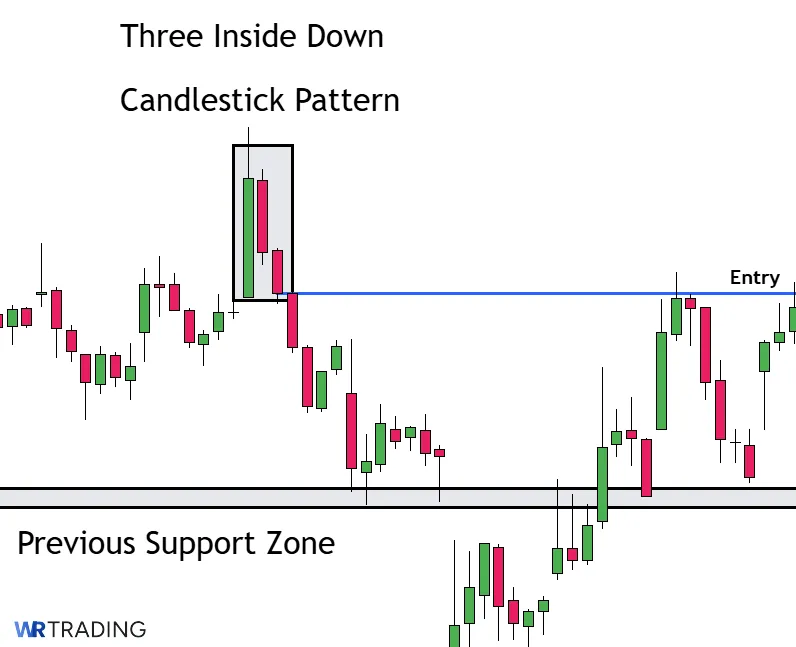
Breakdown Retest Reversal
Sometimes, after a support level is broken, the market will retest it before continuing lower. If the Three Inside Down forms during the retest, it offers a clean second chance to enter the downtrend. First, identify important levels that were broken, then monitor pullbacks back toward these zones.
Once the pattern appears, take short entries after the third candle closes, using the retest high as a logical place for stops. Initial targets are set toward fresh lows created during the downtrend. This strategy is effective when accompanied by declining momentum indicators or rising selling volume during the retest.
(Learn To Trade And Read Candlestick Patterns Like A Pro)
What Is The Success Rate Of The Three Inside Down Candlestick Pattern?
According to Thomas Bulkowski’s research in the Encyclopedia of Candlestick Charts, the Three Inside Down candlestick pattern is accurate as a bearish reversal approximately 60% of the time.
That percentage increases in specific conditions, such as when the pattern forms after an overextended rally, near a strong resistance zone, or during declining bullish volume. These setups show that buyers are losing momentum and the shift is more than just a short pause. Like most patterns, it performs best when the signal aligns with structure, trend pressure, and clear rejection from the highs.
What Are the Pros and Cons of Trading the Three Inside Down Candle Pattern?
The Three Inside Down gives traders a clear structure to spot weakening trends. However, it’s not perfect. Knowing exactly where it helps and where it falls short makes it easier to trade with confidence.
Pros
- Clear multi-candle confirmation of weakness of the trend
- Helps spot reversals after exhausted rallies
- Easy to combine with resistance zones and trendlines
- Can act as an early warning signal for deeper pullbacks
- Adapts across multiple markets and timeframes
Cons
- Needs strong context to succeed
- Weaker reliability during consolidations
- Short-term reversals can be shallow
- Volume confirmation often missing
- Higher timeframe trends can overpower it
What Are The Advantages Of The Three Inside Down Pattern?
When the Three Inside Down forms cleanly in the right areas, it gives traders several technical advantages. These are the five benefits of using the pattern:
- Clear multi-candle confirmation of weakness: The Three Inside Down requires a strong bullish candle, a smaller inside candle, and a confirmed bearish close. This three-step structure clearly shows fading bullish momentum and increasing bearish control. Traders don’t have to guess whether buyers are losing power; the pattern visibly shows it through the price action.
- Helps spot reversals after exhausted rallies: The pattern often forms after a strong push upward, where buyers become overstretched. Instead of continuing higher, price consolidates and then shifts lower, exposing the weakening trend. Catching this change early allows traders to position short before bigger breakdowns happen. It provides a clean technical signal to exit longs or initiate shorts with a strategic plan.
- Easy to combine with resistance zones and trendlines: The Three Inside Down becomes even more reliable when it forms near key resistance levels, psychological price zones, or downtrend lines. These areas already attract sellers, and the pattern confirms that supply is overwhelming demand. Traders can use the pattern alongside chart structures for higher-probability entries and exits.
- Can act as an early warning signal for deeper pullbacks: Even when it does not trigger a full reversal, the Three Inside Down can warn traders of an upcoming retracement. It helps those holding long positions tighten their stops or manage exits better. Recognizing that momentum is shifting allows traders to stay proactive instead of reactive.
- Adapts across multiple markets and timeframes: This pattern is versatile and can be used on forex, stocks, crypto, and commodities. Whether on a 4-hour, daily, or even weekly chart, the structure holds the same meaning. Traders can adjust their strategies based on their preferred style without needing to relearn the pattern for different instruments.
What Are The Disadvantages Of The Three Inside Down Pattern?
Like any pattern, the Three Inside Down can fail when the broader market context is wrong, or when confirmation is lacking. Here are some key disadvantages to keep in mind:
- Needs strong context to succeed: The Three Inside Down works best near major resistance or exhaustion points. When it forms randomly inside ranges without broader structure, it often fails. Traders relying only on the candles without checking market positioning risk false signals.
- Weaker reliability during consolidations: In sideways or choppy markets, this pattern can appear frequently but without real follow-through. Without a strong trend beforehand, sellers may not have enough momentum to drive a reversal. It’s important to filter setups based on broader price action.
- Short-term reversals can be shallow: Even when it works, the reversal might only lead to a small pullback rather than a full trend change. Traders expecting large moves must manage expectations and structure trades accordingly. Risk-to-reward must be realistic based on the chart.
- Volume confirmation often missing: Many failed Three Inside Down setups occur with low or declining volume during the pattern. Without rising volume to confirm selling pressure, the pattern becomes a weak signal. Watching volume is crucial for filtering better opportunities.
- Higher timeframe trends can overpower it: If the Three Inside Down forms against the dominant trend on higher timeframes, it often fails quickly. A single pattern on a 1-hour chart means little if the daily or weekly chart is still bullish. Always check multiple timeframe alignment.
Can the Three Inside Down Pattern Have Failure Signals?
Yes, the Three Inside Down pattern can fail, even if it looks perfect at first glance. Recognizing common failure signals helps traders avoid low-probability trades and manage risk more effectively when conditions aren’t ideal.
Here are the most known factors from our research where the 3 Inside Down Pattern can fail:
- Pattern forms inside a consolidation zone: If the Three Inside Down appears while the market is ranging or chopping sideways, it often fails. Sideways environments have no clear momentum for sellers to push the market lower. Without a trending backdrop, the pattern becomes unreliable.
- Weak third candle confirmation: A third candle that closes with a small body, long lower wick, or indecision shows a lack of bearish commitment. Without a strong bearish close, the setup loses its impact. This weakens confidence in follow-through and invites whipsaws.
- Forms away from significant resistance: Patterns that appear in random areas without clear resistance above are far less trustworthy. Strong technical zones add selling pressure; without them, sellers lack backup to continue the move. Always match the pattern to proper locations.
- Volume declines during the third candle: If selling volume drops instead of rising on the third candle, it signals a lack of real selling pressure. Healthy reversals usually see increasing volume as new sellers commit. Weak volume undermines the entire structure.
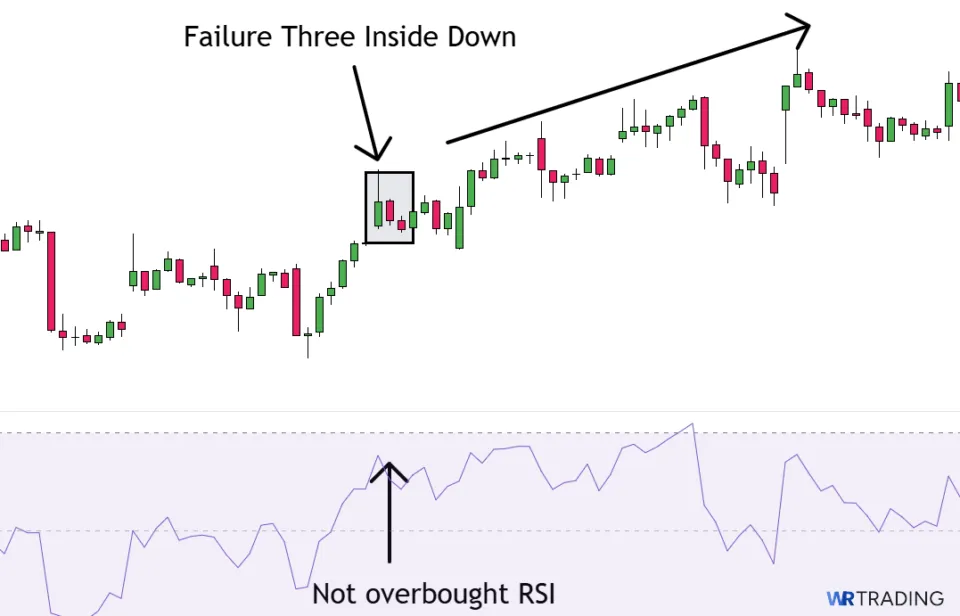
- Overbought conditions not present: When indicators like RSI or Stochastics aren’t showing overbought readings during the setup, the chance of reversal drops. Without exhaustion signs, buyers may still have strength. This missing confirmation often leads to failed trades.
- Macro or news events distort price action: Unexpected news releases, earnings announcements, or economic events can cause sharp moves that invalidate clean technical patterns. Even the best Three Inside Down setups can get ruined by outside news. Always monitor the news calendar.
- Immediate bullish reversal after the third candle: If the market immediately erases the move with a strong bullish candle right after the third candle closes, it signals that the Three Inside Down has failed. Quick bullish rejection shows that sellers didn’t gain real control, and buyers are ready to push back.
(Learn To Trade And Read Candlestick Patterns Like A Pro)
Which Indicators Can Be Combined With The Three Inside Down Pattern?
Pairing the Three Inside Down with the right indicators improves its reliability and helps confirm bearish momentum. Traders should use tools that measure trend strength, overbought conditions, and volume shifts to strengthen their setups.
- Relative Strength Index (RSI): When the Three Inside Down forms while RSI is above 70 or shows bearish divergence, it adds strong confirmation that momentum is reversing. Settings between 14-21 periods work best for balancing sensitivity without too much noise. An RSI downturn right after the pattern completes is a strong bearish signal.
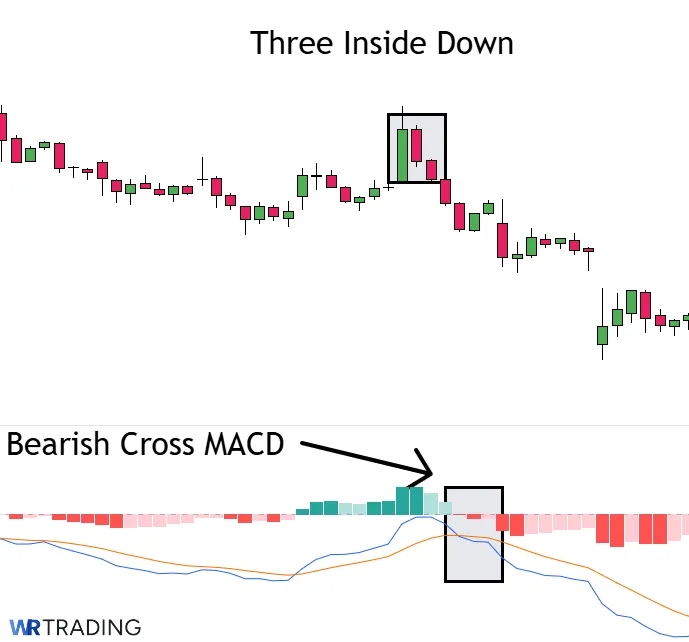
- MACD Crossovers: A bearish MACD crossover happening during or shortly after the Three Inside Down increases the pattern’s credibility. Using standard settings (12, 26, 9), look for the MACD line crossing below the signal line to validate the new bearish move. It shows that downside momentum is picking up beyond just candles.
- Volume Analysis (Rising Sell Volume): A spike in sell-side volume on the third candle strongly confirms the selling pressure behind the pattern. Without rising volume, reversals tend to be weak or short-lived. Traders should look for volume bars higher than the previous 5 to 10 sessions to mark meaningful selling interest.
- Stochastic Oscillator: The Stochastic Oscillator dropping below 80 while the Three Inside Down forms provides extra confirmation. Settings like 14,3,3 or 21,5,5 smooth out false signals. Fast downward crosses in the overbought region support the idea that buyers are losing control.
- 20 or 50 EMA Rejection: If the Three Inside Down forms near a falling 20 EMA or 50 EMA and the price rejects off it cleanly, the pattern becomes much stronger. These moving averages act as dynamic resistance, especially when the broader trend is already softening. A clear rejection helps confirm that sellers remain in control.
Alternatives to the Three Inside Down Pattern:
| Pattern | Type of Pattern | Best Use Case | Key Characteristics / Conditions |
|---|---|---|---|
| Evening Star | Bearish Reversal (3 Candles) | Spotting a shift from strong buying to new selling pressure after an uptrend. | First candle is bullish, second is small-bodied showing indecision, third is a strong bearish close erasing much of the first candle’s gains. |
| Bearish Engulfing | Bearish Reversal (2 Candles) | Catching early reversal signs after a bullish swing. | Second candle fully engulfs the prior bullish candle’s body, signaling a shift in control from buyers to sellers. |
| Shooting Star | Bearish Reversal (Single Candle) | Identifying exhaustion after sharp bullish moves or rallies. | Small real body near the low, long upper wick, minimal lower wick, signaling rejection of higher prices. |
| Harami | Bullish or Bearish Reversal (2 Candles) | Watching for early momentum pauses inside trends. | Second candle is small and fully inside the previous candle’s body, indicating reduced momentum and possible reversal. |
| Tweezer Top | Bearish Reversal (2 Candles) | Spotting failed attempts to break new highs in an uptrend. | Two candles print similar highs, with rejection and closing lower, highlighting seller presence at resistance. |
Download our Candlestick Patterns Cheat Sheet to find more accurate alternatives.
What Is the Difference Between the Three Inside Down and the Three Inside Up Pattern?
The Three Inside Down and Three Inside Up patterns are built on the same candle structure but predict opposite outcomes. The Three Inside Down is a bearish reversal signal, where the market moves from bullish strength to new selling pressure. In contrast, the Three Inside Up is a bullish reversal signal, showing that selling momentum is fading and buyers are taking back control.
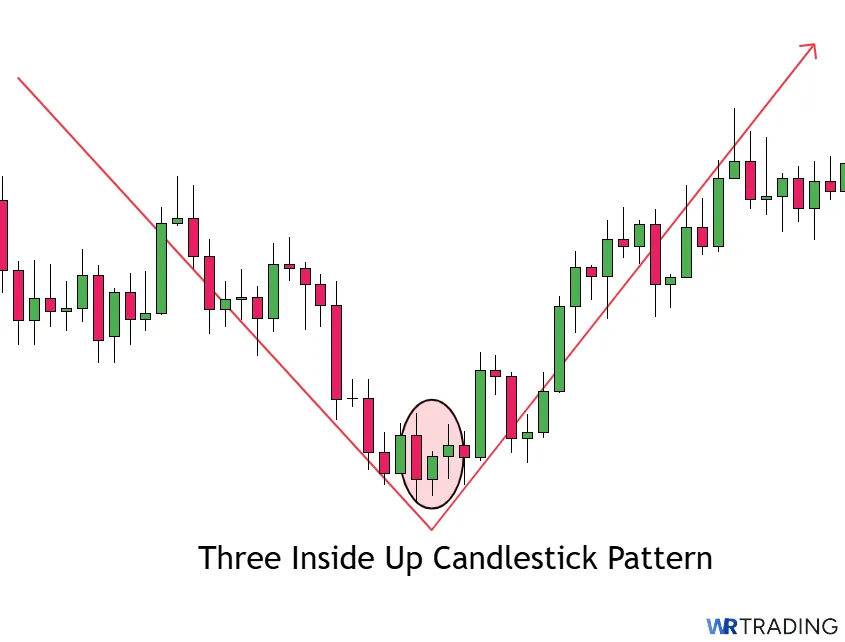
Another important difference is the market context in which they form. The Three Inside Down develops after an uptrend, warning that the bullish move is running out of buying power. The Three Inside Up appears after a downtrend, marking the end of selling pressure and the start of a potential rally.
| Section | Three Inside Down | Three Inside Up |
|---|---|---|
| Construction | First Candle: Strong bullish candle. Second Candle: Smaller red candle inside the first candle’s body. Third Candle: Strong bearish close beneath the first candle’s open. | First Candle: Strong bearish candle. Second Candle: Smaller candle inside the first candle’s real body. Third Candle: Strong bullish close above the first candle’s open. |
| Forecast | Signals a transition from bullish exhaustion to new bearish momentum. | Signals a transition from selling pressure to renewed bullish control. |
| Type of Pattern | Three-candle bearish reversal pattern. | Three-candle bullish reversal pattern. |
| Trend Prior to Pattern | Forms after an uptrend, where buyers are losing strength. | Forms after a downtrend, where sellers are losing control. |
| Opposite Pattern | Three Inside Up. | Three Inside Down. |
What Are The Limitations Of The Three Inside Down?
The Three Inside Down can be a useful bearish reversal signal, but it has limitations that traders need to recognize. Certain market conditions and pattern variations can cause it to fail or give false confidence.
- Forms less reliably if there’s no strong uptrend beforehand.
- Weak third candles reduce the strength of the reversal signal.
- Can easily fail in choppy or sideways markets.
- Needs volume or resistance confirmation to increase its success rate.
- Overlapping or unclear second candles can make the setup harder to trust.
Learn Pattern Trading With the WR Trading Mentoring
The Three Inside Down is not just about seeing three candles in a row. Success with this pattern comes from understanding the story behind the price action and knowing when the setup actually matters. That is where WR Trading Mentoring makes a real difference. Traders learn how to connect the pattern with larger market movements, spot hesitation inside strong rallies, and use real context like resistance zones and volume shifts to separate strong signals from weak ones.
Mentoring focuses heavily on structure and confirmation. Instead of treating every Three Inside Down the same, students are taught how to judge momentum shifts, recognize early signs of trend exhaustion, and manage risk based on actual chart behavior. WR Trading builds the ability to turn patterns into real trades with clear reasons behind every decision, not just blind recognition. Consider joining now.
(Learn To Trade And Read Candlestick Patterns Like A Pro)
Conclusion: Profitable Candlestick Three Inside Down Pattern
The Three Inside Down pattern offers a clear and structured way to spot early signs of trend exhaustion in bullish markets. When it forms at resistance levels or after stretched rallies, it becomes a powerful tool for anticipating reversals before broader confirmation appears. Its three-candle sequence shows a clear transition from buying strength to selling pressure, helping traders build structured short setups with strong technical reasoning.
It works best when paired with supporting evidence like volume confirmation, momentum shifts, and key price zones. Take the time to combine this pattern with broader market context, and you’ll find it a reliable addition to a trading plan.
FAQs: Most Frequently Asked Questions on Three Inside Down Pattern
What Does a Three Inside Down Pattern Indicate?
The Three Inside Down pattern signals a potential bearish reversal after an uptrend or rally. It shows that bullish momentum is slowing, and sellers are starting to gain control. Traders use it as an early warning to exit long positions or prepare for short opportunities.
Can You Trade the Three Inside Down Alone?
Yes, while you can technically trade it alone, combining it with technical tools improves your odds significantly. Confirmation through indicators like RSI or support/resistance zones adds more weight to the setup. Relying only on the candlestick formation can lead to weaker results.
What Timeframes Work Best for the Three Inside Down?
The Three Inside Down tends to perform better on higher timeframes such as the 4-hour, daily, or weekly charts. Lower timeframes can create more noise and false signals. Stronger patterns usually appear when the market has room to trend after the reversal.
What Is the Psychology Behind the Three Inside Down?
The pattern reflects a shift where buyers lose conviction after a rally, and sellers step in with more strength. The inside candle shows hesitation, and the bearish confirmation candle shows a turning point. It is a visible clue that sentiment is changing on the chart.
Can Beginners Use the Three Inside Down Pattern?
Yes, beginners can use it, but it is important to study the context carefully. Simply memorizing the pattern without understanding the trend and support/resistance will lead to weak trades. Practice combining the pattern with broader technical analysis first.