A Three Line Strike is a four-candle continuation pattern that typically appears during a trend. It warns that counter-trend pressure is entering the market to try and offset the trend. The first three candles enforce the trend direction, while the fourth candle opens above the close of the prior candle and engulfs the bodies of the previous three candles completely. This sudden shift often signals the potential start of a downward move.
The ideal time to enter a trade is when the Three-Line Strike pattern is complete, specifically after the fifth candle appears. This approach allows traders to confirm the pattern’s direction and minimizes the risk of acting on false signals. Stop-loss can be placed either below the low of the fourth (red) candle for a bullish pattern or above the high of the fourth (green) candle for a bearish pattern.
(Learn To Trade And Read Candlestick Patterns Like A Pro)
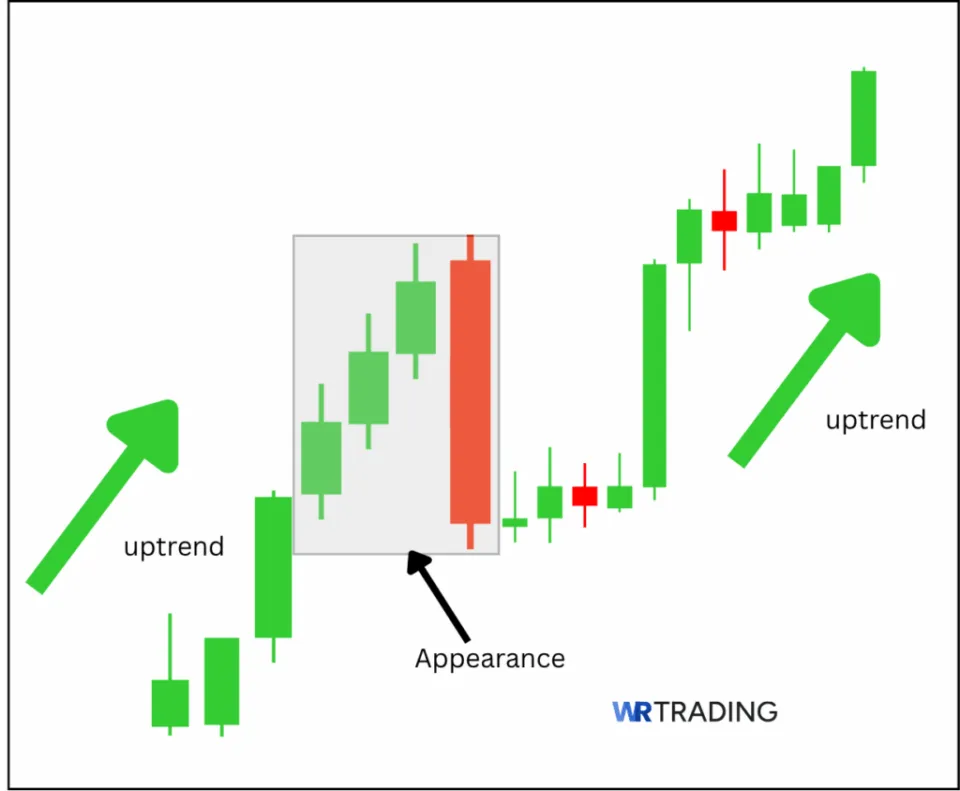
What Is a Bullish Three Line Strike Pattern?
The Bullish Three Line Strike is a four-candle continuation pattern that forms during an Uptrend. The setup begins with three consecutive green candles, each closing higher, signifying strong upside momentum. The fourth red candle suddenly reverses this move, creating a large bearish candle that engulfs the three prior candle bodies entirely.
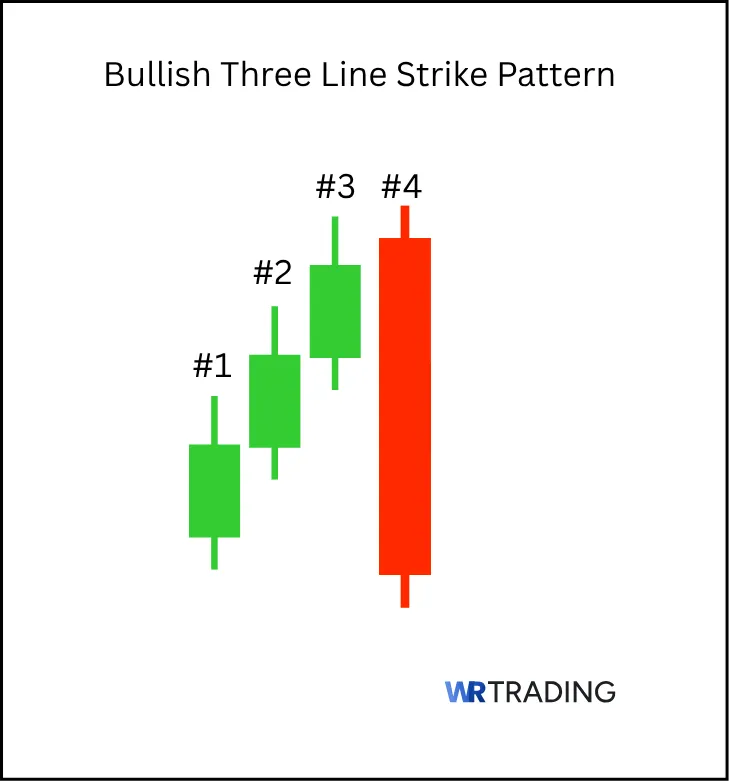
This powerful move often signifies a contention by sellers against the trend. The engulfing candle takes out weak buyers in the market, but is not strong enough to overturn the longer uptrend. The bullish Three-Line Strike Pattern marks a point where buyers aggressively push back against short-term selling.
This pattern works because it traps sellers who enter their positions based on the strength of the engulfing candle. Many traders who were confident in further downward momentum are caught off guard when the larger uptrend continues.
Key Facts of The Bullish Three-Line Strike Candlestick Pattern:
- 1st, 2nd, 3rd Candles: Three bullish candles, each closing higher
- 4th candle: One large bearish candle, engulfing the bodies of all three prior candles.
- Type of Pattern: Bullish continuation.
- Trend Prior to Pattern: Uptrend
- Opposite Pattern: Bearish Three Line Strike Pattern
- Entry Option: High of the fourth candle
- Stop-Loss Placement: The low of the fourth candle
- Interpretation: Strong buyer dominance after short-term selling reflects a psychological shift where buyers overpower sellers.
What Is a Bearish Three Line Strike Pattern?
The Bearish Three Line Strike is a four-candle continuation pattern with three consecutive red bearish candles followed by a large green bullish candle. The first three candles are aligned in a downward sequence, each closing lower than the last, reinforcing the ongoing downtrend. The fourth candle sharply reverses this, forming a long green candlestick that completely engulfs the bodies of the three prior candles.
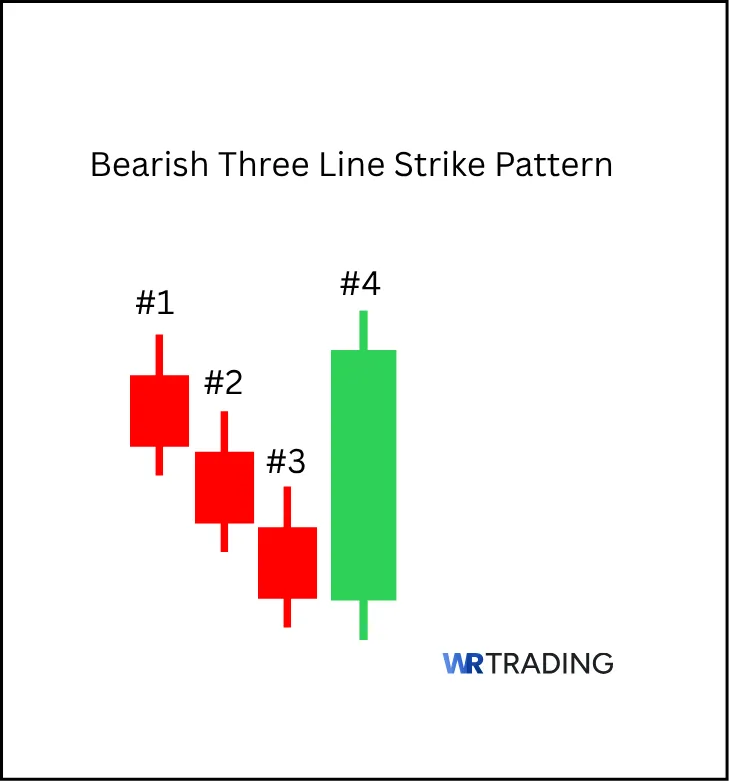
This action signifies a contention of buyers against selling pressure in the market. The pattern signifies the failed effort of buyers who tried to take control after a sustained downward move.
The pattern works because it traps buyers who expect the bullish engulfing candle to continue an uptrend in a false move. After the fourth green candle closes and the downtrend resumes, many of those traders who entered buy positions are forced to close their positions or are stopped out.
Key Facts of The bearish Three Line Strike Candlestick Pattern:
- 1st, 2nd, 3rd Candles: Three bearish candles, each closing lower
- 4th candle: One large bullish candle, engulfing the bodies of all three prior candles.
- Type of Pattern: Bearish continuation.
- Trend Prior to Pattern: Downtrend
- Opposite Pattern: Bullish Three Line Strike Pattern
- Entry Options: low of the fourth candle
- Stop-Loss Placement: The high of the fourth candle
- Interpretation: The pattern represents a shift in psychology, as sellers dominate the market, ending short-term buying pressure.
(Learn To Trade And Read Candlestick Patterns Like A Pro)
How Is The Three Line Strike Pattern Formed?
The Three Line Strike pattern is a four-candle formation that appears in trending markets. It is designed to signal a strong continuation of the prevailing trend after a brief corrective phase. There are bullish and bearish versions, depending on whether the market is trending up or down before the pattern forms.
In a bullish Three Line Strike, the market forms three consecutive green candles, each with higher closes, showing steady buying pressure. The fourth candle is a long red candle that opens higher but then completely engulfs the three previous candles by closing below their starting point. While this looks bearish at first glance, it’s actually a bullish continuation signal because after the engulfing drop, the trend often resumes upward.
In a bearish Three Line Strike, the market prints three consecutive red candles, each closing lower, confirming seller control. The fourth candle is a long green candle that opens lower but rallies to completely engulf the three prior candles, closing above their starting point. Despite the bullish appearance, this is a continuation signal for the downtrend.
The pattern requires four candles total and works best in clean, established trends. We prefer to trade it on 4H, Daily, or Weekly charts for better signal strength.
What Does The Three Line Strike Candlestick Pattern Indicate?
The Three Line Strike pattern means there is a temporary battle between buyers and sellers inside a trending market, but one side remains in control. While the fourth candle appears to reject the prior three candles, it works as a continuation signal, not a reversal. The key is understanding the market psychology behind the setup.
Historically, wherever such characteristics formed, it shook weak hands out of the market before continuing the original trend. So, we treat the Three Line Strike as a psychological trap. Its real strength is in the continuation, not in the impulsive fourth candle.
Where Does the Name of the Pattern Three Line Strike Come From?
The name “Three Line Strike” comes from the combination of three candles forming in the direction of the trend, followed by a “strike,” a fourth candle that aggressively engulfs all three. The “three lines” refer to the consecutive candles with rising or falling closes, while the “strike” represents the sharp, counter-directional move. Despite the strike, the original trend usually wins.
(Learn To Trade And Read Candlestick Patterns Like A Pro)
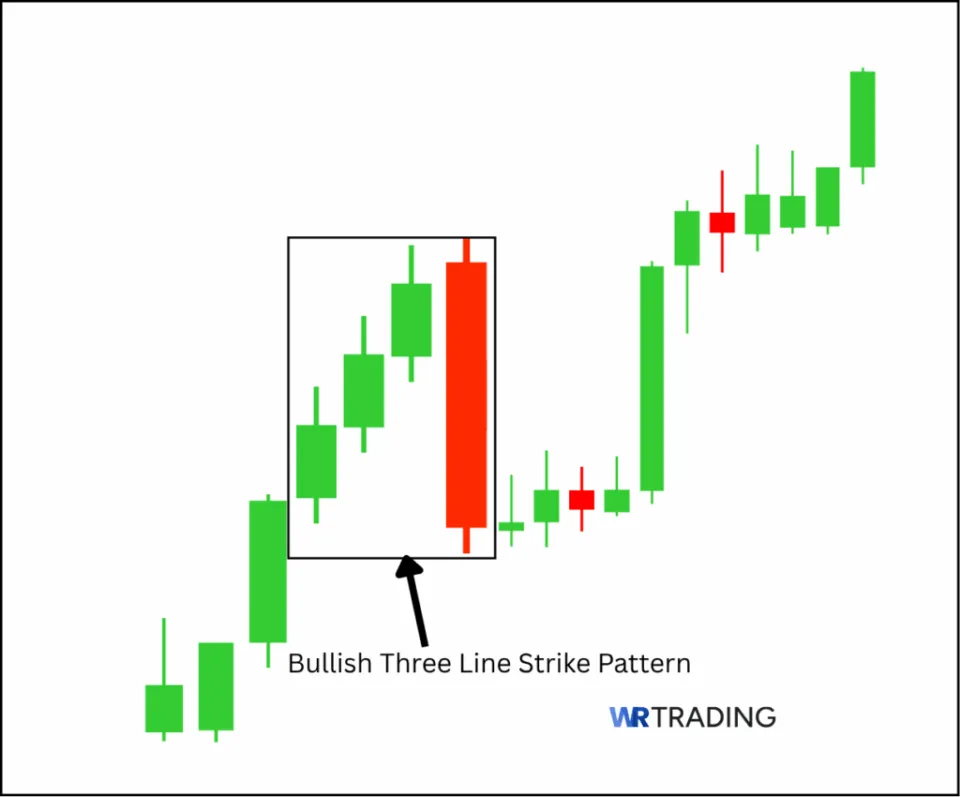
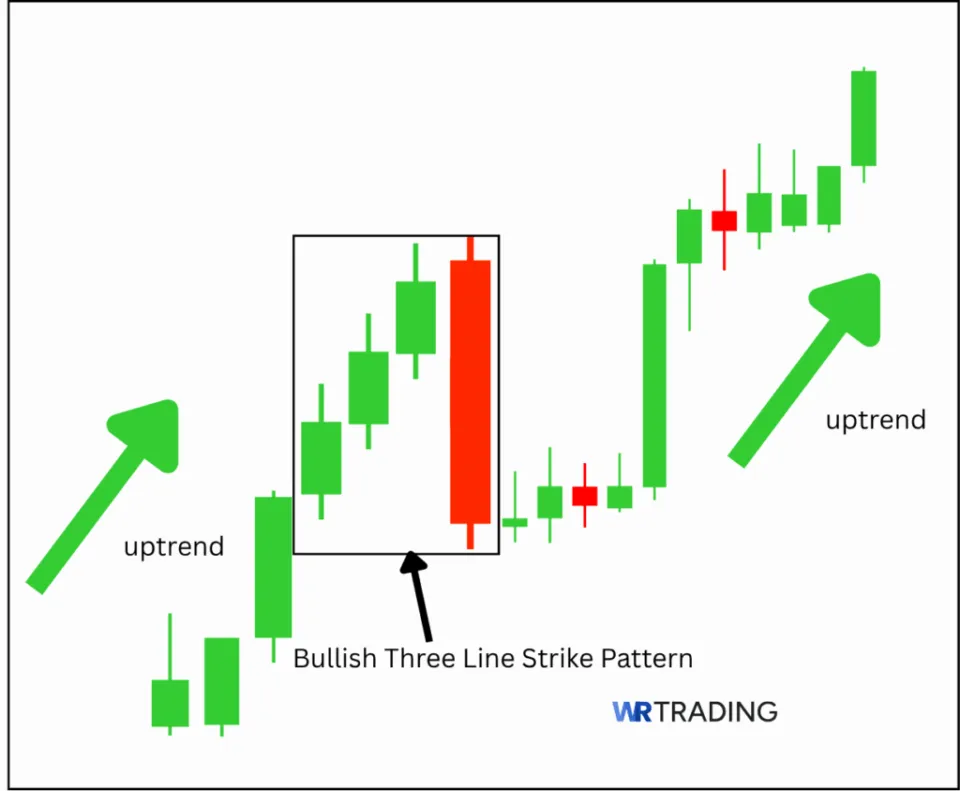
What Is An Example Of The Three Line Strike Pattern?

A textbook bullish Three Line Strike formed on the AAPL daily chart between July 24 and July 27, 2017.
- First Three Candles (Bullish): The stock was trending higher. From July 24 to July 26, the stock produced three consecutive green candles, with closes rising from 38.02 to 38.37, confirming steady bullish momentum.
- Fourth Candle: On July 27, the market opened higher at 38.44, then dropped sharply, reaching 36.83 before closing at 37.64, engulfing the range of the previous three bullish candles completely.
Although the fourth candle suggested a bearish breakout, price reversed again shortly after, resuming the uptrend and rallying toward 41.24 by early September. This confirmed the continuation power of the bullish Three Line Strike, trapping premature sellers before the trend continued higher.
How To Identify The Three Line Strike Pattern
Here’s how to spot the Three Line strike pattern:
- Identify the Prior Trend: The pattern only forms inside an active trend, not at turning points.
- First Three Candles: Look for three consecutive candles in the trend direction, each closing higher (for bullish) or lower (for bearish). They should have full bodies, showing commitment.
- Fourth Candle: It must be a large, opposite-colored candle that engulfs all three of the previous candles, closing beyond their starting points.
- Where to Search: Focus on 4H, Daily, or Weekly charts during pullbacks or near trendlines, Fibonacci levels, or moving averages.
We scan for this setup near clean continuation zones, not just randomly in trends. The pattern means nothing without context. When it aligns with major structure or key zones, that’s when it gets our attention.
(Learn To Trade And Read Candlestick Patterns Like A Pro)
How To Trade The Three Line Strike Pattern
Trading the Three Line Strike Pattern requires a strategy that includes recognising the pattern, confirming the trade, and managing the trade properly. Below is the exact method we use to turn this pattern into structured trades. Here’s how to trade it step by step:
- Find the Right Setup For The Three Line Strike
- Wait For The Appearance Of The Three Line Strike Candlestick Pattern
- Open Your Trade – Entry Point
- Wait For A Confirmation Or Not
- Choose Your Trading Take Profit
1. Find The Right Setup For The Three Line Strike
Start by identifying a strong, established trend. For bullish setups, look for an uptrend with clear higher highs and higher lows. For bearish setups, confirm a downtrend with lower highs and lower lows. The pattern works best after a pullback to key levels like:
- Support or resistance zones from previous price structures
- Fibonacci retracement levels (0.382, 0.5, or 0.618)
- Dynamic support from moving averages like the 20 EMA or 50 EMA
- Retests of broken structures or trendlines
We focus on 4H, Daily, or Weekly charts where market structure is cleaner, and the probability of continuation is higher.
2. Wait For The Appearance Of The Three Line Strike Candlestick Pattern
Once you’ve identified a valid trend and zone, wait for the full formation of the pattern before executing a trade. Look for:
- Three consecutive candles in the direction of the trend, each with full bodies and strong closes.
- A fourth candle of the opposite color that completely engulfed the three previous candles.
- Situations where the pattern occurred within a structure, not randomly inside a move.
Do not enter incomplete patterns. Wait for the fourth candle to close before making trade decisions.
3. Open Your Trade – Entry Point
Once the full pattern forms, we prepare our entry. Either of these two entries can be used.

- Aggressive: Enter at the close of the fourth engulfing candle, relying on the continuation strength of the trend.
- Conservative: Wait for the next candle to break in the direction of the original trend before entering.
Here’s how to set your stop loss:
- For bullish setups: Below the low of the fourth candle.
- For bearish setups: Above the high of the fourth candle.
For position sizing, set your risk per trade at 1% or 2% at most, and ensure to use a pip or position calculator to maintain consistency in risk.
4. Wait For A Confirmation Or Not
Depending on market conditions, you may want confirmation before entering. Confirmation is necessary when:
- The fourth candle forms on low volume.
- The market is approaching a conflicting resistance or support zone.
- Volatility is unpredictable.
We often skip confirmation if the pattern forms perfectly on a structure with strong volume.
5. Choose Your Trading Take Profit
Profit-taking should be based on structure and extension levels, and nothing else. Here’s a breakdown of our exit method:

- Target 1 (TP1): Nearest swing high or low in the trend direction or 1.272/1.618 Fibonacci extension.
- Target 2 (TP2): The next swing high or low.
- Risk-to-Reward Ratio: A minimum of 1:2. Whenever a setup cannot offer this, we avoid the trade.
- Optional trailing: For strong trends, we trail stops behind structure after the first target is hit.
For us, this structured process removes guesswork. The Three Line Strike works, but it only works when used with discipline and confluence.
(Learn To Trade And Read Candlestick Patterns Like A Pro)
Which Strategies Can Be Used For The Three Line Strike Candlestick Pattern?
We combine the Three Line Strike pattern with certain key trading phenomena to filter weak setups, ensuring the setups we trade are more accurate. This pattern is not a standalone signal; its power comes from confluence with technical tools and structured zones. Below are the most effective strategies we use to trade it:
1. Support and Resistance Strategy
Here’s a simple run-down of the strategy:
- How it Works: Wait for the Three Line Strike to form directly at a key support or resistance zone.
- Bullish Setups: The pattern should appear at major support levels within an uptrend.
- Bearish Setups: Look for the pattern forming at significant resistance during a downtrend.
- Execution Tip: Confirm that the structure has been tested previously for better reliability.
2. Volume-Based Confirmation Strategy
Here’s a simple run-down of the strategy:
- How it Works: Low volume on the fourth candle confirms a false breakout.
- Why it Matters: High volume after engulfing candles suggests that the fake-out was deliberate and the original trend is likely to resume.
- Execution Tip: Avoid trading this pattern on declining or inconsistent volume.
3. Breakout Strategy
Here’s a simple run-down of the strategy:
- How it Works: Use the Three Line Strike as a pre-breakout setup. Enter when price breaks the high (bullish) or low (bearish) of the engulfing fourth candle.
- Entry: Set stop-loss beyond the opposite end of the fourth candle for safety.
- Execution Tip: Combine with retest entries after breakout for higher probability.
6. Fibonacci Confluence Strategy
Here’s a simple run-down of the strategy:
- How it Works: Plot Fibonacci retracements over the trend move and look for the Three Line Strike to form at 0.382, 0.5, or 0.618 retracement levels.
- Why it Works: These levels often act as natural reversal or continuation zones.
- Execution Tip: Confirmation with MACD or RSI adds strength to the trade.
We use multiple methods individually and simultaneously. The more confluence, the better the setup.
What Is The Success Rate Of The Three Line Strike Candlestick Pattern?
The Three Line Strike candlestick pattern has a success rate that generally ranges between 50% and 80%, as explained by Thomas Bulkowski in his research. The bullish Three Line Strike had a continuation success rate around 50%, while the bearish version scored a higher 80% success rate when tested across historical data.
These numbers reflect ideal conditions, not random chart appearances. In our internal testing across multiple markets and timeframes, our results corroborate this data. Some factors that influence the hit rate include:
- Market Structure: The pattern performs best when aligned with clear trends. In ranges or sideways conditions, the win rate drops sharply.
- Volume: High volume during or after the fourth candle adds credibility.
- Timeframe: Higher timeframes (4H, Daily, Weekly) improve pattern reliability.
- Confirmation Tools: Using MACD, RSI, or Fibonacci zones with the pattern increases the probability of success.
- Position of the Pattern: The closer the formation is to key technical levels, the better the outcome.
Used with a structured process, the Three Line Strike becomes a consistently productive tool.
Is the Three Line Strike Candlestick Pattern Suitable For Beginners?
Yes, the Three Line Strike pattern is suitable for beginners. The setup is easy to recognize: three candles in the trend direction, followed by one large opposite-colored candle. On higher timeframes like the 4H or Daily chart, it helps newer traders stay focused on bigger, cleaner moves. It also introduces beginners to how professional setups often trap weak hands before continuing in the original trend.
The challenge is interpretation. Many new traders incorrectly assume that the large fourth candle signals a reversal when it’s really just a temporary shakeout. Trading it without context leads to frustration.
(Learn To Trade And Read Candlestick Patterns Like A Pro)
What Are The Pros And Cons Of the Three Line Strike Pattern?
Pros
- Visually clear and easy to recognize
- Works well on higher timeframes
- Signals a strong continuation after corrective moves
- Can trap opposing traders for momentum continuation
Cons
- Can be misinterpreted as a reversal
- Loses strength if traded in sideways markets
- Needs confirmation to avoid false signals
- Failure rate increases without structure and context.
What Are The Advantages Of The Three Line Strike Pattern?
The Three Line Strike pattern is valuable for its simplicity, continuation strength, and ability to trap emotional traders on the wrong side of the market. Let’s look at these in more detail:
- Visually Clear and Easy to Recognize: The four-candle sequence is distinct: three candles in one direction followed by a large engulfing candle. This clarity makes it accessible to beginners and efficient for scanning charts quickly.
- Works Well on Higher Timeframes: On 4H and Daily charts, this pattern stands out from market noise. It forms after trending moves and provides traders with high-probability continuation opportunities.
- Signals Strong Continuation After Corrective Moves: The engulfing fourth candle often shakes weak traders out of positions. Once that liquidity is cleared, the original trend resumes, often with momentum.
- Can Trap Opposing Traders: The engulfing move pulls in countertrend traders, creating better conditions for trend continuation in favor of disciplined traders.
What Are The Disadvantages Of The Three Line Strike Pattern?
While the pattern has strengths, it’s not without flaws. Below are some of its disadvantages:
- Can Be Misinterpreted as a Reversal: New traders often see the engulfing fourth candle and assume the trend is over, when it’s actually setting up to continue.
- Loses Strength if Traded in Sideways Markets: In consolidation zones, the pattern loses meaning. Without directional bias, it can easily fail.
- Needs Confirmation to Avoid False Signals: Without supporting indicators or structure, it becomes a guessing game. We never trade it alone.
- Failure Rate Increases Without Structure and Context: Without trend structure or technical levels supporting it, the probability of success drops sharply.
Can The Three Line Strike Have Failure Signals?
Yes, the Three Line Strike can fail, often with noticeable frequency, if used without confirmation. Failure typically occurs when:
- The pattern forms in sideways or choppy markets.
- The fourth candle packs volume, meaning it may just be a random retracement.
- There’s no alignment with trend structure or technical zones.
- Traders enter emotionally on the fourth candle without considering broader market conditions.
We avoid relying solely on the visual appeal of the pattern. It’s just one piece of a larger system, not a guaranteed outcome by itself.
Which Indicators Can Be Combined With The Three Line Strike To Increase Its Success?
Pairing the Three Line Strike with indicators helps confirm the continuation move and avoid weak setups. Below are the best tools we use:
| Indicator | Settings | How to Use It |
|---|---|---|
| RSI | 14-period | Look for RSI holding above 50 in bullish setups or below 50 in bearish ones. RSI divergence adds strength. |
| MACD | 12, 26, 2009 | Use MACD crossovers in the direction of the original trend. Shrinking histogram bars before the strike increases reliability. |
| Volume | Simple or Session Profile | Confirm the pattern with a volume spike during or right after the fourth candle to validate momentum continuation. |
| Fibonacci | 0.382 / 0.5 / 0.618 retracement levels | Look for the pattern to form at Fibonacci pullback zones for added confluence. Combine with RSI or MACD. |
These tools are part of every trade checklist. Confluence creates confidence. We do not trade the pattern.
(Learn To Trade And Read Candlestick Patterns Like A Pro)
What Are Similar Patterns To The Three Line Strike Pattern?
Here are some alternatives that share structural or psychological similarities with the Three Line Strike:
| Pattern | Type | Description |
|---|---|---|
| Engulfing Pattern | Reversal (Bullish/Bearish) | Two-candle reversal where the second candle fully engulfs the first. Can mark turning points. |
| Three Inside Up/Three Inside Down | Reversal (Bullish/Bearish) | Three-candle reversal where the second and third candles confirm a reversal. |
| Separating Lines | Continuation (Bullish/Bearish) | Same opening price on the second candle, reinforcing trend continuation. Similar psychology of trend strength. |
| Breakaway Pattern | Continuation (Bullish/Bearish) | Five-candle continuation pattern showing initial consolidation followed by breakout continuation. |
| Three White Soldiers / Three Black Crows | Reversal / Continuation | Consists of three strong candles, moving consistently in one direction. |
No singular pattern is a goldmine. Knowing these candlestick pattern types and how to utilize them will be handy in varying market conditions. To find more alternatives, you can see our Candlestick Bible PDF.
What Is The Opposite Pattern Of The Three Line Strike?
The opposite pattern of the Three Line Strike is the Engulfing Pattern, but when used as a reversal setup instead of a continuation. In an Engulfing Pattern, the second candle fully engulfs the first and signals that the market may reverse direction.
The Three Line Strike, by contrast, uses an engulfing fourth candle within a trend to trap weak traders and then continue in the original direction. Where engulfing signals change, Three Line Strike confirms trend persistence.
What Are The Limitations Of The Three Line Strike Pattern?
Even though the Three Line Strike can be powerful, it has clear limitations:
- Weak in Sideways Markets: Without a strong trend, the pattern provides no clear directional edge.
- Misinterpretation Risk: New traders often confuse the fourth engulfing candle as a reversal.
- Not a Standalone Signal: Must be paired with market structure, indicators, and risk management to work consistently.
Learn Pattern Trading With The WR Trading Mentoring
At WR Trading, we teach you how to turn patterns like the Three Line Strike into consistent trades. In our mentoring program, we break down setups with a structured, step-by-step process built for real market conditions.
With us, you’ll learn how to combine candlestick patterns with confirmation indicators to cut out false signals. We teach how to use multi-timeframe technical analysis for better entries and show you how to build trading routines that stack small wins into consistent growth. You’ll also learn how to filter weak setups using precise risk control, so every trade has structure behind it.
We don’t trade patterns for the sake of it; we build systems around them. Whether you’re new or experienced, our mentoring will help improve your candlestick pattern utilization.
(Learn To Trade And Read Candlestick Patterns Like A Pro)
Conclusion: Trade the Three Line Strike With Precision
The Three Line Strike candlestick pattern is a strong continuation signal that excels when combined with structure, confirmation, and discipline. It works by trapping weak traders, forcing early exits before the trend continues. The pattern’s strength lies in the psychology driving the move rather than the candlestick formation itself.
To effectively trade the Three-Line Strike, enter the market after the fifth candle appears, confirming the pattern’s direction. Place your stop-loss below the low of the fourth candle for bullish setups or above the high of the fourth candle for bearish setups. This pattern is ideal for catching continuation setups, confirming key zones, and building trading discipline when used as part of a comprehensive trading system.