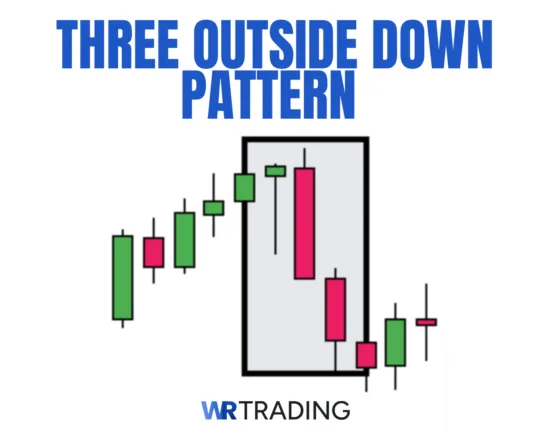
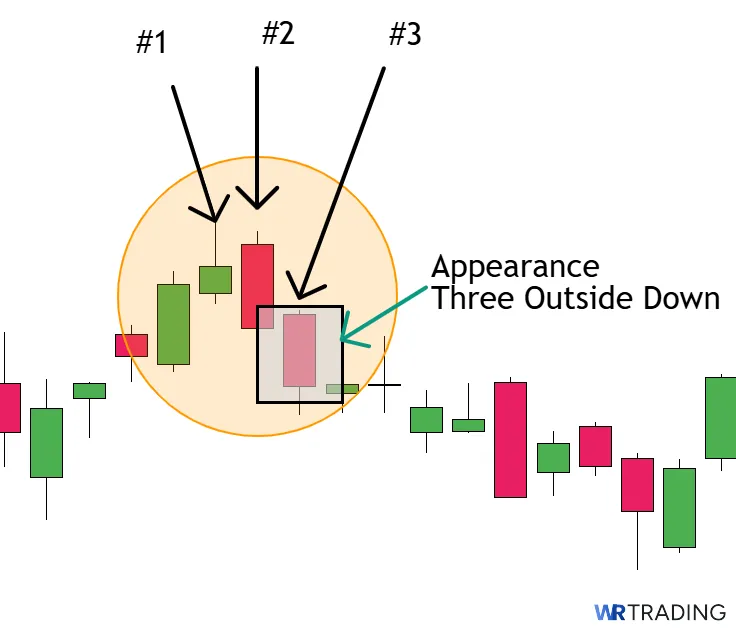
The Three Outside Down is a three-candlestick bearish reversal pattern that appears in an uptrend or a retracement of a downtrend. The key characteristics include a bullish first candle, a larger bearish second candle that engulfs the first, and a third bearish candle. This structure represents a clear shift from buyer strength to a sudden flood of sellers.
Traders typically ‘go short’ after the third candle closes with additional confirmation from indicators or price structure. The three outside down has up to 70% success rates in predicting bearish reversals and continuations.
This guide will clearly explain the meaning, formation, and strategy behind the Three Outside Down pattern, along with real chart examples in forex and other markets. We’ll also break down how accurate this pattern is and what it can signify, as well as explore methods for using it in live trading.
Key Facts of the Three Outside Down:
- Construction:
- First Candle: Small bullish candle (left)
- Second Candle: Large bearish engulfing candle (right)
- Third Candle: Similarly large bearish candle closing below (furthest right)
- Type Of Pattern: Reversal
- Trend Prior The Pattern: Bullish
- Opposite Pattern: Three outside up
- Entry Options: Standard, momentum, breakout plus retest, indicator-assisted
- Stop-Loss Placement: Above candle 2’s high, above candle 1’s high; ATR-based stop loss; above nearest resistance zone
(Learn To Trade And Read Candlestick Patterns Like A Pro)
How Is The Three Outside Down Pattern Formed?
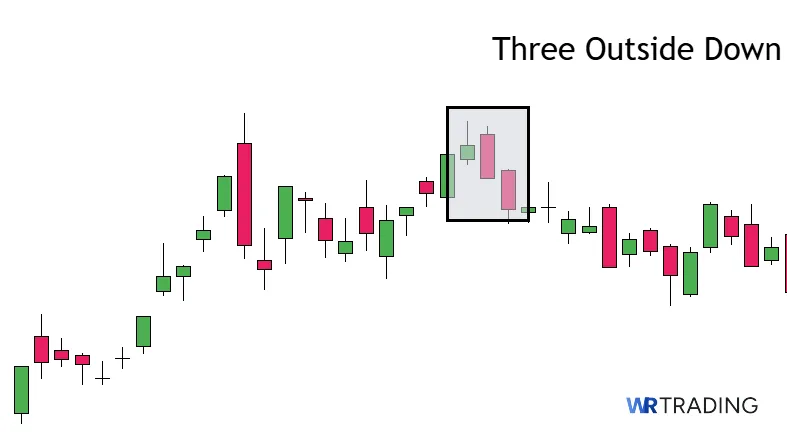
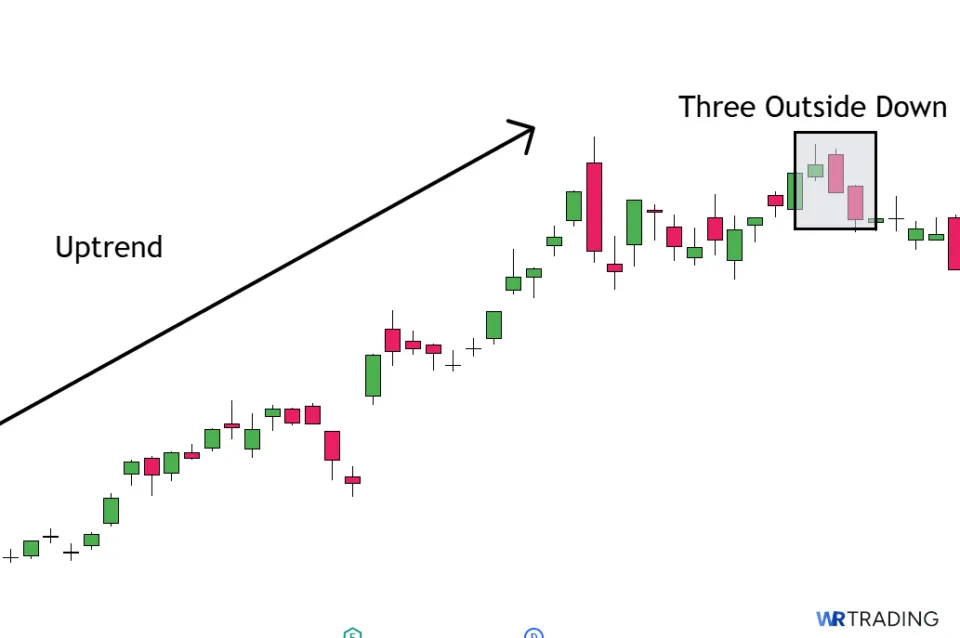
The Three Outside Down occurs in an established uptrend or as a swing high from a downtrend. Depending on the move, at least 5-10 various candles over any time period precede the pattern.
The first candle of the actual formation is bullish and must be about the same size as those before it. This suggests that, while buyers are still in the picture, bullish momentum may be relatively low.
The second candle is bearish and engulfs the entire body of the first. It suggests a notable shift in momentum with the potential for renewed selling interest. Also, this bar opens higher (telling us that buyers initially pushed the price up) before closing lower.
Finally, we have the third candle, a bearish candle that closes lower than the second. It can be of a similar or smaller size, but must show the same intent. This candle serves to validate the new bearish momentum further. The expected bars after this would primarily be bearish, demonstrating to traders that a downtrend is happening.
What Does The Three Outside Down Candlestick Pattern Mean?
The psychological theme or interpretation of the Three Outside Down is rejection. Essentially, buyers have tried to push the market higher, but this attempt is firmly rejected by overwhelming selling pressure.
The formation starts with optimism or bullish confidence, where buyers have driven the price upward. The second candle is where the power shift begins, a sign that the bears have stepped in dramatically and overpowered the bulls. The third candle proves the fear and that this change isn’t a fluke. It reinforces follow-through selling and suggests that the sentiment is now bearish.
What Is An Example Of The Three Outside Down Pattern?
Let’s look at a few examples of this formation on the charts:
The first example is the three outside down pattern on the daily chart of EUR/USD: a downtrend retracement. Here, the setup appeared after a notable pullback between the 50% and 61.8% Fibonacci levels, a great area for a turning point.

The next illustration is on the weekly chart of GBP/USD, where we see the setup as a reversal on the 1.43450 key resistance.
oth of these examples show the two most ideal occurrences for the three outside down: trends and reversals. Of course, it can appear in a range at its upper boundary (i.e., resistance). The market may exceed the pattern, or the red candles may trigger a drop back into the range.
(Learn To Trade And Read Candlestick Patterns Like A Pro)
How To Identify The Three Outside Down Pattern
Here are the key factors to follow in identifying this formation:
1. Look for an Established Uptrend
With the three outside down being a reversal pattern, traders should scan for clear trends. The pattern can appear at the end of an uptrend, or as a swing high or pullback of a downtrend.
2. Scan for the Three-Bar Structure
Next, precisely identify this specific three-bar structure of the pattern by considering each candle:
Candle 1: This green bullish candle is full-bodied or has a decent body with minimal wicks. It suggests some buying pressure still exists, but compared to the bars preceding it, it is usually smaller.
Candle 2: This candle is the heart of the three outside down. It will reach a higher point than the first but become a noticeably large, long bearish candle (either full-bodied with minimal tails or similar size with some wick).
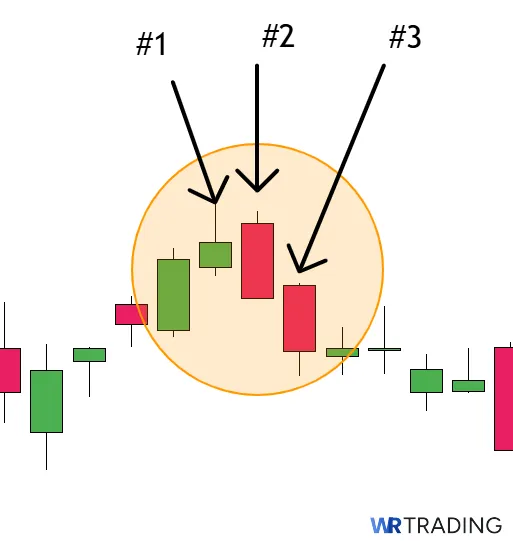
Most importantly, it must engulf the previous candle. Both of these features result in strong bearish conviction.
Candle 3: We regard this bar as the confirmation of the entire setup. This candle should be of similar structure and size to the middle one. Also, it must close lower. It indicates that the trend is more likely than before to move to the downside.
3. Check Pattern Location
Needless to say, context is key. You may have a visible trend and the perfect structure. However, the pattern won’t be as effective without the proper location.
A market moving into a known resistance level or zone is a prime setup for the three outside down. These could be:
- Previous swing highs or price ceilings
- Fibonacci retracement levels, especially 61.8% or 78.6%
- Trendline resistance from earlier peaks
Additionally, traders can use momentum indicators like the Relative Strength Index/RSI and Bollinger Bands to identify overbought conditions. Alternatively, they can try the RSI or the MACD to find divergence.
(Learn To Trade And Read Candlestick Patterns Like A Pro)
How To Trade The Three Outside Down Pattern
Trading the Three Outside Down pattern involves progressing steps that include:
- Finding the ideal setup
- Waiting for the three outside down to appear
- Opening the trade
- Choosing your profit target.
Let’s explore each step in detailed meaning:
1. Find The Right Setup For The The Three Outside Down
A key part of any trading strategy is finding the right setup or ideal conditions. By now, you should realise that the three outside down is more than a series of three candles – its true meaning lies in the psychology it represents. It marks the moment when buyers lose control and sellers step in aggressively.
Let us recap the key characteristics with a checklist:
- Established trend: A clear trend must be in place. This applies whether you trade the pattern as a reversal in an uptrend or a retracement in a downtrend.
- Key resistance: The three outside down should be at a notable resistance, which carries more weight as potential turning points (e.g., horizontal levels, Fibonacci levels, trend lines, psychological round numbers).
- Overbought conditions: Use technical tools to identify exhaustion e.g., look for RSI values above 70 or the price touching the upper Bollinger Band. These indicators suggest buyers may be stretched and vulnerable to a reversal.
2. Wait For The Appearance Of The Three Outside Down Candlestick Pattern
After the first step, you will closely monitor for the appearance of this pattern. It is imperative that the three outside down forms perfectly based on the features below. Let us, again, briefly summarise how to identify each candle:
- Candle 1: small bullish candle, full-bodied candle with minimal wicks.
- Candle 2: larger bearish candle with minimal wicks that engulfs the previous; opens slightly above and closes below it
- Candle 3: similarly larger or smaller bearish candle with minimal wicks that closes below the previous candle
You can wait for the three outside down pattern at any time frame. The lower this is, the more frequent the appearance (but this would increase the formation’s effectiveness). Meanwhile, the higher the chart reference, the less often the pattern shows up, although this makes it more powerful or effective.
We will now go over various examples of entering this setup.
3. Open Your Trade – Entry Point
Following confirmation of the three outside down’s appearance, it’s now time to strategically plan your entry. Here are the types of methods you can use depending on your risk tolerance and personal preference.
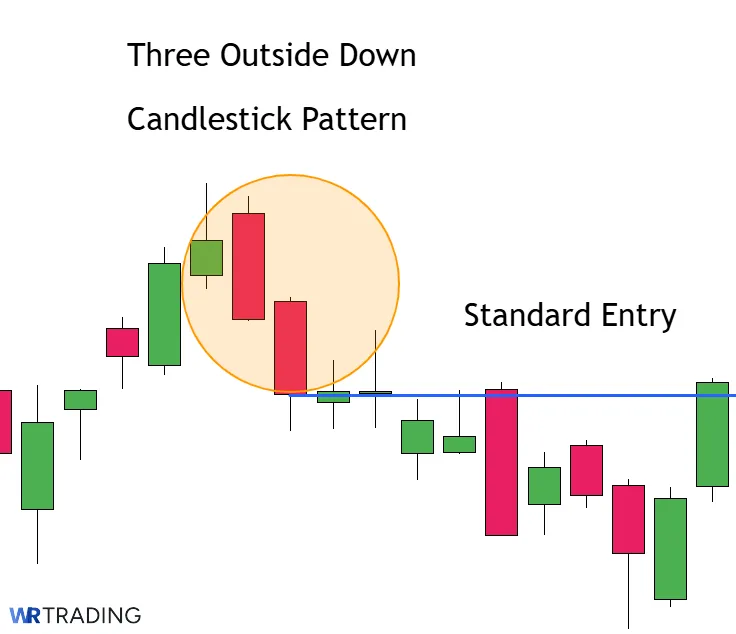
Standard Entry
Here, a trader enters short immediately after the third candle has formed. It is a straightforward, sensible approach which guarantees you an entry (but may not provide an optimal entry point).
Momentum Entry
This riskier method involves entering while the third candle in the pattern is forming manually or with a sell stop order. The conviction would need to come from higher-than-usual volume or momentum (or other confirmation) in the second candle.
Of course, it is a much earlier and optimal entry, resulting in better risk-to-reward. However, the downside is apparent – the risk of a false signal and whipsaws remains prominent.
Pullback Entry
The goal of this entry is to hope for a pullback once the pattern has formed, e.g., a retest somewhere in the first or second candle’s range. This would come in the form of a 50% (or higher) Fibonacci level or a bearish rejection alert like a pin bar.
Such an approach is smarter: it offers the tightest entry and higher reward potential, at a time when the market appears to be invalidating the signal. Still, the main problem is you can miss the move entirely if the price doesn’t retrace.
Breakout + Retest Entry
Once candle 3 breaks below a major support level (such as a prior horizontal support, Fibonacci retracement level, or moving average), traders can wait for the price to retest and reject it before going short.
This method revolves around the ‘support turned resistance’ concept. Understandably, it’s the slowest, most cautious approach with the lowest risk-to-reward potential. Also, the retest may never happen, resulting in a missed trade. On the plus side, this approach offers the most confirmation and can prevent you from entering instances of failed three outside down setups.
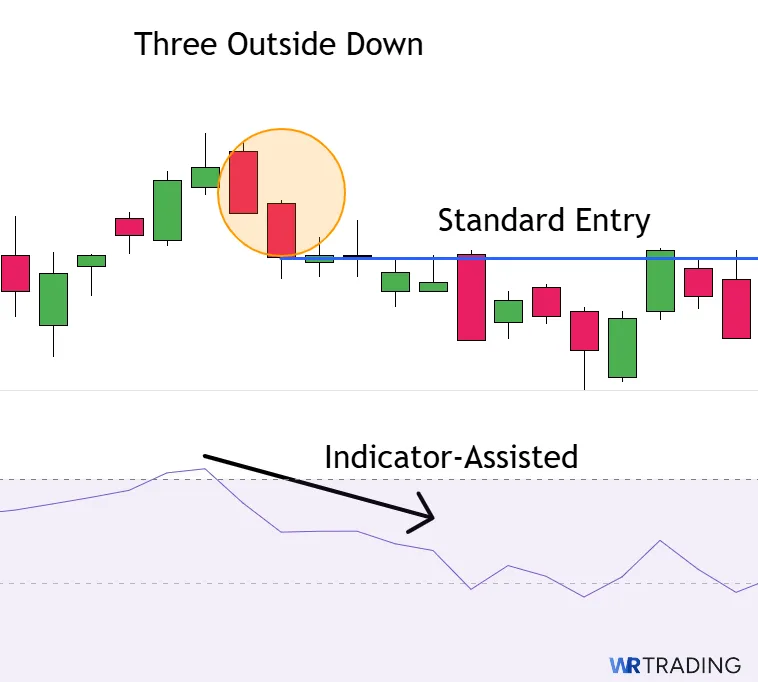
Indicator-Assisted Entries
Finally, traders can also use indicators in addition to the previously discussed methods. For instance:
- MACD: Bearish crossover (signal line crossing below MACD line).
- RSI: Falling below 70 or forming a bearish divergence against price.
- Stochastics: Bearish cross in the overbought zone.
While indicators would offer mechanical proof, they lag noticeably, making your entries late.
Finally, traders must decide where to place their stop loss to minimise the risks of huge losses should the pattern become invalidated. Here are the different options to implement:
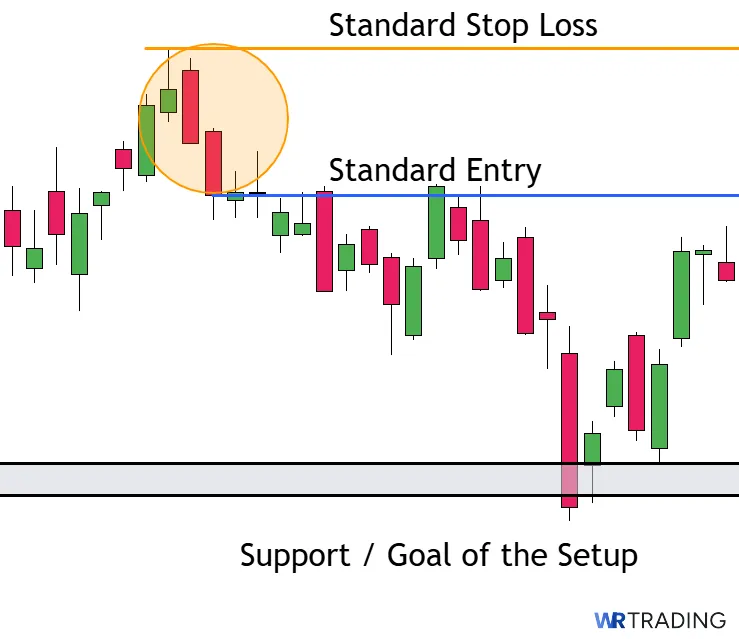
- Above Candle 2’s high: This is a standard placement technique, which makes sense as the idea would be invalid is if the price exceeded the second or middle candle’s high.
- Above Candle 1’s high: This is a riskier technique given that even the slightest volatility or ‘noise’ would kick a trader out of their trades prematurely. However, the method allows for a tighter stop, increasing the risk-to-reward ratio. It should be attempted by experienced traders who have enough conviction in the setup while understanding the downside.
- Above Nearest Resistance Zone: If there’s a clear technical resistance (moving average, pivot point, etc.), setting the stop there makes sense. This would usually offer a tighter stop. While making for a favourable entry, it carries the same risk as the previous placement option.
- ATR-Based Stop-Loss: Use 1.5x the Average True Range (ATR) to allow the trade breathing room. This helps in volatile conditions, decreasing the chances of premature exits. However, your profit target needs to be further than desired since the stop loss is wider in this scenario.

(Learn To Trade And Read Candlestick Patterns Like A Pro)
4. Choose Your Trading Take Profit (Goal Of The Setup / Target)
Assuming your position is moving as planned, this would be the time to implement a logical profit-taking plan. As with the stop loss techniques, you should choose based on various factors like your trading style, market context, and risk tolerance. Let’s go over them briefly:
- Support zones: Support levels are natural profit target areas that occur and are worth utilising. This is where the price will always ‘bounce off’ or form different swing lows. Traders can draw these manually as horizontal lines – alternatively, they can use pivot points, psychological round numbers, and Fibonacci retracements.
- Trailing stop strategies: Here, traders can adjust their stop as the price moves in their favour. The aim is to stay in the trade as long as possible to potentially capture a large move while having locked in some profit.
- Momentum divergence and candlestick cues: Short-term traders or those who trade the intraday patterns can exit their positions based on momentum and candlestick cues.
Support zones are often necessary to determine the increments of your stop. For instance, a trader may move it to 38.2% of the Fib when the price reaches 50%, then 50% when it hits 61.8%, etc.
This could happen when momentum indicators show divergence during the trade or when patterns appear against the trend, e.g., bullish pin bars. Much discretion goes into this method. However, traders can alternatively trail their stops instead of exiting altogether.
Regardless of the method chosen, it’s key to maintain a minimum 1:3 risk-to-reward ratio – the higher, the more a trader can recover their losses while remaining in the green.
Now, we will go over two examples that incorporate everything discussed.
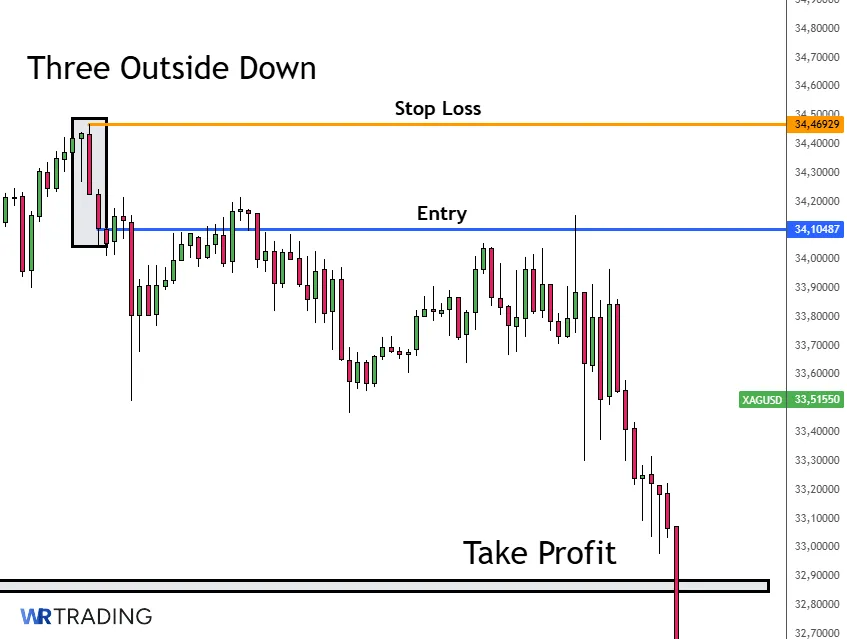
The first is a reversal trade on the 1HR silver or XAG/USD chart. The first interesting hint here is the divergence at the end of the previous uptrend. The three outside down appeared as the market retraced from the first bearish leg.
Rather than a standard entry, a trader could have opted for a retest entry. This would have offered them an impressive risk-to-reward ratio of almost 14 with these parameters:
- Entry price: 34.10487
- Stop price: 34.46949
- TP: 32.87000
The TP would have been the key support level. However, others with shorter time horizons could have aimed for the areas marked as ‘target 1’ and ‘target 2’ on the chart.
The next example is a continuation trade on the 30M chart of AUD/NZD. One key technical sign is the price exceeding the upper Bollinger Band before the three outside down, a subtle indication of the previous move’s exhaustion.
The entry here was a standard one that occurred following the third candle of the pattern. The key support at 1.06948 would have been the obvious place to take profits. Considering the entry parameters below, a trader could have achieved a brilliant risk-to-reward of 4.8:
- Entry price: 1.07754
- Stop price: 1.07922
- TP: 1.06948
Which Trading Strategies Are The Best For The Three Outside Down Pattern?
The best strategies for this pattern range from confirmation-based entries to using channels or trendlines. Here is an overview of each:
- Confirmation-based entry strategy: This is a conservative and common strategy that involves entering once a candle immediately breaks the low of the pattern’s third candle. It is best for traders seeking a simple way of entry using the price action to validate the setup.
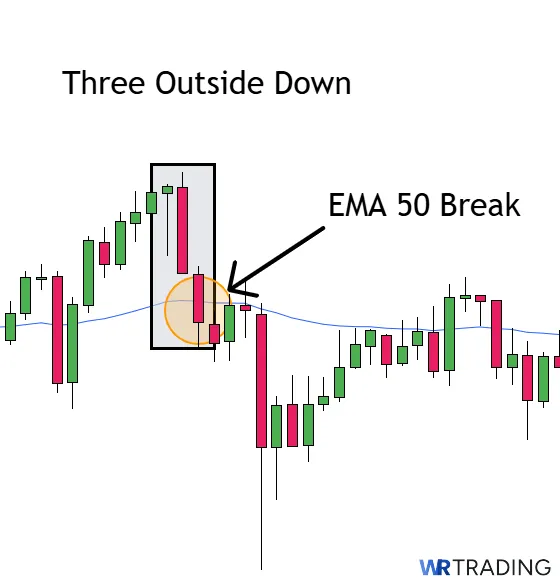
- Moving average strategy: Here, a trader uses moving averages, like the 50 or 100-period MA. More specifically, they would look for the price to cross below the MA to validate the bearish bias.
- RSI confluence strategy: This strategy involves combining readings on the Relative Strength Index (RSI). You can trade once the RSI dips below 70 (‘overbought’) or shows divergence at any time during the formation of the three outside down.
- Channel or trendline strategy: The aim with this technique is to trade the pattern when it has formed near the upper boundary of a rising channel or trendline. This would be a sign of rejection. Entry should happen once a candle has broken the support of the latter.
Regardless of the chosen strategy, any approach to trading the three outside down should consider contextual relevance, additional confirmation, defined risk parameters, realistic exit points, and avoiding low-quality setups.
(Learn To Trade And Read Candlestick Patterns Like A Pro)
What Is The Success Rate Of The Three Outside Down Candlestick Pattern?
Based on the intensive research performed in Thomas Bulkowski’s Encyclopedia of Candlestick Charts book, the author found the three outside down setup to have a 69% success rate at causing a reversal. Quantified Strategies also gives a similar respectable 70% chance for the pattern.
This data shows us that the formation is quite reliable. Still, many factors can influence this aspect, such as the traded market, time frame, confirmation signals, and risk management. Understanding these factors is crucial when anyone learns how to trade this setup.
How Accurate Is The Three Outside Down Pattern?
The three outside down is regarded as quite accurate, with studies indicating success rates around 70%. This can be improved with the right market dynamics, waiting for confirmation before entry, utilising favourable risk-to-reward ratios, and other factors.
What Are The Pros And Cons Of The Three Outside Down Pattern?
Let us summarise the pros and cons of the three outside down before going into detail for each:
Pros
- Decent success rate in confirming bearish reversal
- Useful for determining target and exit points
- Performs well in combination with other technical indicators
Cons
- Requires confirmation from volume or indicators
- Can produce false moves in sideways markets
- Traders may misinterpret the pattern without proper context
What Are The Advantages Of The Three Outside Down Pattern?
- Decent success rate: The Three Outside Down pattern is known for its solid success rate in predicting bearish reversals. The engulfing nature of the second candle, followed by a bearish third candle, prompts a notable potential change in momentum.
- Established target and exit points: Once the pattern is intact, it can help traders target price levels more confidently and exit long positions before losses mount. Analyzing the pattern in relation to recent highs makes it easier to set realistic, accurate profit targets or stop losses.
- Adaptability with indicators: You can improve the reliability of the setup when it is used in combination with other indicators like RSI, MACD, moving averages, and technical tools, such as trendlines and Fibonacci.
What Are The Disadvantages Of The Three Outside Down Pattern?
- Need for confirmation: While the pattern is visually simple, it often requires confirmation through indicators or trading volume. A trader risks acting on a false signal and entering prematurely without this.
- Presence of false moves: The Three Outside Down pattern can generate misleading signals in choppy or range-bound environments. Its hit rate drops significantly when there is no underlying trend to reverse.
- Potential for misinterpretation: Novice traders may misinterpret the pattern if they ignore the bigger picture on the chart. This can result in a combination of factors leading to poor decision-making and taking low-quality opportunities.
Can The Three Outside Down Have Failure Signals?
Yes, this pattern is prone to failure from time to time caused by things like low-volume environments and lack of market context. Still, traders can explore similar effective alternatives, ranging from the evening star to the bearish engulfing setups.
(Learn To Trade And Read Candlestick Patterns Like A Pro)
Which Indicators Can Be Combined With The Three Outside Down?
We’ve spoken several times about indicators and their usefulness when trading this setup. Here is a list of the popular ones traders can incorporate:
Relative Strength Index (RSI)
The RSI measures momentum by showing whether an asset is overbought or oversold. In the case of Three Outside Down, it helps validate if the market is extended to the upside before a potential reversal. It’s also especially useful for spotting bearish divergence.
- Ideal Setting: 14-period RSI (standard)
- How to use:
- Look for RSI above 70 during or just before the pattern forms.
- Bearish divergence (price making higher highs while RSI makes lower highs) adds strong reversal confirmation.
- Look for RSI above 70 during or just before the pattern forms.
Moving Averages
Moving averages smooth price action and show the underlying trend direction. They help validate whether the three outside down is a true reversal or just noise. When price rejects or crosses a key average after forming the pattern, it signals that the momentum has switched.
- Ideal Settings:
- 50 EMA for short- to mid-term trend bias
- 100 EMA for longer-term trend context
- 50 EMA for short- to mid-term trend bias
- How to use:
- Favour setups where the pattern forms below or near the 50 EMA, especially if price gets rejected at the line.
- You can use moving average crossovers (e.g., 20 EMA below 50 EMA) for a conservative entry.
- Favour setups where the pattern forms below or near the 50 EMA, especially if price gets rejected at the line.
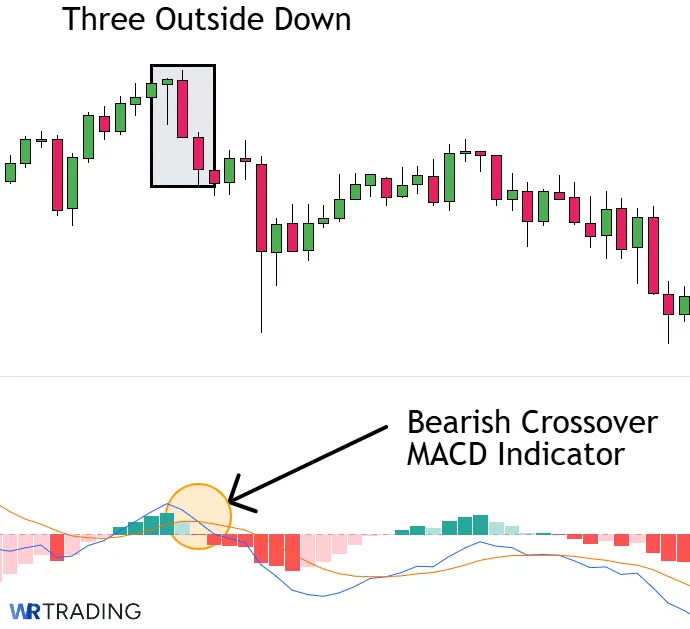
MACD (Moving Average Convergence Divergence)
The MACD tracks trend and momentum by comparing two moving averages. A bearish crossover near the Three Outside Down pattern marks a weakening uptrend and building downside pressure. This indicator also reveals trend shift strength through the histograms.
- Ideal Settings: 12, 26, 9 (standard)
- How to use:
- A bearish MACD crossover (MACD line below the signal line) near the pattern enhances conviction.
- Stronger signals form when the crossover happens above the zero line, indicating momentum is fading.
- A bearish MACD crossover (MACD line below the signal line) near the pattern enhances conviction.
Volume
Volume validates the strength of a candlestick pattern. A strong three outside down setup should have higher volume on the third candle, suggesting real selling interest rather than a shallow pullback. Weak volume means weak conviction and a greater risk of failure. The ideal setting is simply a standard 20 MA.
Bollinger Bands
Bollinger Bands measure volatility and show us whether price is stretched. When the three outside down forms near the upper band, it signals potential overbought conditions. A reversal candle closing back inside the bands often precedes a trend change.

- Ideal Settings: 20-period SMA, 2 standard deviations
- How to use:
- Spot the pattern forming at or near the upper band to signal exhaustion.
- A close back inside the bands supports a bearish shift.
- Spot the pattern forming at or near the upper band to signal exhaustion.
(Learn To Trade And Read Candlestick Patterns Like A Pro)
What Are Alternatives To The Three Outside Down Pattern?
Here are some excellent alternatives to the three outside down, which can help traders diversify their approach when the setup isn’t present.
| Pattern name | Description |
|---|---|
| Evening star | – A three-candle reversal pattern that forms after an uptrend. It consists of a large bullish candle, a small indecisive candle (gap-up or doji), and a strong bearish candle. |
| Bearish engulfing | – A two-candle pattern where a large bearish candle completely engulfs the prior small bullish candle. |
| Dark cloud cover | – A bearish two-candle pattern where the second candle opens above the previous high but closes below the midpoint of the bullish candle. |
| Tweezer tops | – A two-candle pattern where both highs are nearly equal, usually after a price rally. It suggests buyers failed twice to push the market higher. |
See our Candlestick Pattern PDF Cheat Sheet to learn more about different candlestick alternatives.
What Is The Opposite Pattern Of The Three Outside Down?
The opposite pattern of the three outside down is the three outside up, marking a potential shift to upside momentum. It consists of a small bearish candle, followed by a large bullish candle that completely engulfs the first, and a third bullish candle that closes higher. Traders use it to identify downtrend reversals or uptrend continuations.
What Is The Difference Between The Three Outside Down And The Three Outside Up Pattern?
The main difference is that the three outside down is a bearish reversal setup, while the three outside up is a bullish pattern. Otherwise, their structures and role in signalling a change in direction are identical. Still, additional context remains essential, whether the pattern is traded in stocks, forex, or any other popular market.
What Are The Limitations Of The Three Outside Down?
While a useful reversal pattern, the three outside down has several drawbacks. Being aware of these limitations reduces mistakes and fosters the most effective way of trading the pattern:
- Needs a clear uptrend: The three outside down works best following a strong bullish move (instead of a range-bound market)
- Subjectivity in interpreting the pattern: It is difficult to always find a perfect-looking pattern due to the nuances in candlesticks. For example, there are several three outside down formations where the third candle may have a bit more wick than the ‘textbook’ version but still be valid.
- Presence of failure signals: Like virtually all chart patterns, the three outside down has little standalone predictive power. Therefore, failure signals will always prevail (but these can be minimised by combining the setup with other tools).
Learn Pattern Trading With The WR Trading Mentoring
If you’re serious about mastering trading patterns like the three outside down or other powerful setups, WR Trading is your next step. Pattern trading isn’t just a concept we teach – it’s a core pillar of our mentorship system, which is designed to help traders make smarter, faster, and more profitable decisions.
Our mentorship emphasizes:
- High risk-to-reward ratio trading
- Low time commitment with high efficiency
- Clear, personalized trading plans
- Eliminating poor-quality trades
- Identifying the best, high-probability setups
Whether you’re a beginner aiming to build confidence or an experienced trader looking to improve your edge, our mentorship fits all levels in forex and other CFDs.
(Learn To Trade And Read Candlestick Patterns Like A Pro)
Conclusion: Mastering the Three Outside Down
The three outside down stands out as a powerful signal in technical analysis for spotting a potential reversal after an uptrend or bullish retracement. Despite having a simple structure, it is deeply rooted in market psychology, exemplifying the transition from bullish control to bearish dominance.
To trade this pattern effectively, it’s vital to consider the context in which it appears, use proper confirmation, and maintain disciplined entry and exit strategies. This improves consistency and risk management, especially as the formation always has a chance of failing.
Still, when applied correctly, this setup can become a valuable component in a trader’s technical analysis toolkit for timing reversals with favourable reward potential.