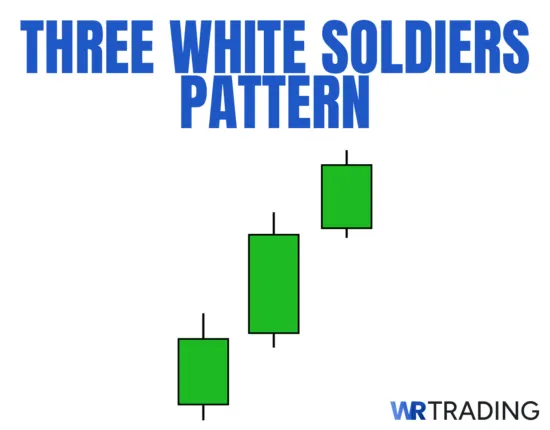
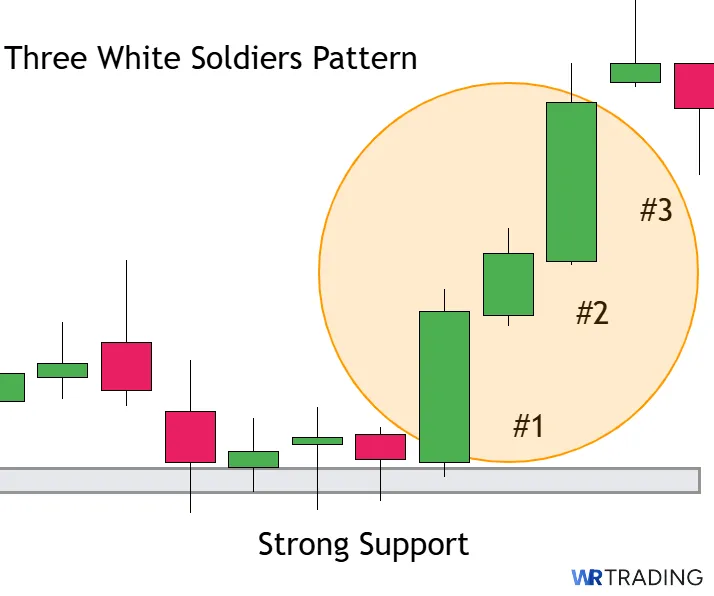
The Three White Soldiers is a bullish candlestick pattern made up of three green candles progressively opening near the previous candle’s body and closing near its high.
This structure shows sustained buying strength across three sessions, often showing the beginning of a new uptrend or the end of a recent pullback. The absence of long upper wicks suggests little resistance during the push, and each close near the high reinforces bullish control.
The pattern appears after a downtrend, correction, or period of sideways movement and signals that buyers are stepping back in with confidence. It shows momentum shifting away from sellers as each bullish candle builds on the last. Traders look for it at major support zones or after oversold readings, using the structure to plan long entries.
How The Three White Soldiers Candle Are Structured:
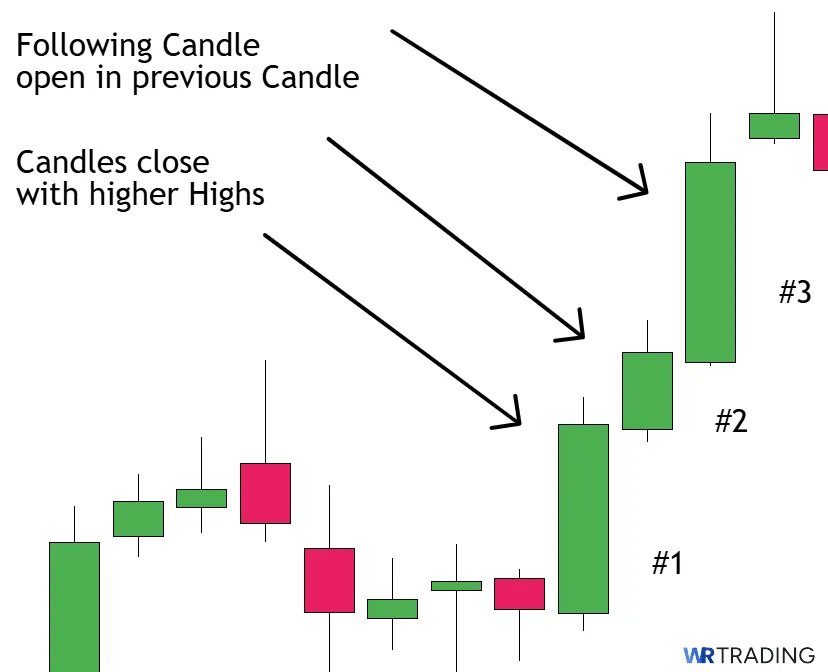
- Construction: First Candle: A solid bullish candle that closes well above its open, forming after a decline or a period of consolidation
- Second Candle: Opens within or near the first candle’s body and closes above it, showing follow-through buying
- Third Candle: Opens within or near the second candle and pushes to a higher close, confirming ongoing bullish pressure
- Forecast: Suggests that buyers are gaining control and that a reversal to the upside or continuation may follow
- Type of Pattern: Three-candle bullish reversal pattern
- Trend Prior to Pattern: Appears after a downtrend, correction, or range, where the price had lost momentum or declined.
- Opposite Pattern: Three Black Crows
- Stop-Loss Placement: Placed below the low of the first or second candle to manage downside risk
- Candlestick Success Rate: Estimated 82%, depending on market context and timeframe
(Learn To Trade And Read Candlestick Patterns Like A Pro)
How Does A Three White Soldiers Candlestick Pattern Form In The Chart?
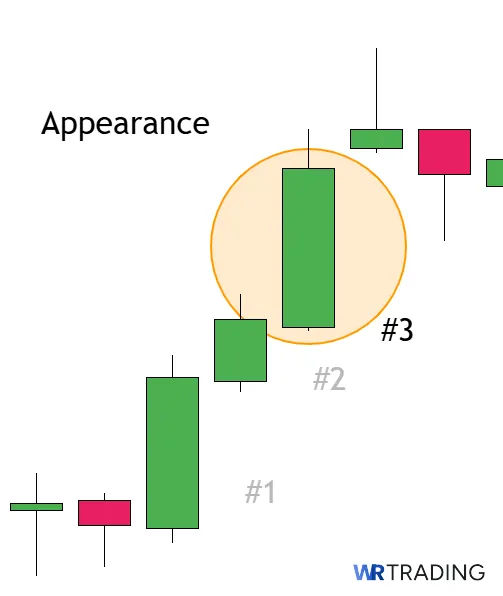
The Three White Soldiers pattern forms over the course of three green bullish candles, each closing higher than the last. It appears after a downtrend, a sharp pullback, or a flat consolidation where momentum has slowed. The setup begins when buyers step in with strong interest, leading to the first green candle that closes near its high.
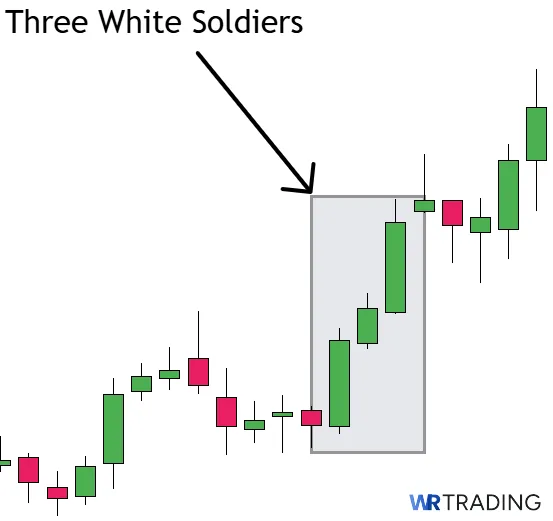
Before this pattern forms, the chart will often show several bearish candles or a series of small indecisive bars that reflect fading selling pressure. Once the first soldier prints, it’s followed by two more bullish candles, each opening within the previous candle’s real body and pushing to a higher close.
The entire pattern takes place over three candles, which could mean three days on a daily chart or three bars on lower timeframes like hourly or four-hour charts. There is no fixed amount of time between patterns, but once the third candle closes, the formation is complete.
What Does A Three White Soldiers Candlestick Pattern Mean?
The Three White Soldiers pattern indicates consecutive buying strength over three sessions or bars. Each closing price finishing near the candle’s top suggests bullish sentiment carried through to the end of the trading period. Sellers had fewer opportunities to drive prices down, implying a firm stance by buyers.
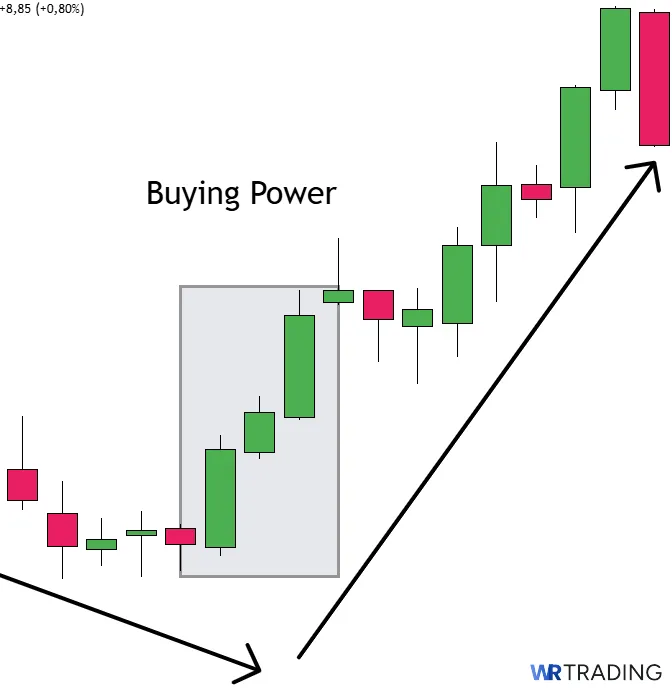
Market participants read these candles as confirmation that the prior bearish tone or lack of direction has shifted. As each candle closes on a strong note, confidence can build further, leading more buyers to step in and support higher price levels. The pattern can be an early sign of a new uptrend or a continuation of an existing bullish movement.
(Learn To Trade And Read Candlestick Patterns Like A Pro)
Example Of The Three White Soldiers Pattern In The Chart
After a strong downtrend, EUR/USD formed three consecutive bullish candles starting near 1.2940. Each candle opened within the body of the previous one and closed higher, showing clear control from buyers. The final candle in the sequence closed around 1.3135, confirming the pattern and shifting short-term momentum.

This was a textbook Three White Soldiers setup, tight structure, no upper wicks, and strong closes. Price continued climbing in the sessions that followed, validating the signa
How To Identify A Three White Soldiers Candle in The Chart?
To find the Three White Soldiers pattern in a chart, start by looking at areas where the market has been in a clear downtrend or moving sideways after a drop. The pattern often appears after several sessions of bearish activity, or when the price has stalled following a steady decline. You may notice smaller candles or indecisive moves just before the shift, which often signals that sellers are losing control.
The pattern tends to form near strong support zones, previous swing lows, or the bottom of consolidation ranges. These areas are where buyers are more likely to step in and push back. You should focus your search on points where the trend looks exhausted, and momentum is starting to shift, rather than in the middle of active selling.
(Learn To Trade And Read Candlestick Patterns Like A Pro)
How To Trade The Three White Soldiers Candlestick Pattern
A three-bar pattern demands careful planning to ensure proper entries, stops, and trade management. Spotting the Three White Soldiers pattern does not guarantee success. Our quick guide explains how to create a logical, structured approach that accounts for finding the pattern, waiting for for its appearance, choosing your entry, how to take profit:
- Find the Pattern
- Wait for Appearance
- Choose Entry
- Choose Take Profit
- Open Position
1. Find The Right Three White Soldiers Candlestick Pattern Setup
Evaluate if the environment supports an upward shift from sideward or bearish momentum. A chart that has reached strong support or shows oversold readings may offer a solid backdrop. Positive fundamentals, news, or a shift in sentiment can also help.
Scan multiple timeframes, like daily and 4-hour charts, to identify a stable foundation for the pattern. When the pattern surfaces in line with an improving environment, it stands a higher chance of success. Avoid entering if major overhead resistance or conflicting data stands in the way.
2. Wait For The Appearance Of The Three White Soldiers Candle
Allow the three bullish candles of the Three White Soldiers to fully develop. Observing each session’s close helps confirm that buyers consistently push the price near or at the daily high. Jumping in early increases the likelihood of a false start if the pattern fails to complete.
Watching the final close also reveals whether any late-day selling emerges to knock the price off its high. If each soldier truly finishes near its top, that’s the signal of sustained bullish control. A partial or mid-range close for any candle can undermine the pattern’s meaning.
3. Choose Your Entry On The Three White Soldiers Pattern
One technique is to enter on or shortly after the third candle’s close, securing the pattern’s completion. This can result in a higher entry price. Another method is waiting for a minor pullback after the third candle, aiming to catch the price slightly lower. However, no pullback is guaranteed.
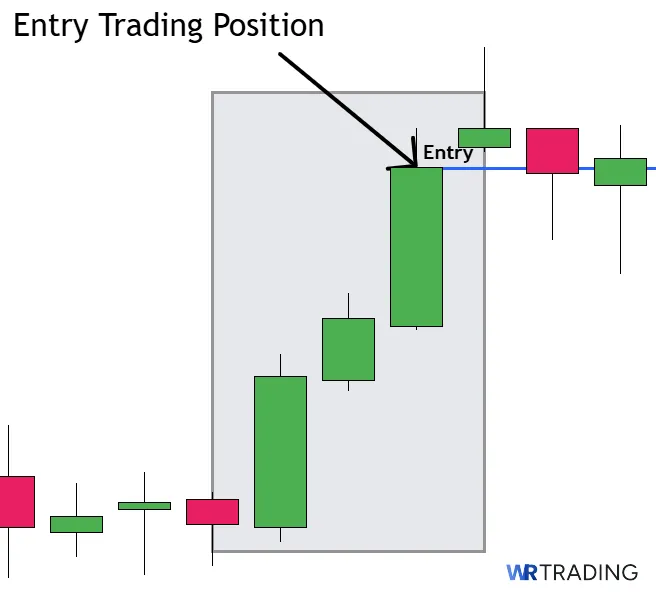
Alternatively, you can commit earlier after the second soldier, but that lacks the final piece of the pattern and can be risky if it doesn’t form. Consistency in how you confirm each candle’s close is vital, preventing impulsive entries. Whichever option you pick, ensure it aligns with your broader strategy.
4. Choose Your Trading Take Profit
Plan the exit of the Three White Soldiers by looking at recognizable resistance or previous highs. Many set a 2:1 or 3:1 reward-to-risk ratio to standardize profits relative to their risk. You can also use major chart levels such as recent swing peaks or psychological round numbers as targets.
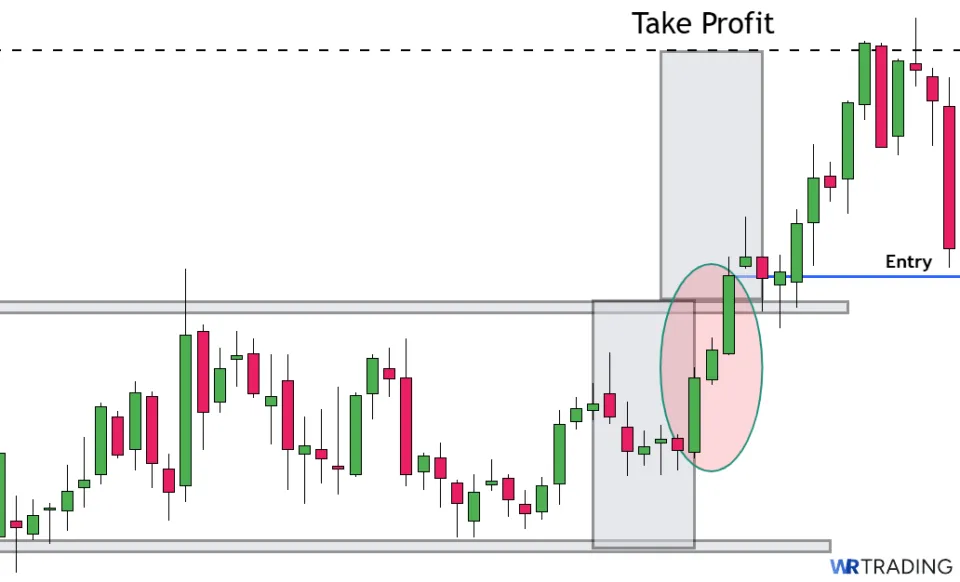
Another option is to trail a stop behind rising lows or near short-term moving averages so winners can run. This exit strategy can lock in partial gains while giving room for further upside. Some may take partial profits at the first target and hold the rest for an extended run if momentum remains strong.
5. Open Your Trade
After the final candle closes of the Three White Soldiers or a mild pullback completes, establish your position with a predefined stop-loss. A common practice is to place stops below the initial or second soldier’s low to invalidate the pattern if the price collapses. This line prevents a moderate retracement from causing a panic exit, but still protects from a full reversal.
Decide on trade size based on the stop distance to maintain consistent risk across multiple trades. Many beginners start with a small percentage of their trading portfolio, like 1% to 2%. Combine this discipline with your entry logic for a trading plan that guards capital while capturing potential upside.
(Learn To Trade And Read Candlestick Patterns Like A Pro)
What Can Be A Confirmation For The Three White Soldiers Candlestick Pattern?
Relying solely on three bullish candles can be risky. Adding layers of verification to ensure that the upward move has broader support is required for all successful traders. These are a few signals that can reinforce the Three White Soldiers pattern:
- Close Above A Notable Moving Average: If the third soldier closes above a moving average that previously acted as a barrier, it implies added bullish strength. Traders who follow these averages notice that the price has flipped from below to above, pointing to stronger upside. In these conditions, the pattern aligns with a recognized technical shift.
- Increased Volume On All Three Candles: Volume that builds or remains notably high across each candle reflects genuine buy-side interest. Low volume might suggest fewer traders behind the push. More trading activity supports the concept that new capital is driving prices higher for valid reasons.
- Breakout Past A Known Resistance Zone: When the final soldier pierces a previous ceiling, it shows that buyers overcame an important obstacle. The Three White Soldiers no longer sits beneath a boundary that stopped the price in the past. This further strengthens the case that momentum can persist without immediate overhead blocks.
- Positive Divergence On Oscillators: If RSI or MACD forms a higher low or crosses bullishly right as the pattern concludes, it shows that internal momentum has turned upward. Traders see the triple-candle signal plus an oscillator-based argument for a reversal. This synchronization can yield higher confidence in holding the long position.
- Price Gaps Up At The Start Of The Third Candle: A gap that holds indicates a decisive open, with minimal selling pressure to fill it. The third soldier forming on top of that gap suggests strong follow-through. It tells chart watchers that the market overcame any hesitation at the open and held steady gains to the close.
- Closes Near The High With Minimal Upper Wicks: Candles each finishing near their peaks highlight a firm bullish trend. Sellers barely managed to push intraday highs lower, so the final close remains elevated. This formation implies that buyers were consistent throughout the sessions instead of losing ground late in the day.
- Correlation With Bullish News Or Economic Data: If a company releases better-than-expected earnings or if a currency pair benefits from a favorable economic report during the same days, it often fuels the Three White Soldiers. Chart-based signals plus supportive fundamentals can invite more capital into the move.
Does The Three White Soldiers Pattern Mean Buy Or Sell?
The Three White Soldiers pattern signals buy, not sell. It reveals recurring bullish pressure across three trading sessions, each ending near the high, underlining that buyers are confident. Traders interpret this progression as a clear sign of potential upward continuation if the market had been weak or range-bound.
What Is The Hit Rate Of The Three White Soldiers Pattern?
Research and candlestick data compiled by Thomas Bulkowski place the Three White Soldiers success range around 82% for a bullish reversal when traded with suitable context. Performance can vary by asset, timeframe, and overall market environment. Shorter timeframes (like intraday charts) might see a higher failure rate due to noise, whereas daily and weekly charts sometimes show more sustained follow-through.
In practical terms, these statistics do not guarantee profits on every occurrence. They do highlight that the pattern can be a dependable bullish indication if it aligns with supportive technical or fundamental data. For best results, combine the formation with volume confirmation and technical indicators.
What Are The Pros And Cons Of Trading The Three White Soldiers Candle Pattern?
There are clear advantages to using the Three White Soldiers pattern in trending markets, but it also comes with limitations that traders should consider. Understanding both sides helps you decide when the setup is worth trading and when to stay out.
Pros
- Easy to recognize visually
- Shows sustained buyer control
- Useful after downtrends and corrections
- Works across timeframes
- Pairs well with confirmation tools
Cons
- Can appear before hitting resistance
- No guarantee against bearish reversal
- No built-in stop or exit singnal
- Less effective in ranging markets
- Can be misleading without volume confirmation
What Are the Advantages of the Three White Soldiers Pattern?
The Three White Soldiers pattern stands out because it delivers a clear, structured sequence that reflects real buying momentum. It’s built on price action alone, making it usable without relying on indicators. Here are the practical benefits of using this setup.
- Easy to recognize visually: The Three White Soldiers is made up of three green candles that close progressively higher, which makes it straightforward to identify on any chart. There’s no need for advanced tools or calculations. Traders can spot it quickly just by scanning for consecutive bullish closes.
- Shows sustained buyer control: Each candle closing near its high signals buyers remained in control throughout the session. This makes it more reliable than one-off bullish candles. It reflects actual strength, not just a momentary push.
- Useful after downtrends and corrections: The Three White Soldiers often appears after sharp pullbacks or selloffs, helping traders catch a reversal early. It can signal that bearish momentum has cooled and bulls are stepping back in. That gives it value as a bottom-spotting tool.
- Works across timeframes: You can find this pattern on daily, 4-hour, or even weekly charts with the same structure. While lower timeframes may carry more noise, the rules stay the same. That flexibility means traders can apply it to different strategies.
- Pairs well with confirmation tools: The pattern works well with volume spikes, RSI divergence, or trendline breaks. When combined with these, the signal becomes much more actionable. That gives it an edge over patterns that don’t sync as easily with indicators.
What Are the Disadvantages of the Three White Soldiers Pattern?
While the pattern has strengths, it still has a few disadvantages. Traders need to understand where it falls short and what risks it brings. These are the most common drawbacks and limitations to keep in mind.
- No built-in stop or exit signal: The Three White Soldiers doesn’t tell you where to exit or place your stop-loss. You still need to define your own risk management plan. Without that, trades based on this pattern can lead to poor reward-to-risk setups.
- Can appear before hitting resistance: Sometimes the third candle finishes right into a known resistance zone. Price may reject immediately after the pattern forms. That makes confirmation with broader context critical.
- Less effective in ranging markets: If the market is chopping sideways, the Three White Soldiers can appear without follow-through. These are often false signals during consolidation phases. It works best in trending or directional setups.
- No guarantee against bearish reversal: Even with strong candles, news or broader market pressure can reverse things quickly. Patterns like this don’t protect against fundamental shifts. It’s important to monitor news and macro drivers.
- Can be misleading without volume confirmation: The Three White Soldiers may look strong visually, but if volume is weak on the third candle, the move could lack real conviction. Without strong trader participation, the price may fail to follow through and reverse quickly.
(Learn To Trade And Read Candlestick Patterns Like A Pro)
Can The Three White Soldiers Pattern Have Failure Signals?
Yes, although the pattern looks bullish, it can fail if other technical or fundamental factors intervene. Markets are unpredictable, and any bullish setup can reverse under certain conditions.
- Close Below The First Soldier’s Low: If the price soon drops under the first candle’s low, it contradicts the notion of sustained buying. Sellers reassert themselves enough to erase all initial gains. This move usually indicates that the trio was a short-lived bounce.
- Gap Down After The Third Candle: A bearish gap on the next session implies that overnight sentiment turned negative. Despite the triple bullish close, the opening price falls below the third soldier, negating momentum. Traders who planned to buy at the open might be caught off guard by sudden selling pressure.
- Weak or No Volume Increase: Small buy orders are more impactful in low liquidity markets, meaning patterns can form without real substance. Once trading volume returns, the market may revert to prior levels. Traders need to monitor volume to ensure it supports the pattern rather than just drifting higher on light activity.
- Key Resistance Directly Above The Pattern: Even though the Three White Soldiers look impressive, an immediate overhead barrier can cause a reversal. Price may rise briefly but fail to clear that zone. This triggers a selloff and invalidates the upward potential that the pattern suggests.
- Oscillators Remain In Overbought Territory: If RSI or Stochastics are already above overbought thresholds, the triple candle move might simply be the tail end of a rally. The Three White Soldiers alone cannot override an extreme oscillator level if profit-takers step in.
- Higher Timeframe Trend Still Bearish: On a larger scale, if weekly or monthly charts continue printing lower highs, a small daily triple candle pattern may not hold. Sellers could easily resume control after a short bounce. Bigger-picture alignment is often crucial to sustained reversals.
- Sudden Negative Headline or Earnings Miss: Fundamentals sometimes negate a positive chart setup. A surprise announcement about poor profits, regulatory issues, or macro data can overshadow short-term bullish efforts. The three candles then become a minor rally overshadowed by negative developments.
- Retest of Candle Bodies Fails: If the price retests the range covered by the soldiers and collapses below the second or third candle’s midpoint, it may suggest buyers lack follow-through. What was seen as a short correction can spiral into heavier selling. The Three White Soldiers’ initial impression fades, replaced by renewed downward momentum.
Which Indicators Can Be Combined With The Three White Soldiers?
Pairing the Three White Soldiers pattern with the right indicators helps confirm its reliability and avoid false setups. The pattern reflects price action, but indicators offer insight into strength, volume, and trend alignment. These tools are commonly used by traders to validate entries based on this formation.
- Volume (rising or consistent): Increasing volume across all three candles confirms that buyers are stepping in with real force. If volume fades, the Three White Soldiers lose weight. This is one of the most reliable confirmations you can pair with the setup.
- Relative Strength Index (RSI): Look for RSI climbing out of oversold territory or forming bullish divergence before the pattern. That signals shifting momentum in favor of the bulls. It gives context to the candles by showing internal pressure building. Using the standard 14-period setting gives a reliable view of internal pressure building.
- MACD crossover (12, 26, 9): A bullish MACD crossover near the start or end of the Three White Soldiers adds extra confluence. It indicates broader trend momentum is flipping. This is especially helpful in spotting sustained reversals.
- 20 or 50 EMA: If the Three White Soldiers form near a rising EMA or closes above it, it suggests trend strength. Traders often use the 20 or 50 EMA to define bullish territory. Price reclaiming those levels while forming this pattern is a strong combination.
- Bollinger Band bounce: If the first candle begins near or outside the lower Bollinger Band, and the price reverses inside the band with the Three White Soldiers, that shows volatility expansion. This adds a timing element to the setup. It’s a subtle signal that the market is rotating back to mean or trending upward.
What Are The Limitations Of The Three White Soldiers Pattern?
The Three White Soldiers shows a sequence of bullish closes but does not promise an extended run without interruption. It indicates multiple sessions of buying, but fundamental or bigger technical factors might override it at any time. For instance, if the broader market remains in a long-term bearish trend, the pattern might represent a temporary bounce.
Another limitation is that the pattern does not provide any entry or stop-loss logic on its own. Traders must overlay personal rules for risk management, confirmation, and exit planning. The candles only signal that bulls showed strength for a short period, leaving you to interpret how far that strength might carry.
What Are Possible Strategies For The Three White Soldiers Candlestick Pattern?
These strategies offer different methods for recognizing and trading the triple bullish move. Each approach aligns the Three White Soldiers formation with broader analysis to minimize risk from random spikes.
- Breakout Strategy
- Oversold Reversal
- High Volume
Breakout With Retest At Resistance
Many traders look for this pattern to form just below or around a well-defined resistance zone. After the third bullish candle closes above that level, the price may briefly pull back and retest the former resistance. If that retest holds and price starts climbing again, it confirms the breakout wasn’t a fake move. Use this opportunity to enter a long position as the market shows commitment above the prior ceiling.
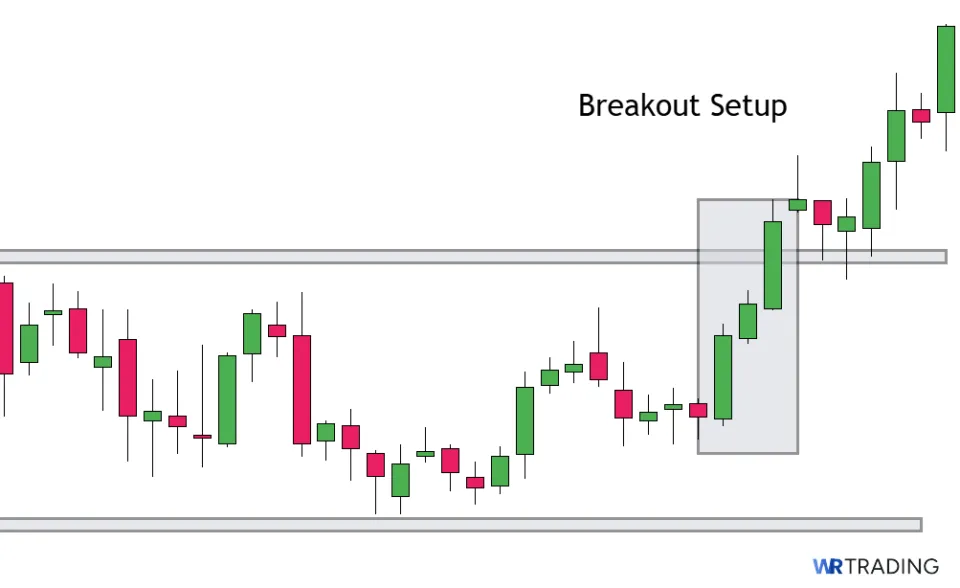
Entry is taken on a bullish rejection from the retest zone. Stops often sit just below the retest low, while the first target could be the next visible resistance level or a 2:1 risk-reward mark. This strategy works well in trending markets where momentum needs a clean trigger to continue. Combining the breakout pattern with structure confirmation helps filter out weaker setups.
Oversold Reversal With RSI Support
The Three White Soldiers becomes far more useful when paired with RSI signals after oversold readings. When price has been declining and RSI dips below 30 or shows bullish divergence, the appearance of this pattern becomes much more meaningful. The bullish candles indicate a shift in momentum, while RSI suggests selling has been exhausted.
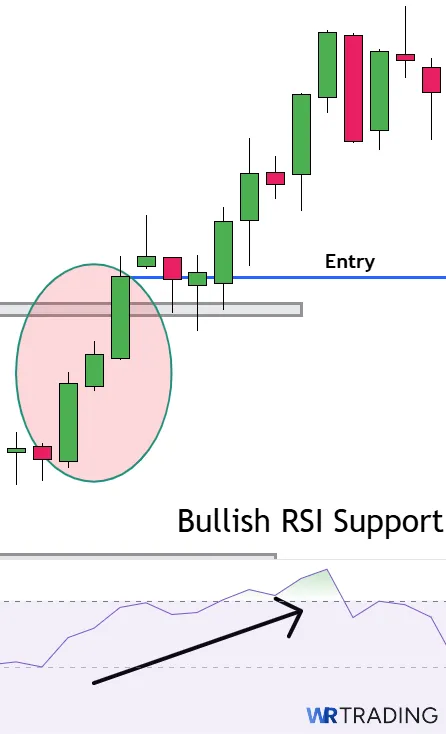
Wait for the third candle to close above a prior swing high or signal line before entering. A stop-loss is placed beneath the first or second candle’s low. This strategy is popular in forex, crypto, and stocks, where momentum indicators are part of daily decision-making. It helps identify early shifts without jumping in too soon.
High-Volume Reversal At Support
One of the best uses of the Three White Soldiers pattern is when it aligns with a key support zone and rising volume. This combination of signals indicates that not only are buyers stepping in, but they’re doing so with commitment.
When the pattern appears right off a level that’s held multiple times before and volume increases across the three candles, the trade setup becomes much more convincing. Place a stop-loss just beneath the lowest point of the pattern or support zone.
Profit targets are placed on previous swing highs or minor resistance areas above. This strategy leans on the idea that large traders or institutions are entering around these zones and pushing the price higher in a visible, sustained way.
(Learn To Trade And Read Candlestick Patterns Like A Pro)
Alternatives To The Three White Soldiers Pattern
| Pattern | Type of Pattern | Best Use Case | Key Characteristics / Conditions |
|---|---|---|---|
| Piercing Line | Bullish Reversal (2 Candles) | Early identification of a bullish reversal after a strong down bar. | Second candle closes above the midpoint of the previous red candle, indicating a strong shift in buying interest. |
| Dark Cloud Cover | Bearish Reversal (2 Candles) | Catching abrupt weakness after a bullish run. | Second candle opens above the prior high but closes below at least 50% into the previous candle’s body, suggesting fading buying power. |
| Morning Star | Bullish Reversal (3 Candles) | Identifying a pivot where strong selling transitions into a bullish rally | Candle 1 is bearish, Candle 2 is small-bodied (often a doji) showing indecision, and Candle 3 reclaims a large portion of Candle 1’s range, indicating an upward turn. |
| Harami | Bullish or Bearish Reversal | Indicating momentum slowdown due to a smaller candle inside the prior day’s real body | The second candle remains fully within the bounds of the first, reflecting a pause in momentum that can reverse the ongoing trend. |
| Engulfing | Bullish or Bearish Reversal | Spotting a fresh shift in control by one candle completely covering the previous candle | One candle entirely engulfs the previous real body, revealing a decisive takeover by buyers (bullish) or sellers (bearish). |
Use the free download of our Candlestick Patterns PDF to find more alternatives and formations.
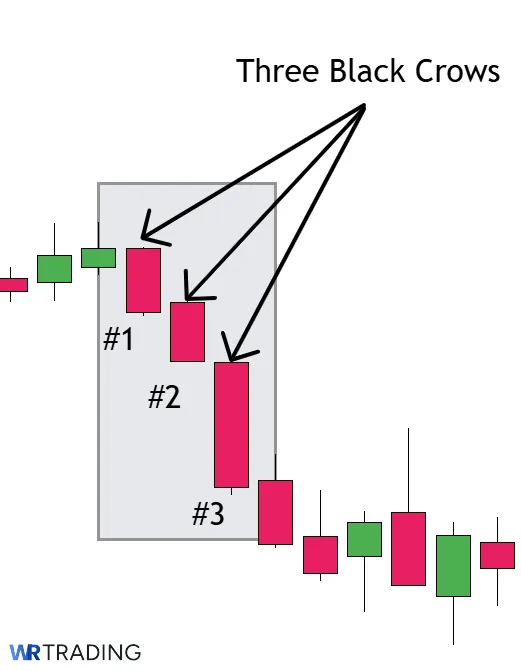
Three White Soldiers Pattern vs Three Black Crows
Three White Soldiers and Three Black Crows are opposite in both structure and meaning. The Three White Soldiers marks a shift from selling to buying after a downtrend, while the Three Black Crows signals a reversal from bullish momentum into strong selling after a rally. Both use three candles and follow a similar formation style, but one confirms buyer strength building, and the other confirms control passing back to sellers.
| Section | Three White Soldiers | Three Black Crows |
|---|---|---|
| Construction | First Candle: A strong bullish candle following a prior downtrend or pullback.Second Candle: Another green candle that opens within the previous body and closes higher.Third Candle: A third green candle continuing upward with little to no upper wick. | First Candle: A large bearish candle that opens near the prior close and drops lower.Second Candle: Another red candle opening within the first body and closing below it.Third Candle: A third red candle continuing lower, also opening within the second and closing near its low. |
| Forecast | Suggests a strong shift to bullish momentum and potential trend reversal to the upside. | Indicates a reversal from bullish to bearish conditions with growing selling pressure. |
| Type of Pattern | Three-candle bullish reversal pattern. | Three-candle bearish reversal pattern. |
| Trend Prior to Pattern | Follows a pullback or downtrend, showing strength returning to buyers. | Appears after a rally or uptrend where buying momentum starts fading. |
| Opposite Pattern | Three Black Crows. | Three White Soldiers. |
Learn Pattern Trading With The WR Trading Mentoring
Learning to trade the Three White Soldiers candlestick pattern requires more skill than just spotting it in the chart. The WR Trading Mentoring program helps you integrate this pattern into a consistent plan, combining technical reasoning with market context. Traders learn to choose appropriate timeframes, validate signals, and set up risk management techniques.
Through these sessions, traders gain experience using indicators, candlestick setups, and big-picture analysis so that each decision has a structured rationale. The goal is to prevent reckless trades based on a single pattern and instead use an approach that filters out weak signals. Anyone seeking in-depth guidance or an expanded skill set can find valuable insights in WR Trading’s mentorship.
(Learn To Trade And Read Candlestick Patterns Like A Pro)
Conclusion: The Three White Soldiers Candlestick Pattern Is Best for Spotting Early Bullish Momentum
The Three White Soldiers pattern highlights three consecutive days (or bars) of upward closes that mark growing optimism. This triple-candle buildup shows that the market has moved from indecision or negativity to a more bullish stance, often indicating a chance for traders to ride an upswing.
That said, no candlestick pattern is enough on its own. The best use of the Three White Soldiers comes from combining it with support zones, volume confirmation, and broader trend analysis. When used with those pieces in place, this pattern can be a reliable signal in everything from swing trading to position setups.
FAQs: Most Frequently asked Questions on Three White Soldiers Candlestick Pattern
Is The Three White Soldiers Pattern Strictly A Reversal Signal?
It can act as either a reversal or a continuation pattern, depending on prior market behavior. If the price has been falling, it may signal a reversal from bearish to bullish. In an established uptrend, it can confirm that the rally has the strength to continue.
Does This Pattern Guarantee A Long-Term Uptrend?
No, it shows near-term buying pressure across three consecutive sessions but does not assure extended gains. Strong overhead resistance or negative macro factors might limit the follow-through. Many traders combine it with other signals for a complete forecast.
Can It Form On Intraday Charts Like The 15-Minute Or 1-Hour?
Yes, the pattern appears on any timeframe with candlestick data. However, lower timeframes can have more noise and false positives. Larger intervals, such as daily or 4-hour charts, often give more stable results.
Should I Wait For A Fourth Candle Confirming Strength?
Some do wait for an additional bullish close or a breakout above the third candle’s high. This check ensures that momentum did not fade immediately after the trio formed. It can reduce false entries, but leads to a higher entry price.
Can I Use This Pattern For Day Trading?
Yes, if a day trader applies it to short-term intervals, such as the 5-minute or 15-minute charts. However, volatility is often higher, and pattern reliability can drop.