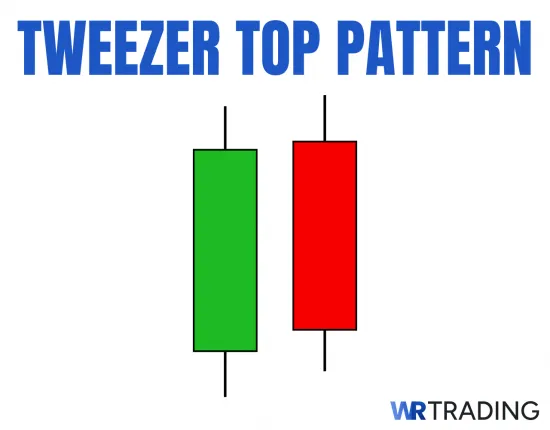
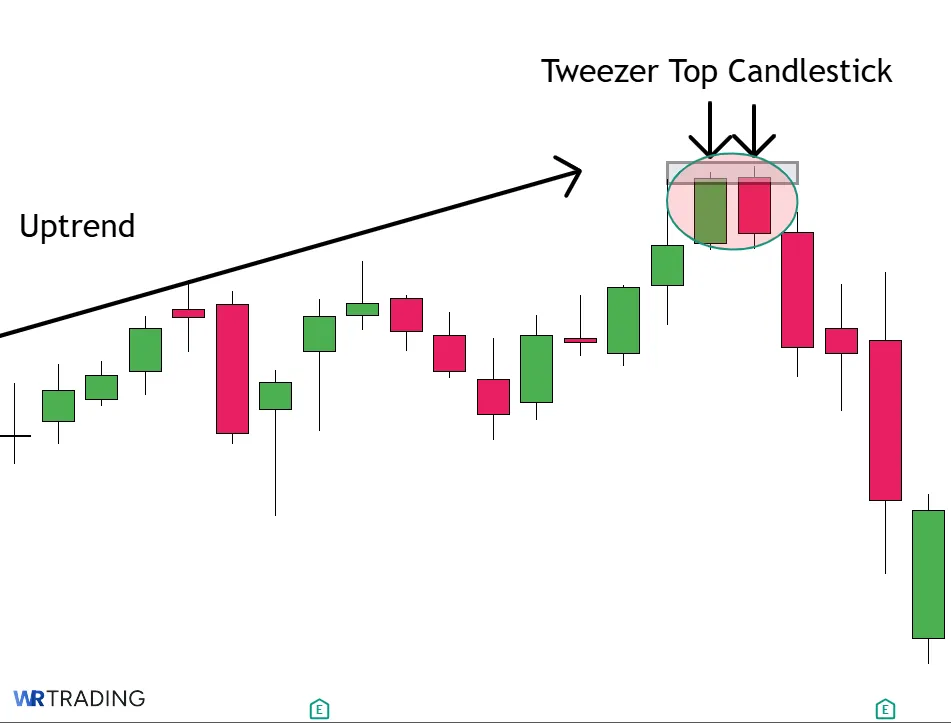
Tweezer Top is a two-candle bearish reversal pattern that forms when the price tests the same high across two sessions and fails to break through.
The first green candle shows a strong bullish close, but the second red candle stalls at the same level and finishes lower, exposing weakness in the uptrend. This signals that buyers tried twice to push higher but were rejected both times, leaving room for sellers to take over.
The pattern reflects hesitation from bulls and growing pressure from sellers. Traders use it to time short entries or exit long positions, often combining it with tools like RSI, MACD, or volume spikes for confirmation. It’s most effective when it forms after an extended move or at a known ceiling where momentum is slowing down.
How The Tweezer Top Candle Is Structured:
- Type of Pattern: Two-candle bearish reversal sign
- Construction:
- First Candle: A bullish candle that climbs and closes near its session high
- Second Candle: Another candle that opens close to or above the first candle’s close, tests roughly the same peak, and closes lower
- Forecast: Implies a bearish shift, where buyers have run into a ceiling and repeated attempts to extend the price fail
- Trend Prior to Pattern: Often seen after an uptrend or bullish run, showing that upward momentum may be fading
- Opposite Pattern: Tweezer Bottom, which signals a potential reversal from bearish to bullish
- Stop-Loss Placement: Many traders position stops above the matching highs of the two candles, in case the market overcomes that level and resumes climbing.
- Candlestick Success Rate: Estimated between 55% and 65%
How Is The Tweezer Top Pattern Formed?
The Tweezer Top pattern forms over two consecutive candles and is usually spotted after a short burst of upward movement, either in an existing uptrend or as a final push in a retracement. Before the pattern appears, you’ll often see several bullish candles building higher, with momentum increasing toward a recent high or resistance level.
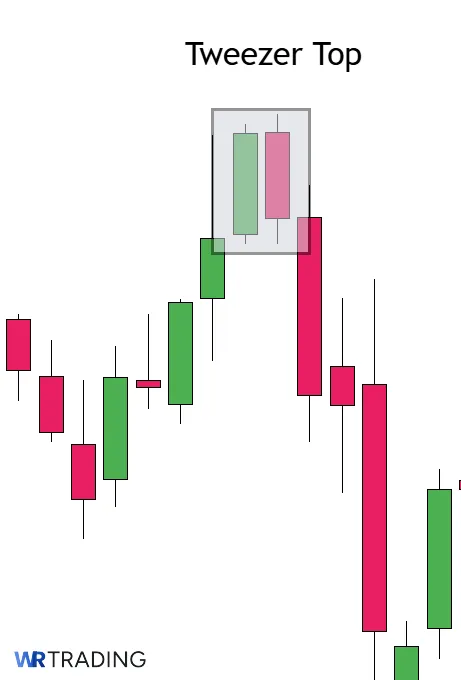
The first candle in the pattern continues this move upward and finishes strong, but the second candle rejects that strength, forming at nearly the same high and reversing direction.
This setup doesn’t require a long trend to work as it can appear at the top of a swing high or near the end of a smaller bullish wave. The entire formation takes place across two sessions (or two bars on intraday charts), and there’s no specific time requirement beyond those two candles.
What Does a Tweezer Top Candlestick Pattern Mean?
The Tweezer Top highlights a zone where buyers try to push prices higher but fail twice at almost the same level. Traders interpret this pattern as an indication that selling activity is now strong enough to prevent further upside. After the second candle retreats from that matching peak, traders become more convinced that a short-term top could be forming.
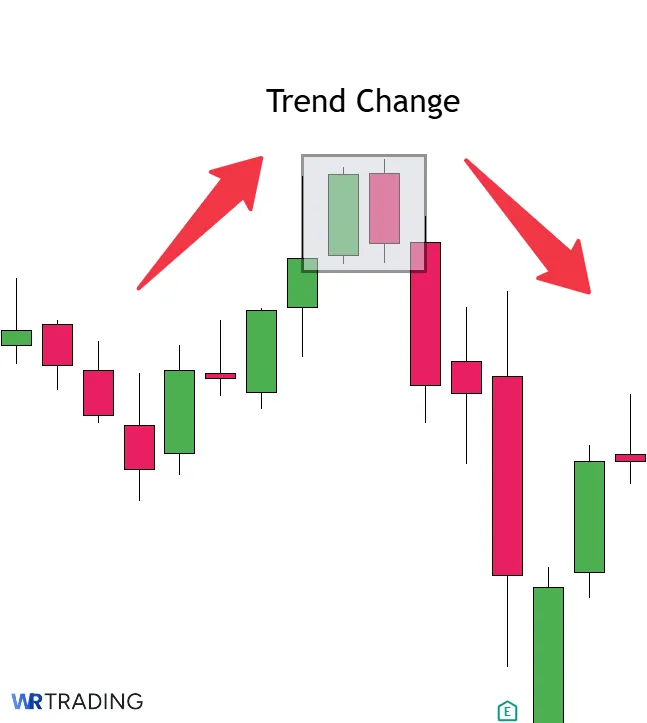
Market psychology behind this structure points to hesitation among buyers. The first candle signals bullish control, yet the second candle’s inability to surpass the earlier high reflects a lack of follow-through. Sellers see this scenario as a chance to enter, presuming that buyers are getting cautious and may soon exit or reduce positions.
Example of the Tweezer Top Pattern in the Chart
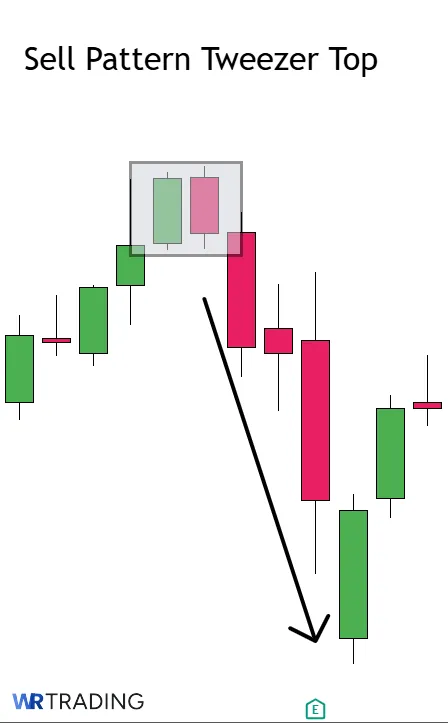
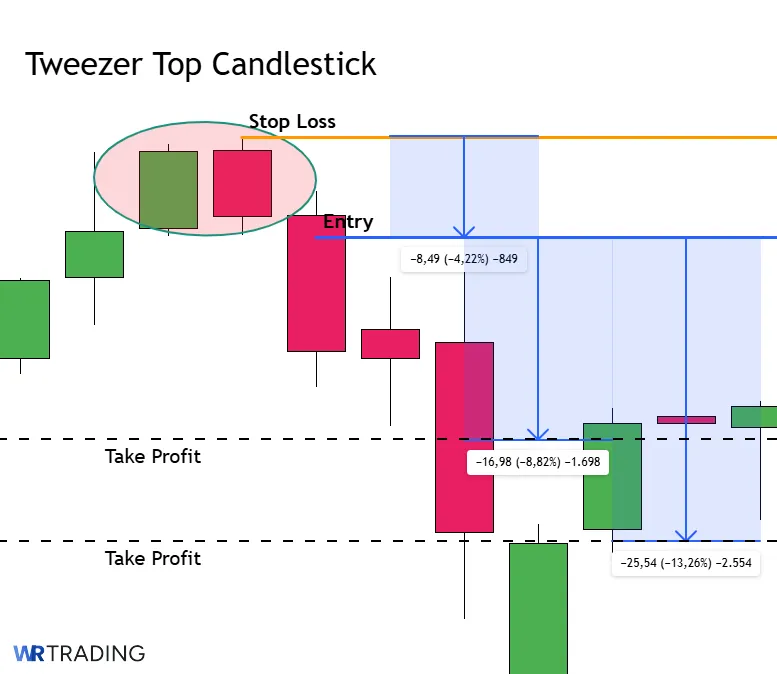
After a strong rally in EUR/USD, the price surged into the 1.0945 zone but immediately ran into resistance. The candle on July 13 closed near its high, and the following session opened slightly higher but failed to push any further. Price rejected the same level for a second day and closed lower, forming a classic Tweezer Top at the top of a short-term uptrend.

That rejection signaled a shift in control, as sellers stepped in aggressively after the double top failed to break. The drop that followed confirmed the reversal, with price pulling back steadily toward the 1.0820 – 1.0800 area. This setup offered a clean entry and clear invalidation just above the highs.
Is The Tweezer Top A Bearish Candlestick Pattern?
A Tweezer Top formation implies a bearish sell signal. The repeated failure at the same high price strongly hints that buyers cannot push the price further. Traders who see it as a reversal often close longs or initiate shorts once their chosen confirmation criteria are met.
Furthermore, additional insight can be gained by viewing the broader trend. Some who remain bullish on higher timeframes might interpret it as a chance to buy dips later, not necessarily an outright bearish stance. However, the pattern itself leans toward a bearish setup.
How to Identify a Tweezer Top Candle in the Chart?
To identify the Tweezer Top, look for two candles that share a very similar, if not identical, high price. Each candle can show a bullish move intraday, but neither session manages to close strongly above that repeated peak. The second candle often closes lower, reinforcing that sellers gained control late in the day.
Before the Tweezer Top forms, you’ll usually see a short-term uptrend or a strong bullish leg pushing into a resistance area. This can be a cluster of green candles or a steady climb leading into a key level like a previous high, round number, or trendline. The pattern is easiest to spot after this kind of move, especially if the rally looks extended or aggressive.
Focus on swing highs, overbought zones, or levels where price has reversed in the past. That’s where the Tweezer Top tends to carry more weight, as it signals that buying pressure has finally run into a wall and sellers are stepping in with conviction.
How to Trade the Tweezer Top Candlestick Pattern
Many approach Tweezer Top as a short signal or an alert to exit long positions. Some use it with indicators or broader market context to filter out false reversals. Our steps can help as a roadmap for turning the pattern into a structured plan, with each part offering perspective on how to find the pattern, waiting for its appearance, choosing the entry point, where to take profit, and opening the trade:
- Find the Pattern
- Wait for Appearance
- Choose Entry
- Choose Take Profit
- Open the Trade
1. Find the Right Tweezer Top Candlestick Pattern Setup
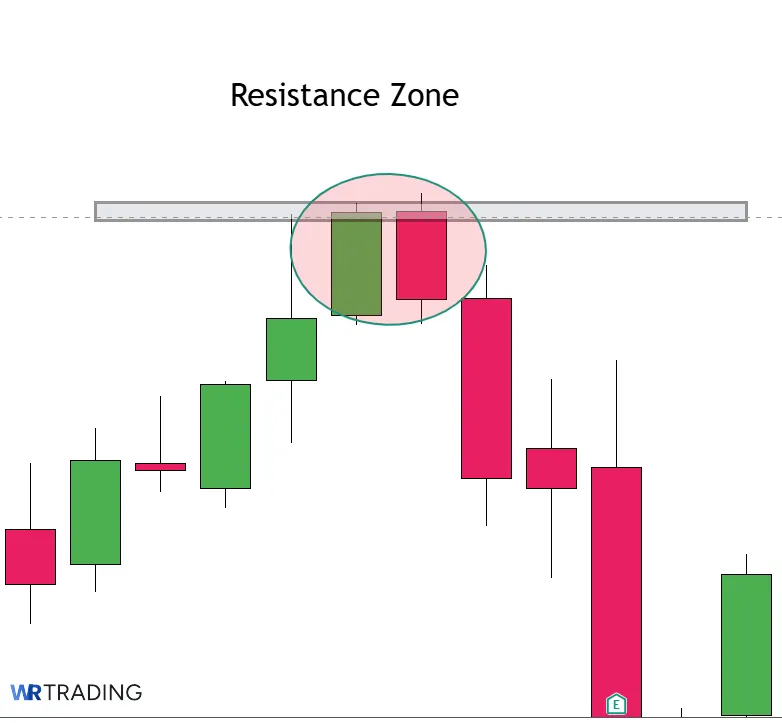
Entries for the Tweezer Top revolve around a scenario where the price is trending upward into a known barrier or overbought zone. A stable upward trend can tempt some traders to remain bullish until a technical pattern confirms weakness. Tweezer Top can form near resistance lines, psychological numbers, or pivot highs where significant selling occurred in the past.
Some integrate momentum indicators or a volume spike for added confidence. A pattern that surfaces right under a known ceiling or after an extended bullish run can signal that buyers have reached a limit. If the broader context shows an overheated market or fundamentals that no longer support higher valuations, the chance of a lasting pullback grows.
2. Wait for the Appearance of the Tweezer Top Candle
It’s important to wait until both candles complete so no false signals occur with the Tweezer Top. The first candle’s strong finish sets the stage, but the second candle must fail near the same peak and then close lower. Traders who jump in after the first day alone risk missing the possibility that the price may break higher on the next session.
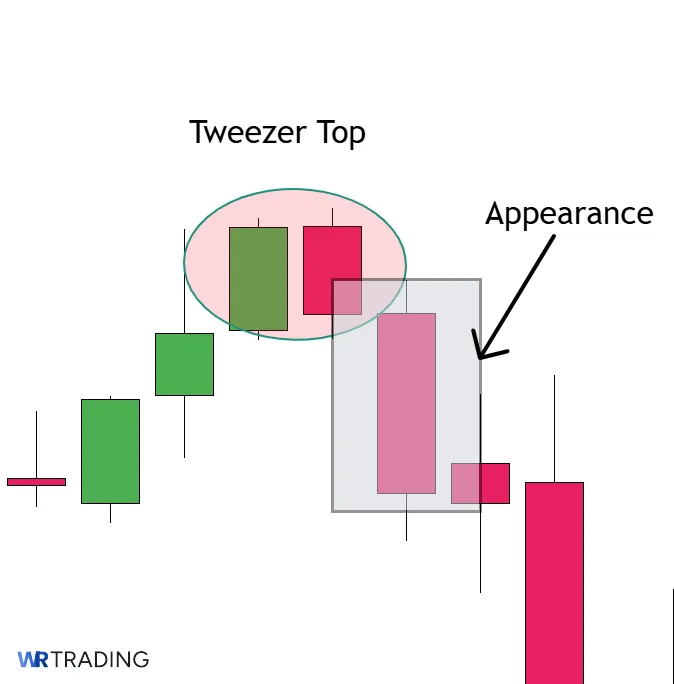
Monitoring intraday data can help. Watch for selling pressure when the price returns to the previous day’s peak. We prefer to see the second day close, confirming that sellers indeed took control. Patience at this step aims to avoid false signals if the market eventually breaks upward instead.
3. Choose Your Entry on the Tweezer Top Pattern
Enter short positions right after the second candle completes, once the matching high is confirmed, and the close indicates a bearish turn. Alternatively, wait for a small break below the second candle’s low to confirm ongoing weakness, at the cost of a slightly worse entry price.
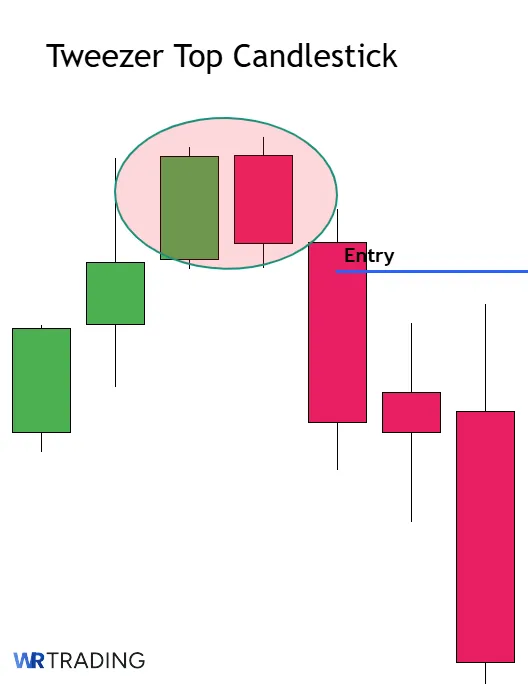
Another tactic involves intraday analysis. As the second candle forms and retests the high from the previous session, traders may open short positions if there are signs of an immediate sell-off. That timing can yield a better risk-reward ratio but raises the possibility of false triggers if the day eventually recovers and closes above the prior high.
4. Choose Your Trading Take Profit
Traders with a short position target a nearby support or a swing low where the price previously bounced. This location might be a horizontal level or a region with high trading activity. Also, you can set a minimum risk-reward ratio, like 2:1, ensuring that potential gains outweigh the risk taken.
Others may hold onto positions if they see stronger reasons for a deeper reversal. If the market recently soared without much retracement, a larger decline could follow. Using a trailing stop can allow room for extended downside while locking in partial gains once the price moves favorably.
5. Open Your Trade
The order type can vary depending on your strategy with the Tweezer Top. A simple market order at the open of the next session might suffice, or a limit order could be used if the price temporarily rebounds intraday, giving a more favorable fill. Regardless of the approach, consistency in risk management helps preserve capital even if an occasional Tweezer Top fails.
The stop-loss goes a few pips or ticks above the highest wick of the pattern, which keeps the position protected without being overly tight. Calculating position size ensures that any single trade does not risk more than a set percentage of capital, such as 1 or 2 percent. This means with a $1,000 budget, you can only risk up to $20 on a single trade.
(Learn To Trade And Read Candlestick Patterns Like A Pro)
What Can Be a Confirmation for the Tweezer Top Candlestick Pattern?
Confirmation often separates reliable Tweezer Tops from chart noise. The list below features the best signals to focus on:
- Substantial Volume at the Matching High: An uptick in trading volume near the repeated peak can show that sellers aggressively counter buyer attempts. When volume rises each time price tries to push above that level, traders conclude that strong supply is present. The heavier the volume, the more convincing the Tweezer Top.
- Momentum Oscillator Divergence: Tools like RSI or MACD can form lower highs while price forms equal highs. This reveals an internal loss of strength beneath the surface. Traders interpret that divergence as another clue that the market may soon tilt downward.
- Break Below the Second Candle’s Midpoint: A definitive move under the halfway mark of the second candle suggests sellers remain in charge after its formation. If the market fails to find support near that midpoint, many see it as a sign of continued bearish pressure.
- Close Below the First Candle’s Open: Some interpret a daily close beneath where the first candle started as a shift in control. It confirms that any gains from the initial bullish bar were undone. That negativity can highlight deeper cracks in bullish momentum.
- Trendline Break on a Lower Timeframe: If a short-term uptrend line cracks around the same moment, it strengthens the case that upward momentum is faltering. A local break can coincide with the tweezer formation, emphasizing that the Tweezer Top is not just an isolated phenomenon. Multiple signals combined can produce a more robust argument for a reversal.
- Aggressive Selling Into the Close on the Second Candle: Late-day or late-session selling often points to traders deliberately closing long positions or opening shorts. If that wave drags the price down sharply, traders see it as strong validation that the repeated high is a near-term ceiling. The timing suggests that buyers lost confidence by the session’s end.
- Indicator Confirmations (Like a Bearish MACD Cross): A MACD line crossing below the signal line as the Tweezer Top forms can show shifting momentum. It becomes more than just a two-candle event when momentum indicators concur. Many treat that synergy as a reason to adopt a more bearish stance.
- Fundamental or News Catalyst Aligning With the Pattern: Negative headlines or disappointing data around the time of the second candle’s top can intensify the selling impulse. Chart watchers see that fundamental input as an extra reason the market might retreat. When the technical pattern and fundamentals agree, it increases traders’ conviction.
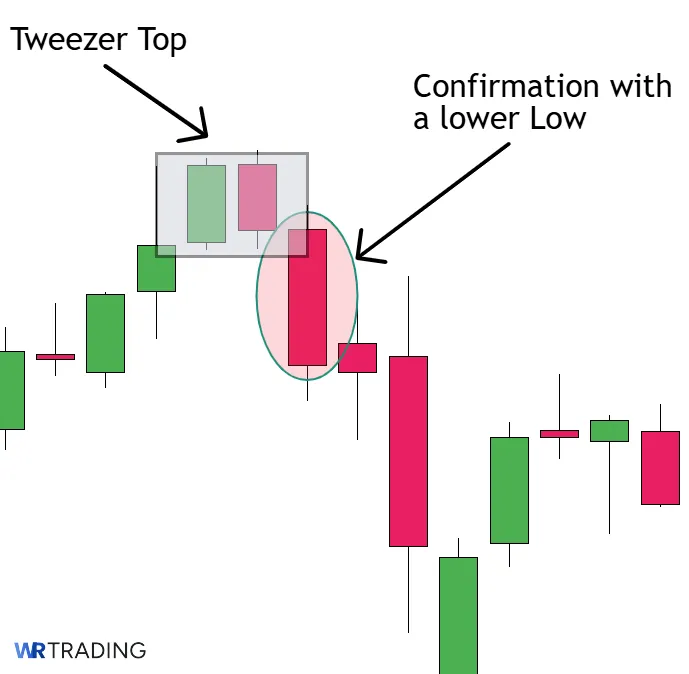
- Lower Low Formed Immediately After The Pattern: A fresh swing low that dips below any minor supports indicates strong follow-through. This move cements that the repeated top was indeed a pivot toward selling interest. Many traders wait for that lower low as the final sign to confirm a shift toward a short bias.
What Is the Hit Rate of the Tweezer Top Pattern?
Research from various sources suggests that two-candle reversals, including Tweezer Tops, have success rates running between 55% and 65% when used in the correct market context. Thomas Bulkowski’s research shows the reliability among patterns of this nature.
What Are the Limitations of the Tweezer Top Pattern?
It’s a short-term signal, reflecting two sessions that happen to share an upper bound. Broader fundamentals or a large-scale bull trend can overpower that localized top. Two bars alone cannot guarantee a sustained reversal, since they offer limited historical context.
Also note the pattern’s small sample size. Unlike multi-bar formations that show extended buyer or seller pressure, two days may not reflect deeper sentiment. Traders who do not confirm it with extra analysis risk being whipsawed if the market resumes climbing shortly after.
What Are Possible Strategies for the Tweezer Top Candlestick Pattern?
There are multiple ways to trade a Tweezer Top. In this section, we’ll go through a few strategies that show how traders actually use the pattern in different setups:
- Resistance Ceiling
- Momentum Confirmation
- Using News
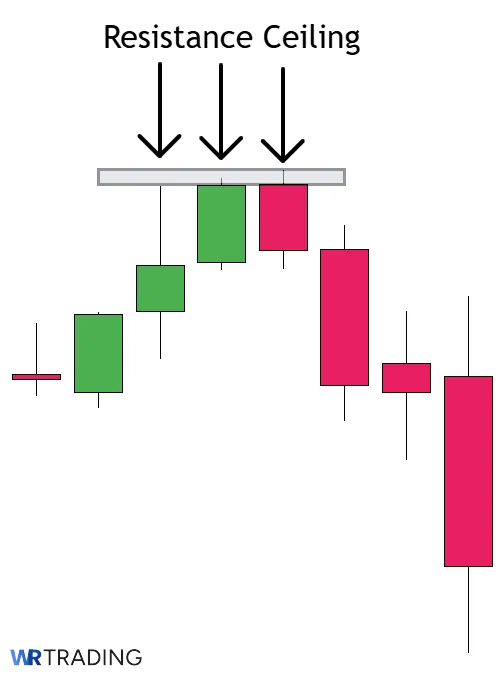
Shorting Near A Resistance Ceiling
Look for an established ceiling on your chart where the price has turned lower in the past. If a Tweezer Top shows up right around that level, it often suggests that traders ran out of bullish sentiment at the same height two sessions in a row. Wait for the second candle to close below its midpoint or under the first candle’s midpoint if you prefer tighter validation.
Open your short once that downward bias is confirmed. Position your stop above the nearly identical highs, giving you a clear line for invalidation. Consider setting a profit target at the nearest support or a fixed reward-to-risk ratio such as 2:1 or 3:1.
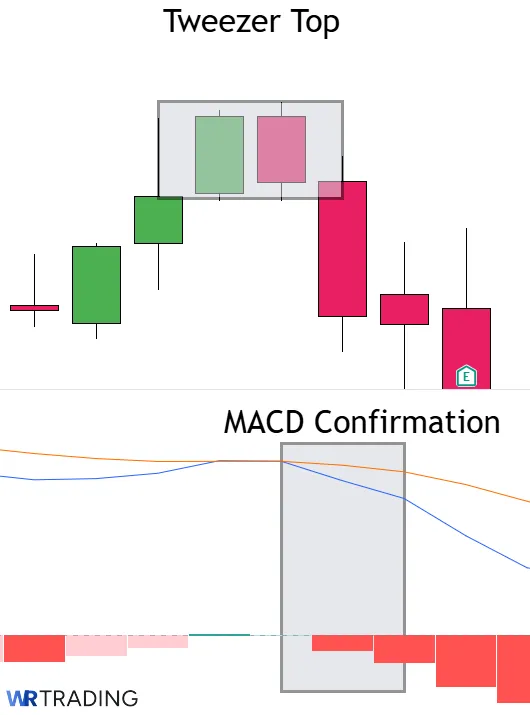
Momentum Confirmation With A Bearish Indicator
Combine the Tweezer Top with a momentum tool like RSI or MACD. When these indicators tilt lower just as the second candle fails at the same high, you gain added confidence that the sellers are stepping in. A reading above normal ranges (such as RSI over 70) sets up for a deeper pullback once the pattern finalizes.
After noticing momentum rolling over, wait until the final session closes, confirming the shared high. Place your stop slightly above that high. Targets can be set toward the nearest support, prior swing low, or by using a reward-to-risk approach. This method can keep you from jumping in too early, since you see both price action and momentum breaking down together.
Using News Or Data Releases As A Trigger
When a market spikes on fresh news or economic data, it can create a short-lived rally that stalls out if buyers lose confidence. If a Tweezer Top appears soon after a data release, wait for the second candle to confirm the failed push. This pattern can warn that the market’s initial reaction has run its course.
Once the second candle closes beneath its midpoint, open a short with a stop above the twin highs. If the news spark fizzles, you may see an accelerated drop as those who chased the event bail out. By pairing the Tweezer Top with a well-defined fundamental catalyst, you gain insight into why the price might be reversing, not just that it looks overextended.
What Are the Pros and Cons of Trading the Tweezer Top Candle Pattern?
While the Tweezer Top is simple to recognize and quick to form, it’s not without its trade-offs. The pattern can offer reliable short-term signals when used correctly, but it also comes with limitations that traders should keep in mind. This section breaks down the key advantages and drawbacks, so you can decide when it’s worth acting on and when it might be better to wait for stronger confirmation.
Pros
- Simple two-candle structure makes it easy to recognize
- Effective timing tool after strong bullish legs
- Works well with resistance and round numbers
- Good for short-term trades and exit signals
- Fast confirmation without needing extended build-
Cons
- Appears frequently but fails often
- No clear built-in stop-loss level
- Less effective without trend context
- Not always easy to catch in real time
- Not always positioned at meaningful levels
What Are the Advantages of the Tweezer Top Pattern?
The Tweezer Top gives traders a structured way to leave an existing trend with confirmation. Here are specific benefits of using this pattern in real trades:
- Simple two-candle structure makes it easy to recognize: The Tweezer Top is straightforward and doesn’t require advanced interpretation. If two candles share a clear high and the second closes lower, the setup is there. This makes it easy to scan and trade without second-guessing.
- Effective timing tool after strong bullish legs: Tweezer Tops form after sharp upward moves, right when price begins to stall. It gives traders an early heads-up that momentum is shifting. That helps time short entries before broader confirmation appears.
- Works well with resistance and round numbers: The pattern becomes more reliable when it forms near known price ceilings. It often shows up at previous highs or psychological levels. That alignment adds confidence to the reversal signal.
- Good for short-term trades and exit signals: Traders use it to catch intraday pullbacks or lock in profits near the top. It works well on lower timeframes where reversals happen quickly. It can also be a clean exit sign when long positions start to weaken.
- Fast confirmation without needing extended build-up: Unlike multi-candle patterns, the Tweezer Top forms and confirms in just two sessions. You don’t need to wait through long setups to get a read. That makes it efficient for active traders watching multiple charts.
What Are The Disadvantages Of The Tweezer Top Pattern?
While the Tweezer Top is useful in trending conditions, it does have its limitations. Traders need to understand its weaknesses so they can avoid forcing it into poor setups. These are the main drawbacks:
- Appears frequently but fails often: Tweezer Tops can show up regularly on lower timeframes. However, without strong context backing the pattern, many of them lead to small pullbacks or no real reversal at all.
- No clear built-in stop-loss level: The structure doesn’t define a natural point for invalidation. Traders have to rely on nearby highs or recent structure to manage risk properly.
- Less effective without trend context: In choppy or sideways markets, this Tweezer Top has low follow-through. It needs strong momentum behind it to trigger clean reversals.
- Not always easy to catch in real time: The rejection looks clear once it finishes, but during formation, the second candle might still appear bullish. This delay can lead to late entries or missed setups.
- Not always positioned at meaningful levels: The pattern loses impact when it forms away from key resistance or prior highs. Without a strong technical zone, the rejection can lack follow-through. Traders often enter too early when the context isn’t solid.
Can the Tweezer Top Pattern Have Failure Signals?
Yes, a repeated high might initially appear convincing, but fail to spark further selling. These are the most common failure signals to watch out for:
- Gapping Above the Peak on the Next Session: An immediate gap higher can demolish the prior day’s upper limit. Buyers showing up in force at the open suggests optimism. That action tells observers the short-lived dip was not enough to shift overall sentiment.
- Strong Close Above Both Candle Bodies: If a subsequent bar erases any hint of weakness by closing above the entire pattern, the top is not holding. This bullish turnaround indicates sellers lacked follow-through. Many treat that reversal as a sign that demand quickly reasserted itself.
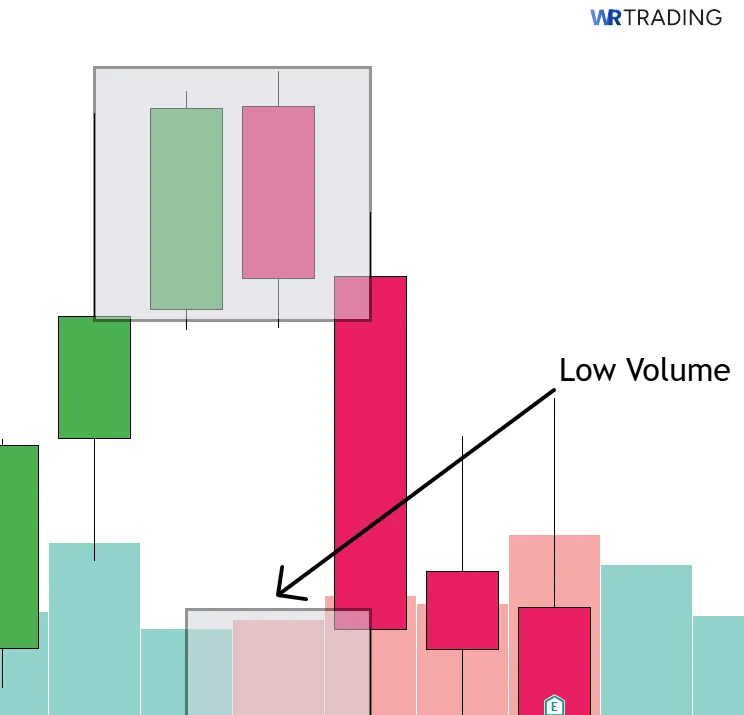
- Volume Remaining Thin During the Second Candle’s Drop: Minimal volume on the second candle can raise suspicion that the selling is temporary. The market might bounce back once liquidity returns. Skeptical traders await real conviction from sellers before calling a top.
- Fundamentals Turn Positive: If economic data or earnings releases are unexpectedly strong, it can nullify the negativity that formed the Tweezer Top. The price might break upward on news that changes the narrative.
- Oscillators Show Continued Bullish Momentum: RSI or MACD might remain in an upward swing, ignoring the two-candle stall. Some interpret that mismatch as a caution that the Tweezer Top is shallow. If momentum measures refuse to roll over, the chart-based top might not hold.
- Immediate Buy Orders Near The Second Candle’s Close: A late-session wave of buying or a next-day rally can indicate that big players stepped in. This response lifts the price back above the second candle’s open, undermining the pattern’s significance.
Alternatives to the Tweezer Top Pattern:
| Pattern | Type of Pattern | Best Use Case | Key Characteristic / Condition |
|---|---|---|---|
| Double Top | Multi-candle bearish reversal | Identifying a major turning point after two peaks | Two distinct highs separated by a moderate pullback, with a break of the intervening support confirming the reversal |
| Dark Cloud Cover | Two-candle bearish reversal | Spotting abrupt sentiment shift after a bullish candle | The second candle opens above the previous high but closes below the midpoint of the first candle, hinting at new selling |
| Bearish Engulfing | Two-candle bearish reversal | Detecting immediate dominance by sellers | A large red candle fully engulfs a smaller green candle, indicating sudden pressure from sellers |
| Evening Star | Three-candle bearish reversal | More comprehensive sign of peaking after an uptrend | A bullish candle, a small indecision or gap candle, and a strong bearish candle that closes well into the first candle’s body |
| Hanging Man | Single-candle bearish reversal | Spotting possible peaks near the end of an uptrend | Candle with a small body near the top, long lower shadow, and little to no upper shadow, showing intraday selling overcame the open |
Learn about more alternatives in our candlesticks pattern pdf (download for free).
Tweezer Top Pattern vs Tweezer Bottom Pattern
Tweezer Top and Tweezer Bottom are mirror-image patterns that reflect a change in momentum. The Tweezer Top forms after a rally and shows buyers failing to break through resistance, while the Tweezer Bottom appears after a decline and signals sellers losing control.
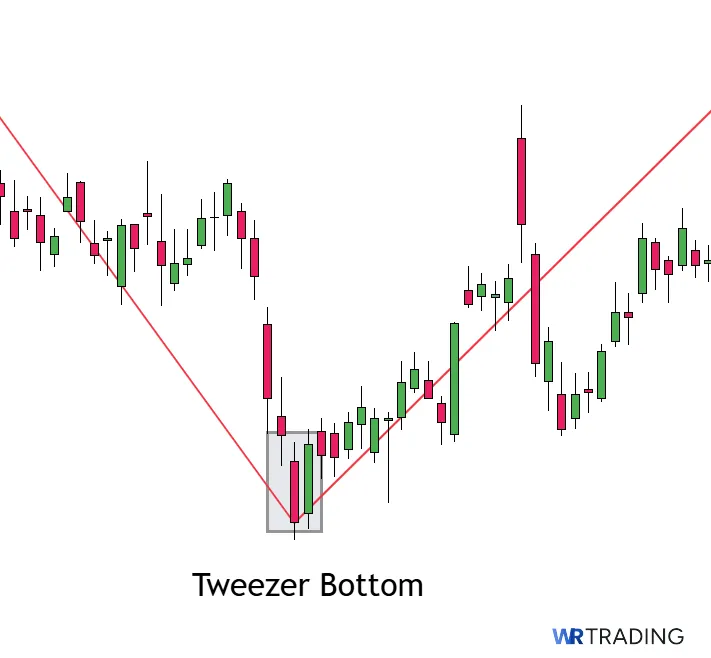
These patterns involve two candles with matching highs or lows, and both suggest a potential reversal when the price tests a level twice and fails to move beyond it. What separates them is the direction of pressure – bulls losing steam in the Top Tweezer, and bears running out of strength in the Bottom Tweezer.
| Section | Tweezer Top Pattern | Tweezer Bottom Pattern |
|---|---|---|
| Construction | First Candle: A bullish candle pushing upward after a rally. Second Candle: A candle with a similar high, showing buyers failed to break through again and closing lower. | First Candle: A bearish candle in a falling market. Second Candle: A candle with a similar low, showing sellers failed to push further and closing higher. |
| Forecast | Suggests a weakening bullish move and the potential for a bearish reversal. | Indicates selling pressure has faded and buyers may begin a reversal to the upside. |
| Type of Pattern | Two-candle bearish reversal pattern. | Two-candle bullish reversal pattern. |
| Trend Prior to Pattern | Forms after an uptrend or extended bullish push. | Develops following a downtrend or strong bearish phase. |
| Opposite Pattern | Tweezer Bottom. | Tweezer Top. |
Learn Pattern Trading With the WR Trading Mentoring
Traders who want to learn how to use patterns like the Tweezer Top should look for structured guidance because it increases the odds of using the pattern correctly. WR Trading mentoring offers a learning environment focused on reading charts effectively, implementing disciplined risk management, and aligning technical insights with fundamental signals.
The guides emphasize multiple scenarios where two candle reversal patterns appear, including how to handle conflicting data or unexpected market events. The course aims to improve confidence and consistency, thanks to real-time feedback and a solid framework for evaluating setups like Tweezer Top. Joining can shorten the learning curve and reduce the trial-and-error that often comes with self-directed study.
(Learn To Trade And Read Candlestick Patterns Like A Pro)
Conclusion: The Tweezer Top Signals Buyer Fatigue Near Key Highs
The Tweezer Top warns that bullish sentiment has stalled, as shown by two consecutive candles meeting the same high and then giving way to sellers. Traders interpret it as a message that buyers are no longer pushing prices upward without resistance. Depending on your position, you can either short the pattern or use it as a signal to go out of long trades.
It can be powerful on charts where previous resistance or overbought conditions provide extra context. Confirmation helps because two bars alone might not guarantee a major drop. When combined with risk control and a well-thought-out plan, the Tweezer Top can become a reliable tool for spotting potential turning points.
FAQs: Most Frequently asked Questions on Tweezer Top Candlestick Pattern
Is the Tweezer Top Pattern Always Bearish?
Yes, it suggests a possible bearish turn or at least a pause in upward momentum. Two matching highs highlight that buyers ran out of steam at the same point twice. Confirmation helps decide whether it is a brief stall or the start of a more extended decline.
Do I Need High Volume for Tweezer Top to Work?
Many traders prefer to see volume supporting the idea that sellers defended the top. Low volume by itself does not invalidate the pattern, but bigger participation often improves reliability. Volume is one more piece of evidence showing whether supply overcame demand.
Should Both Candles Have Large Bodies?
Two large bullish candles are not required. One can be smaller, as long as the highs closely match. The main idea is that price attempts to move higher but fails at nearly the same level, revealing a likely cap on further buying.
Could a Market Bounce Back After a Short Dip From the Pattern?
Yes, that possibility exists, especially if the broader trend stays bullish or a major support lies just beneath. Some trades aim for small profits, expecting only a pullback. Others look for deeper reversals if other signs confirm a top.
Does a Tweezer Top Pattern Lead To Major Trend Reversals Every Time?
Not always. It might only create a modest drop, then the uptrend might continue. Market structure, fundamentals, and sentiment all play a role in determining whether it evolves into a longer-term reversal.