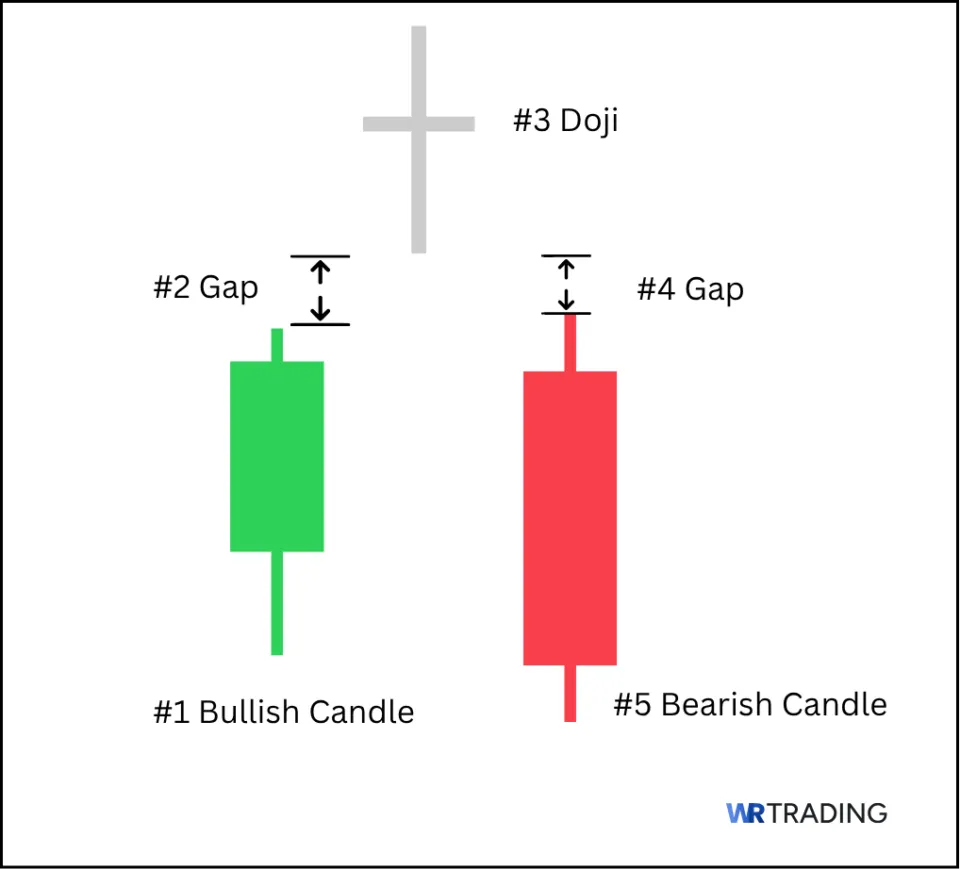
The Bearish Abandoned Baby consists of three candles: a strong bullish candle, followed by a doji that gaps above the first, and finally, a strong bearish candle that gaps below the doji. This distinct structure captures a sudden shift in market psychology — from overconfidence to uncertainty, and finally, rejection of higher prices.
It is a somewhat rare but powerful candlestick pattern that typically appears at the end of an uptrend, signaling a potential reversal from bullish to bearish sentiment. When traded correctly, the Bearish Abandoned Baby can offer early entry into high-probability short setups, particularly when confirmed by volume, resistance levels, or bearish divergence.
The pattern works best when combined with key confirmation methods like overbought RSI, resistance levels, or bearish divergence. It reflects hesitation, imbalance, and a possible reversal in market sentiment. Here we explain its formation, provide examples, outline trading strategies, compare it with similar candlestick setups, and assess its success rate using tested methods.
In our experience, the Bearish Abandoned Baby has proven especially effective when used with a disciplined approach and clear entry and exit rules.
Key Facts about how the Bearish Abandoned Baby is formed:
- Type of Pattern: Bearish reversal
- Construction characteristics:
- First candle: A long bullish (green) candle.
- Second candle: A doji that gaps above the first candle.
- Third candle: A long bearish (red) candle that gaps below the doji.
- Trend prior to pattern: Established uptrend
- Trade forecast: Potential downward reversal.
- Interpretation: Signals a move from a bullish to bearish sentiment.
- Stop-loss placement: Above the high of the doji or the first candle.
- Opposite pattern: Bullish Abandoned Baby
- Success rate: Approximately 77% in certain studies.
(Learn To Trade And Read Candlestick Patterns Like A Pro)
How is the Bearish Abandoned Baby Pattern Formed?
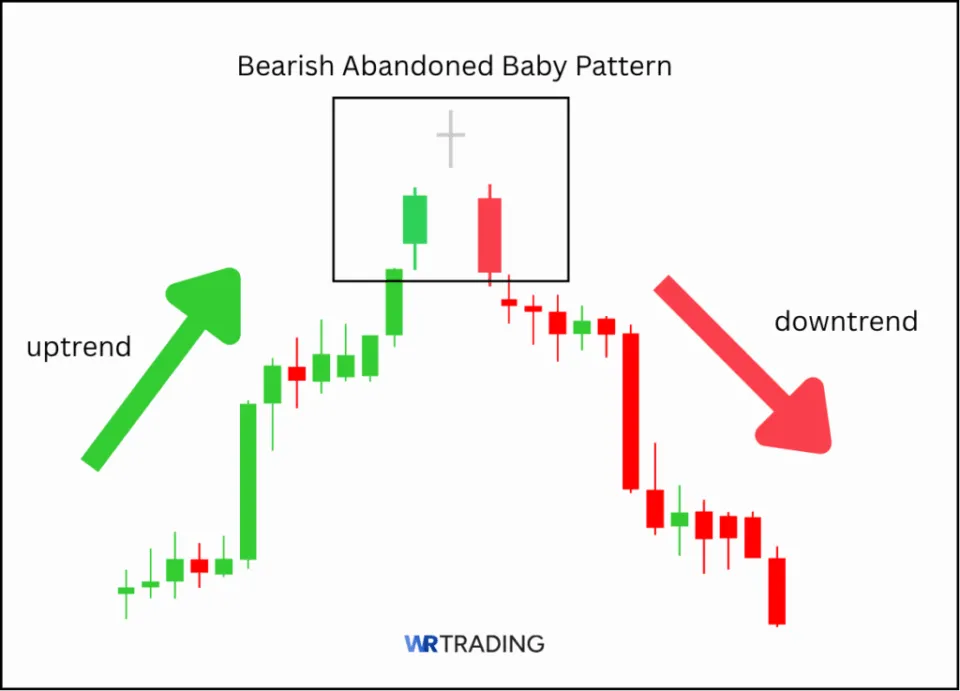
The Bearish Abandoned Baby pattern typically forms at the top of a strong uptrend and signals a potential sharp reversal from bullish to bearish sentiment. It is composed of three distinct candles and is considered one of the more reliable yet rare reversal patterns due to its specific gap criteria.
- First Candle: A long bullish (green) candle reflects strong buying pressure and ongoing market confidence. This candle continues the uptrend and often closes near its high, reinforcing bullish momentum.
- Second Candle (doji): A doji candle (where the open and close are nearly equal) forms after a gap up, meaning it opens above the high of the first candle. The doji signals market indecision, as neither buyers nor sellers take control. Its isolation — no overlap with the previous or next candle — is key to identifying the pattern.
- Third Candle: A long bearish (red) candle opens below the doji’s low, creating another gap. This candle confirms a strong shift in sentiment, with sellers taking over and driving prices down sharply.
As for where and when this pattern forms, it’s most often seen at the peak of an extended bullish trend. It appears near resistance zones, psychological round numbers, or after overbought conditions. It also typically occurs on daily or higher timeframes, where gaps are more likely and significant.
This pattern occurs when bullish momentum becomes overextended, and traders begin to take profits or hesitate. The gap up into the doji reflects late buyers entering too eagerly — but they’re met with immediate reversal pressure, evidenced by the gap down into a strong bearish candle. It represents a trap for overconfident bulls and an opportunity for bears to take control.
This pattern is rare and suggests a potential bearish reversal when it appears.
What does the Bearish Abandoned Baby Candlestick Pattern Indicate?
The Bearish Abandoned Baby pattern reflects a dramatic shift in market sentiment from optimism to hesitation, and ultimately to pessimism. It forms at the top of an uptrend and reveals that bulls are losing momentum, with bears stepping in aggressively.
- Candle 1 – a long bullish candle: This candle reflects strong buyer control. It opens low and closes high, pushing the market upward. Optimism is dominant, and the trend appears healthy.
- Candle 2 – a doji that gaps up: This is the emotional turning point. The market opens above the prior close, but buyers fail to push higher. A doji (or near-doji) forms — showing indecision. Importantly, this candle stands alone, with price gaps on both sides. It reflects hesitation and the first real sign of weakness.
- Candle 3 – a strong bearish candle that gaps down: The final candle opens below the doji, leaving it “abandoned”, and closes deep into the body of the first candle. This signals bearish dominance, confirming the reversal as sellers decisively reject the higher price levels.
In interpretation, you’ll see that this three-candle sequence tells a story of bullish momentum → hesitation → bearish rejection. When confirmed, it marks a strong reversal signal and an opportunity to enter a short position early in a new downtrend.
The initial bullish candle shows strong buying, the doji reflects indecision, and the final bearish candle suggests that sellers have gained control. Traders interpret this as a signal to consider exiting long positions or entering short positions.
Where does the Name of the Bearish Abandoned Baby Candlestick Pattern come from?
The term “Bearish Abandoned Baby” derives from the visual appearance of the pattern. The doji candle appears isolated between the bullish and bearish candles, resembling an “abandoned baby.”
(Learn To Trade And Read Candlestick Patterns Like A Pro)
What is an Example of the Bearish Abandoned Baby Pattern?
Let’s apply this pattern’s interpretation to the USD/JPY forex pair in an uptrend:
- First candle: A long green candle opens at 138.20 and closes at 139.30, confirming bullish strength.
- Second candle: A doji opens at 139.50 and closes at 139.52, with noticeable gaps from both the first and third candles.
- Third candle: A large red candle opens at 139.10 and closes at 137.80, clearly breaking down.

We can interpret this as buyers appearing confident at first, but the doji shows sudden indecision. The final bearish candle signals rejection — confirming that the uptrend is over.
This clean abandonment of the doji confirms a bearish reversal, and the pattern prompts a short position once confirmed by momentum or volume indicators.
How to Identify the Bearish Abandoned Baby Pattern?
To correctly identify this pattern, the preceding trend has to have been a sustained uptrend.
- First candle: Look for a strong bullish candle with a wide body and little-to-no lower wick.
- Second candle (doji): The next candle should gap up from the first and form a doji (open and close are nearly equal), showing indecision. It must not overlap either the first or third candle — gaps on both sides are key.
- Third candle: A large bearish candle that gaps down from the doji and closes deep into the range of the first candle, confirming the reversal.
The principal features of the pattern are a visible “abandonment” of the doji that indicates a sharp change in sentiment. The pattern works best on daily or higher timeframes, and the gaps between the candles are visually pronounced, and crucial for the pattern’s validity.
(Learn To Trade And Read Candlestick Patterns Like A Pro)
How to Trade the Bearish Abandoned Baby Pattern?
Trading this pattern involves several steps:
1. Find the Right Setup for the Bearish Abandoned Baby Candlestick Pattern
The pattern is best identified after a strong, extended uptrend, preferably near a resistance zone or a round-number psychological level.

Visually, the pattern forms a sharp peak, where the first candle surges upward, the second candle floats indecisively (the doji), and the third candle plunges downward, leaving the middle candle “abandoned”.
The gap structure is essential — this is what distinguishes it from other reversal patterns. You can look for clean price gaps, volume divergences, or weakening RSI before the pattern forms to increase its reliability.
2. Wait for the Appearance of the Bearish Abandoned Baby Candlestick Pattern
Ensure all three candles meet the criteria: a bullish candle, a gapped doji, and a bearish candle gapping below the doji.
3. Open your Trade – Entry Point

Enter a short position after the third candle confirms the pattern, and set a stop-loss above the high of the doji or the first candle.
4. Wait for a Confirmation or Not
Some traders wait for additional confirmation, such as increased volume or bearish indicators, before entering the trade.
Option 1: Wait for confirmation (a conservative approach)
Here. you’ll wait for a bearish candle to close below the low of the third candle or break a recent support level. Additional confirmation may come from:
- A spike in bearish volume.
- The RSI moving below 50.
- A bearish MACD crossover.
The benefits of this approach are that it reduces false signals, while it does come at the risk of sacrificing the best entry point
Option 2: Enter immediately after pattern shows (a more aggressive approach)
With a more aggressive approach, you enter short at the open of the next candle, placing your stop above the high of the abandoned doji. The pros are the best entry price and high R:R, while the cons include the fact that of course this strategy is riskier without confirmation
To summarize an entry strategy:
- Conservative entry: Break and close below third candle’s low.
- Aggressive entry: Entry just after third candle closes.
- Stop-loss: Above the high of the doji or pattern.
- Target: Prior support zones, fib levels, or trendline retests
5. Choose your Trading Take Profit
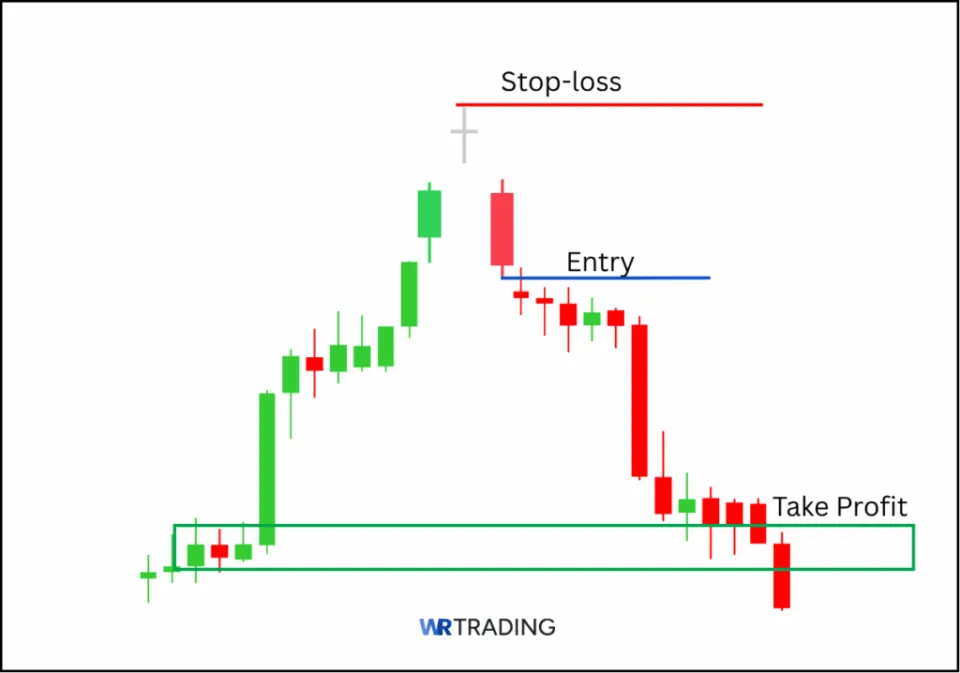
Set your take-profit level based on support levels or a risk-reward ratio that suits your strategy.
(Learn To Trade And Read Candlestick Patterns Like A Pro)
What is the Hit Rate of the Bearish Abandoned Baby Candlestick Pattern?
Studies have shown that the Bearish Abandoned Baby pattern has a success rate of approximately 77% in predicting bearish reversals. Remember, however, due to its rarity, that the sample size in these studies has been limited, although the pattern is widely accepted as a more reliable indicator than most.
How Accurate is the Bearish Abandoned Baby Pattern?
The pattern is considered highly accurate, with a reported success rate of around 77%. You should nonetheless use it in conjunction with other indicators to confirm signals.
What are the Pros and Cons of the Bearish Abandoned Baby Pattern?
Pros
- High success rate
- Clear reversal signal
- Easy to identify
Cons
- Rare occurrence
- Requires confirmation from further analysis
- May produce false signals
What are the Advantages of the Bearish Abandoned Baby Pattern?
The pattern’s high success rate and clear structure make it a valuable tool for traders of many kinds. Its appearance provides an early warning of potential trend reversals, allowing you to adjust your positions accordingly.
What are the Disadvantages of the Bearish Abandoned Baby Pattern?
Due to its rarity, traders may not encounter this pattern frequently. Additionally, without confirmation from other indicators, the pattern may lead to false signals.
Can the Bearish Abandoned Baby Have Failure Signals?
Yes, the pattern can fail, especially if not confirmed by other indicators or if it occurs in a weak trend. You should always use it alongside other technical analysis tools to increase reliability before entering your trades.
Which Indicators can be Combined with the Bearish Abandoned Baby?
Combining the pattern with indicators like the RSI, MACD, and volume analysis can enhance its reliability.
For instance, an overbought RSI reading alongside the pattern may strengthen the bearish signal, allowing you to make better informed trading decisions that pay you in consistent success.
- Moving Averages: Use 50- or 200-period MAs. If the pattern forms below a flattening or downward-sloping MA, it strengthens the bearish case.
- RSI: Look for RSI turning below 50 after being overbought (>70) — signals momentum loss.
- MACD: Watch for MACD line crossing below signal line, or histogram flipping negative shortly after the pattern.
- Volume indicators: Confirm with rising volume or a breakdown on Volume Profile, showing aggressive sellers stepping in.
- ADX: Rising ADX (above 25) confirms the new bearish trend has strength.
Combine at least two of the above indicators with the pattern for stronger validation and trade confidence.
(Learn To Trade And Read Candlestick Patterns Like A Pro)
What are Similar Patterns to the Bearish Abandoned Baby Pattern?
A number of candlestick patterns denote similar potential in the markets, notwithstanding that their construct might appear completely different to the Bearish Abandoned Baby.
| Pattern | Description |
|---|---|
| Evening Star | Three-candle pattern indicating a bearish reversal. |
| Bearish Harami | A small bearish candle within a larger bullish one. |
| Three Black Crows | Three consecutive bearish candles indicating reversal. |
What is the Opposite Pattern of the Bearish Abandoned Baby?
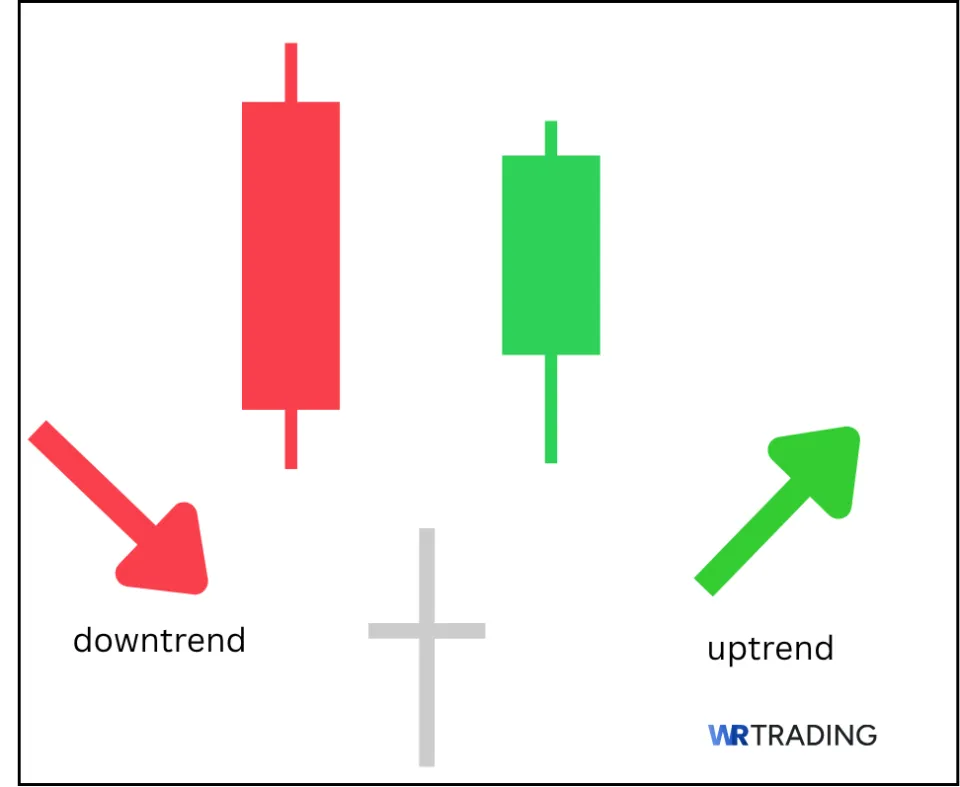
The opposite pattern of the Bearish Abandoned Baby is the Bullish Abandoned Baby, which signals a potential reversal from a downtrend to an uptrend. It consists of a bearish candle, followed by a doji that gaps below, and then a bullish candle that gaps above the doji.
What is the Difference Between the Evening Star and the Bearish Abandoned Baby?
Both patterns indicate bearish reversals, but the Bearish Abandoned Baby requires gaps between the candles, making it rarer and potentially more significant.
| Feature | Evening Star | Bearish Abandoned Baby |
|---|---|---|
| Middle Candle | Small body | Doji |
| Gaps Required | Not necessarily | Yes |
| Frequency | More common | Rare |
What is the Difference Between a Morning Star and a Bearish Abandoned Baby?
The Morning Star is a bullish reversal pattern, while the Bearish Abandoned Baby is a bearish reversal pattern. The Morning Star appears after a downtrend, indicating a potential upward reversal.
What are the Limitations of the Bearish Abandoned Baby?
While a delight to encounter as it’s a strong and comparatively reliable signal, the Bearish Abandoned Baby does have its limitations:
- Rare occurrence.
- Requires confirmation.
- May produce false signals.
- Not effective in all market conditions.
Learn Pattern Trading with WR Trading Mentoring
Enhance your trading skills by learning to identify and trade candlestick patterns like the Bearish Abandoned Baby with WR Trading’s mentoring program. Our expert guidance will help you understand market psychology and develop effective trading strategies.
If you’re looking to master candlestick patterns like this one and implement them in a structured, results-driven way, we highly recommend our hands-on mentoring at WR Trading. We’ve tested it, we’ve traded it—and we can show you how to make it work in live forex markets and beyond.
If you’re ready to take the final step towards profitability, visit WR Trading to learn more.
(Learn To Trade And Read Candlestick Patterns Like A Pro)
Conclusion: Navigating Market Reversals with the Bearish Abandoned Baby
The Bearish Abandoned Baby is a powerful yet rare candlestick pattern that offers traders a highly accurate signal of a potential bearish reversal, particularly in a downtrend that follows an extended uptrend. It’s structured around clear visual cues: a strong bullish candle, a gapped doji representing indecision, and a sharp bearish follow-up candle that signifies the start of a new downward trend.
While this pattern can be highly effective, its rarity means it should not be the sole basis for trading decisions. Incorporating it into a broader technical analysis strategy—especially with confirmation from indicators like the RSI or MACD—can improve your trade success rate.
From our experience, the Bearish Abandoned Baby pattern can be a game-changer when used correctly and with patience. It works best when combined with strong resistance levels and additional confirmation tools. The pattern’s psychology tells a compelling story of shifting market sentiment, giving you the meaning behind the move, not just the signal.
In summary: use the Bearish Abandoned Baby pattern as part of a comprehensive trading plan, respect its strengths and limitations, and you’ll be well on your way to catch major reversals before the crowd.