The Morning Star candlestick pattern is a bullish reversal pattern that characteristically denotes a shift from a downtrend to an uptrend. It consists of three candlesticks and typically forms after a downtrend, and is considered one of the most reliable bullish reversal patterns, signalling that the market sentiment is shifting from bearish to bullish.

Pattern Specifications of a Morning Star Candlestick:
- The Morning Star Candlestick Pattern is a 3-candlestick formation:
- The first candlestick will be a long bearish (red) candlestick.
- The second candlestick is a small-bodied candlestick (the “star”).
- The third candlestick comes as a long bullish (green) candlestick that closes well above the midpoint of the first candlestick.
- Forecast: The pattern predicts a bullish reversal.
- Type of pattern: The Morning Star is a reversal indicator
- Trend prior to pattern: Bearish sentiment precedes the pattern formation (downtrend)
- Opposite patterns: The Evening Star Candlestick Pattern is the direct opposite of the Morning Star formation
- Stop-loss placement: In a Morning Star candlestick pattern trade, you typically want to place your stop-loss below the lowest point of the third candlestick or below the low of the star candle
- Location: The Morning Star pattern typically forms at the end of a downtrend or at a key support level
- Trend confirmation: The pattern is considered more reliable when it appears after a significant downtrend
- Gaps: Ideally, the second candlestick (the star) should gap down from the first candlestick, indicating a strong shift in market sentiment, although a gap is not mandatory for the pattern to form
How is the Morning Star Candlestick Pattern structured?
To understand how the morning star pattern is constructed, it is important first to recognise that there are different shapes.
What is a Green Morning Star Pattern?
A Green Morning Star is a specific type of candlestick pattern that signals a potential reversal from a downtrend to an uptrend-it’s positive, bullish.
It consists of three candlesticks:
- A large red (bearish) candlestick that reflects the prevailing downtrend.
- A small-bodied candle (that’s either bullish or bearish) that indicates indecision, often with a gap down from the first candle.
- A large green (bullish) candlestick that closes well above the midpoint of the first candlestick, signaling a potential trend reversal and the beginning of an uptrend.

The “green” aspect of the name refers to the third candlestick, which is bullish, showing an upward momentum.
This pattern is considered a strong signal of a trend reversal when it’s confirmed by subsequent price action.
What is a Red Morning Star Pattern?
The Red Morning Star pattern signifies downward momentum in markets, where an initial large bearish move (red candle) is followed by a small-bodied candle (representing indecision or consolidation).
Then a red candle follows, signifying that the reversal is not yet fully established-this variant can suggest a potential continuation or a failed reversal.

The key difference is that a Red Morning Star might not signal a full reversal, but rather a temporary slowdown or hesitation in the downtrend.
Is a Morning Star Candlestick Bullish or Bearish?
The Morning Star pattern itself is generally considered bullish, because it typically marks the end of a downtrend and suggests that upward momentum is likely to follow.
The first red candlestick shows that the market is in a bearish state, the second small candlestick reflects indecision or a “pause” in the trend, and the third large green candlestick suggests that buyers are gaining control, confirming the shift in market sentiment.
What does a Morning Star Candlestick Pattern Signify?
The Morning Star pattern signifies a potential reversal of market sentiment, transitioning from a bearish to a bullish phase.
Psychologically, the pattern represents the following:
- The first (bearish) candle indicates a downtrend, with selling pressure dominant (bears are in control and sentiment is negative).
- The second candle (indecision) shows the market pausing, as neither the bulls nor bears can take control, indicating a period of consolidation or uncertainty-it could be a small-bodied candle, a Doji, or even a gap down.
- The third (bullish) candle shows the market shifting direction, with buyers taking control and pushing the price higher (showing renewed optimism, indicating that the selling pressure has likely been exhausted).
The simple meaning behind the Morning Star pattern is that it shows a market transition, where bears lose their dominance and bulls take over.
In your trading strategy, this signal indicates it’s time to buy when the trend changes direction.
How to Trade the Morning Star Candlestick Pattern?
The Morning Star pattern can offer high-probability trade setups when used correctly, and the steps to effectively trade this pattern read as follows:
1. Find the right Morning Star Candlestick Pattern Setup
Before trading the Morning Star pattern, you need to identify the right setup-weaker constructs can pay dividends, but the best Morning Star candlestick signals typically appear in the following scenarios:
- After a downtrend: The pattern is most reliable when it forms at the bottom of a downtrend, as this indicates that the selling pressure may be losing momentum and a bullish reversal is imminent.
- At key support levels: If the pattern forms near a significant support level (such as a previous low, a trendline, or a moving average), the likelihood of a reversal increases.
- Confluence with other indicators: To improve the reliability of the Morning Star, look for confirmation from other technical indicators, such as oversold conditions on RSI, bullish divergence on MACD, or a bounce off a key Fibonacci level.
For example, imagine a price chart showing a downtrend and the price reaches a strong support level, such as the 50-period moving average.

If you spot a Morning Star pattern forming after the price touches this support level, it’s a strong indication that the trend might reverse.
2. When does the Morning Star Pattern occur?
The Morning Star pattern typically occurs after a prolonged downtrend, signalling a potential reversal. It often appears at the bottom of a price decline, indicating that the sellers’ momentum is slowing down and that buyers are beginning to take control.
This pattern is more reliable when it appears near support levels or after a strong sell-off, as it indicates the market is poised for a potential rally.

It’s important to consider the overall market conditions when the pattern forms: if the trend leading up to the pattern is a steep, prolonged downtrend, the probability of a successful reversal is higher.
3. How is a Morning Star Pattern Formed?
A Morning Star pattern is formed in three distinct steps:
- The initial candlestick is large and bearish, confirming the downtrend.
- The second candlestick is a small body, indicating indecision or market consolidation (it can be a Doji or an engulfing candlestick, often occurring as a gap down).
- The third and final candlestick is a large bullish candle that closes well above the midpoint of the first candle, signalling a change in market sentiment and suggesting the beginning of an uptrend.
4. Wait for the appearance of the Morning Star
Once you’ve found a potential setup, the next step is to wait for the Morning Star to appear. Look for the following:
- First candlestick: The first candlestick should be a long bearish candlestick, indicating that the downtrend is still in motion.
- Second candlestick (the Star): The second candlestick should be a small-bodied candle, indicating indecision in the market (it can be a doji, a spinning top, or just a small-bodied candle(, and the most important feature of this candle is the gap that shows the shift in market momentum.
- Third candlestick: The third candlestick should be a long bullish candlestick that closes well above the midpoint of the first candlestick, confirming the bullish reversal.

It’s crucial not to enter the trade at the formation of the first or second candlestick, but instead to wait for the third candle to appear and close, confirming the reversal.
5. Choose your take-profit (the goal of the setup)
Once you’ve identified and confirmed a Morning Star pattern, it’s essential to set realistic profit targets:
- Previous resistance: A common strategy is to place your take-profit target at the previous resistance level or swing high. This provides a logical target for price action to reach before encountering more selling pressure.
- Risk-reward ratio. Aim for a risk-to-reward ratio of at least 1:2, meaning that your target profit should be at least twice the size of your stop loss.
- Fibonacci retracement levels: You can also use Fibonacci retracement levels to identify potential take-profit areas, especially if the Morning Star pattern occurs at a key Fibonacci level.

6. Open your Trade – Entry Point/Stop-loss/Position Size
After the confirmation of the third candlestick in the Morning Star pattern, you’re ready to enter the trade and set up your entry and stop-loss:
- Entry point: The entry point is typically just above the high of the third candlestick (the bullish candlestick), as this confirms that the reversal is underway and that the bullish momentum is likely to continue.
- Stop-loss: Set your stop loss below the low of the second candlestick (the star) to ensure that you’re protected in case the market reverses again.
- Position size: Use proper risk management to determine your position size, remembering the common rule to risk no more than 2% of your trading capital per trade.

For example, if the high of the third candlestick is at 1.3000, and the low of the second candlestick is at 1.2950, you would enter the trade at 1.3005, aiming for a target at 1.3100, and place a stop loss at 1.2940 to limit potential losses.
(Learn To Trade And Read Candlestick Patterns Like A Pro)
What are the Pros and Cons of Trading the Morning Star Pattern?
When it comes to chart patterns, it is important to know all the advantages and disadvantages and to weigh them against each other.
Pros
- Reliable reversal indicator
- Clear entry and exit points
- Works on multiple timeframes
Cons
- Risk of false signals
- Requires confirmation
- Market conditions matter
Pros of the Morning Star
The Morning Star is a strong signal for bullish reversals, especially when combined with other indicators. This three-candle formation provides clear guidelines for where to enter and exit trades, making it easier for you to make decisions. The pattern can be used on any timeframe, from daily to hourly charts, depending on your preferences.
Cons of the Morning Star
Like any candlestick pattern, the Morning Star can produce false signals, especially if the market doesn’t fully reverse (or if the pattern forms in a weak trend). The Candlestick pattern is most reliable when combined with other technical analysis tools, such as trendlines, support levels, or momentum indicators. This pattern is less effective in range-bound or sideways markets-it works best in trending markets where a clear shift in sentiment is likely.
What is the Hit Rate of the Morning Star Pattern?
On average, the success rate of the Morning Star pattern can range between 52-75% when combined with additional technical analysis tools like RSI, MACD, or volume analysis.

A study by Thomas Bulkowski (the author of Encyclopedia of Chart Patterns) found that the Morning Star has an average success rate of about 72% when used in conjunction with other technical indicators and patterns.
You’ll find that the success rate of the Morning Star pattern varies depending on several factors, such as the strength of the preceding downtrend, the location of the pattern (if it forms near key support levels), and the use of confirmation indicators
Can the Morning Star Pattern give False Signals?
Yes, like all candlestick patterns, the Morning Star can fizzle out, and some common reasons for failure include:
- Weak market conditions: If the market is in a strong downtrend with no sign of reversal, the Morning Star pattern may not be reliable.
- No follow-through: If the bullish momentum does not continue after the third candlestick, the pattern could fail.
- False breakout: If the price breaks above the third candlestick but then reverses, this could indicate a false breakout and a failed pattern.
You should always use stop losses and risk management strategies to protect your capital in case of a failure-no signal or indicator is ever a guarantee of success.
What are the Limitations of the Morning Star Pattern?
While the Morning Star pattern is a powerful signal, there are several limitations you should be aware of:
- False signals: If the pattern appears in the middle of a downtrend or in weak markets, it may produce false signals, hence it’s important to wait for confirmation (such as a breakout above resistance) before acting on the pattern.
- Market context: The pattern is more reliable when it occurs after a prolonged downtrend and near key support levels (if it appears in an uptrend or during sideways movement, the chances of failure increase).
- Volume considerations: The Morning Star pattern is more effective when accompanied by higher trading volumes in the third (bullish) candle, confirming the shift in sentiment.
Possible Strategies for the Morning Star Candlestick Pattern
Several strategies can be used to enhance the effectiveness of the Morning Star pattern:
- Breakout strategy: After the Morning Star pattern confirms, wait for a breakout above the high of the third candlestick and then enter the trade.
- Support and Resistance strategy: Use the Morning Star pattern near key support levels, and place your stop loss just below the low of the second candlestick.
- Momentum indicators: Use indicators like RSI or MACD to confirm the reversal-for example, a bullish crossover in MACD combined with the Morning Star can provide additional confirmation of a shift in progress.

Alternatives to the Morning Star Pattern
While the Morning Star is a great bullish reversal pattern, there are other candlestick patterns that you can use to signal similar market behavior.
The Hammer (and Inverted Hammer) is a candlestick with a small body at the top of the price range, a long lower shadow, and little to no upper shadow.
It too suggests a reversal from a downtrend to an uptrend, and similarly the Inverted Hammer (with a long upper shadow and a small body at the bottom) can indicate a reversal from a downtrend to an uptrend as well.
Hammers can often be found at the bottom of a downtrend, signaling a potential reversal to the upside. Find more alternatives in our all candlestick patterns PDF.
Hammer Candlestick vs. Morning Star
The Hammer (and Inverted Hammer) is a candlestick with a small body at the top of the price range, a long lower shadow, and little to no upper shadow.

It too suggests a reversal from a downtrend to an uptrend, and similarly the Inverted Hammer (with a long upper shadow and a small body at the bottom) can indicate a reversal from a downtrend to an uptrend as well.
Hammers can often be found at the bottom of a downtrend, signaling a potential reversal to the upside.
Morning Star vs. Evening Star Pattern
Note that the Morning Star and Evening Star are essentially opposites:
- Morning Star: A bullish reversal pattern that appears after a downtrend, signaling the potential for an upward move.
- Evening Star: A bearish reversal pattern that forms after an uptrend, in its turn signaling a potential downturn.
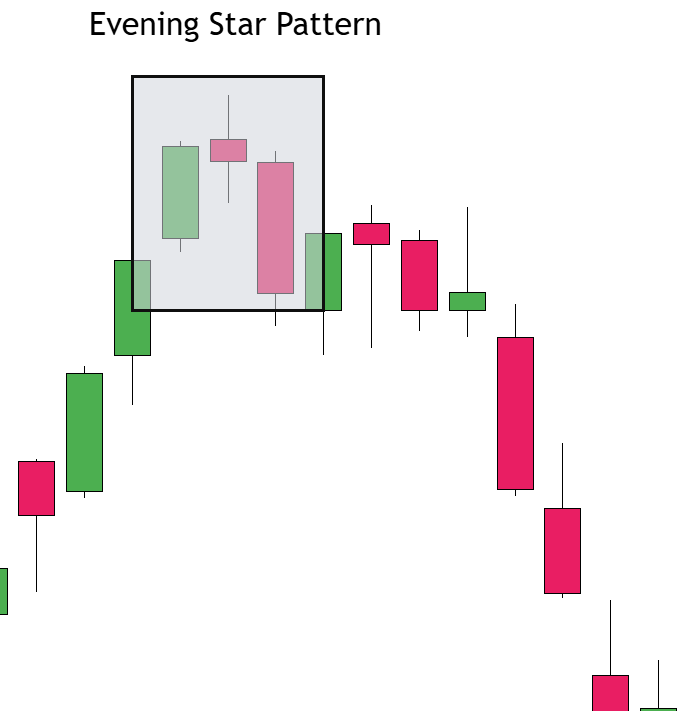
Both patterns are made up of three candlesticks, but they signal opposing trend directions.
Learn Pattern Trading with WR Trading Mentoring
For those looking to master candlestick patterns and trading strategies, WR Trading Mentoring offers the kind of personalized coaching that leads to profitability.
The program will help you understand market dynamics, manage risk, and trade with confidence.
It’s one of the truths of the trading game that whether you’re a beginner or an experienced trader, mentoring can significantly accelerate your learning curve.
(Learn To Trade And Read Candlestick Patterns Like A Pro)
Conclusion: The Morning Star remains a Profitable Candlestick Pattern
The Morning Star candlestick pattern is a valuable and comparatively reliable tool when you’re looking to identify potential bullish reversals, especially when it forms at key points and is corroborated by other indicators.
When combined with proper risk management, additional confirmation, and a well planned trading strategy, the Morning Star pattern can be a highly profitable setup.
By understanding its structure, how to trade it, and being aware of its limitations, you can effectively employ the Morning Star to more successfully and regularly capitalize on market reversals, improving your overall trading performance in the process.
Frequently Asked Questions on Morning Star Candlestick Patterns:
What is the difference between a Morning Star and a Bullish Engulfing pattern?
The Morning Star pattern consists of three candlesticks, while the Bullish Engulfing pattern consists of only two. The Bullish Engulfing pattern is a single-candle reversal formation, whereas the Morning Star is composed of a slightly more complex structure that makes for a clearer indication of trend reversal.
How reliable is the Morning Star pattern in volatile markets?
In volatile markets, the Morning Star can be less reliable because of course price fluctuations might cause false signals. With that said, you can still employ it successfully as long as you wait for additional confirmation from other indicators before entering a trade in volatile conditions.
Can the Morning Star pattern be used for short-term trading?
Yes, the Morning Star can be applied to any timeframe, including short-term trading. However, higher timeframes (like 4-hour or daily) generally provide more reliable signals.
What are the best indicators to confirm a Morning Star pattern?
Indicators like the RSI (showing oversold conditions), MACD (showing bullish divergence), and volume analysis can provide confirmation when you’re trading the Morning Star pattern.
Is the Morning Star pattern’s strike rate sufficient to avoid using stop-loss orders?
No. Although its reliability is pronounced, the Morning Star pattern (like any trading indicator) can give false signals. It’s essential to use stop-loss orders to protect yourself against false signals and market reversals to avoid significant losses.
Can the Morning Star pattern form in uptrends?
By definition, no, because the Morning Star is a reversal pattern that specifically forms after a downtrend. It is not typically seen in uptrends because its role is to signal the end of a bearish move and the beginning of a bullish one-it’s the Evening Star pattern that will signal trading opportunity in an uptrend, showing that the trend might be about to reverse.

