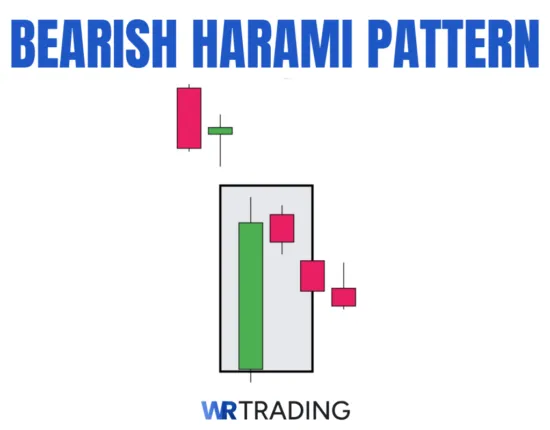
The bearish harami is a two-candlestick reversal formation that typically emerges at the end of an uptrend or during a retracement within a bullish one. It signals the potential beginning of renewed bearish momentum.
Structurally, the harami consists of a huge bullish candle followed by a smaller bearish candle, with the latter engulfed within the body of the first. The pattern is confirmed when the next candle breaks and closes below the low of the previous.
‘Harami’ is a Japanese term that means ‘pregnant’ due to the pattern’s resemblance to a pregnant woman. The bearish harami has a win rate of 53-63% based on research. A rare yet more reliable variation of the pattern exists known as the bearish harami cross, featuring a doji instead of a regular small bearish candle.
In this article, we’ll break down the bearish harami in full detail, looking at how it forms, the meaning behind it and the different ways of trading this formation.
Key Facts of The Bearish Harami Pattern:
- First Candle: Long, big bullish, or red candle (right)
- Second Candle: Fairly large bearish or green candle in the range of the first candle (green)
- Type Of Pattern: Reversal
- Trend Prior The Pattern: Bullish
- Opposite Pattern: Bullish Harami
- Entry Options: Entry after confirmation candle; entry after the second candle in the pattern; retest entry
- Stop-Loss Placement: Above the pattern’s high; above the second candle; above the most recent swing high; ATR-based stop
(Learn To Trade And Read Candlestick Patterns Like A Pro)
Where Does The Bearish Harami Candlestick Pattern Form?
The bearish harami pattern forms in three distinct market environments (in uptrends, downtrends, and range-bound markets) in forex / stocks / indices, etc:
Bearish Harami in an Uptrend
Traders often view this pattern as a hint of a reversal in an uptrend. The smaller bearish candle in the body of the large candle is the first sign of sellers entering the market.
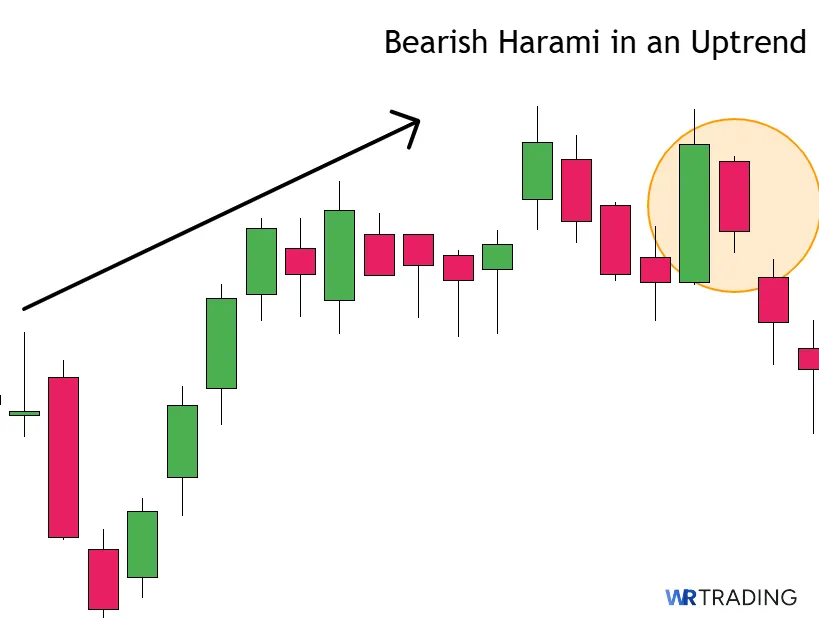
It suggests that bullish enthusiasm is waning, and bears are starting to challenge the prevailing trend. If the next candle closes lower, it strengthens the reversal case and may trigger short entries or profit-taking from longs.
Bearish Harami in a Downtrend
A bearish harami in a downtrend usually serves as a continuation signal. After a short-lived bullish correction, this pattern would indicate the trend is resuming downward.
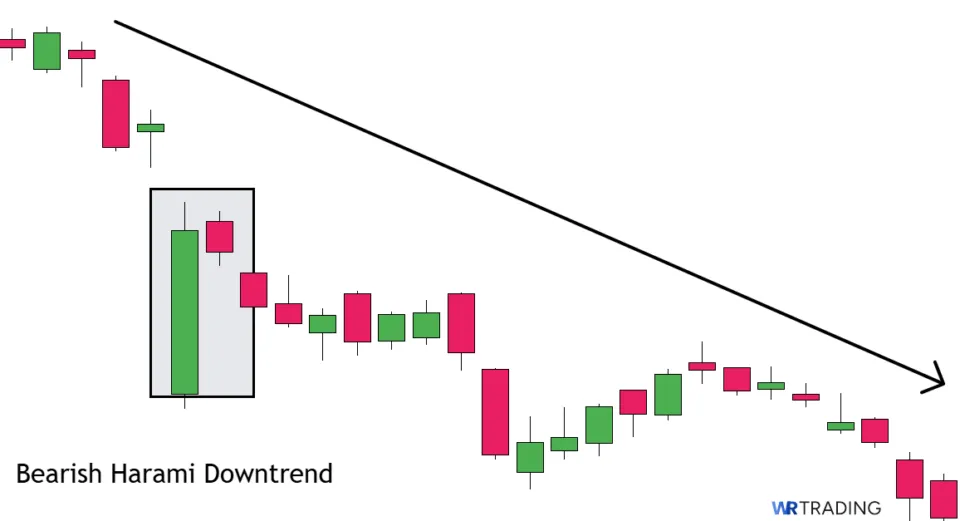
It reflects hesitation from buyers trying to push higher, only to be overwhelmed again by selling pressure. Traders often use this as a cue to rejoin the downtrend or add to existing short positions once a breakdown is confirmed.
Bearish Harami in a Range
This pattern can appear in the upper boundary of a range. Depending on the preceding movement and other factors, the price may bounce back into the range or break out.
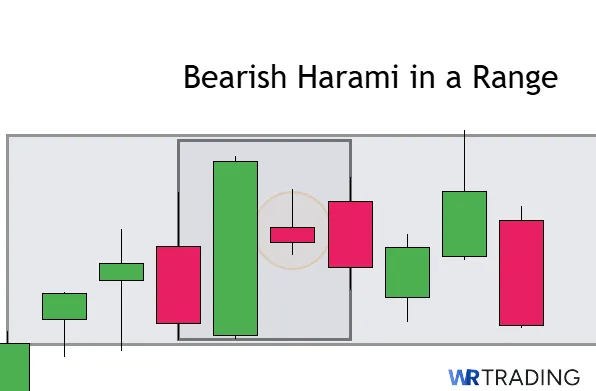
Volume spikes or subsequent bearish candles often help traders decide whether to fade the move or prepare for a larger breakout reversal.
What Is The Psychology Behind The Bearish Harami?
The meaning behind the bearish harami pattern is that bullish momentum is weakening following an optimism peak.
After a period of strong buying, the smaller candle represents a slowing pace of bullish momentum and the presence of a small group of sellers. This period may also represent profit-taking, as buyers are uncertain.
If a bearish candle follows and breaks the pattern’s low, it’s a sign that more sellers have stepped in, and buyers are slowly exiting.
(Learn To Trade And Read Candlestick Patterns Like A Pro)
How to Trade The Bearish Harami
Here are the steps to follow for trading this formation:
- Find the Pattern
- Wait for Appearance
- Open Trade
- Choose Take Profit
1. Find The Right Bearish Harami Setup
The harami should appear at a specific turning point like a resistance level (or major swing high), Fibonacci retracement level, psychological level, moving average, or any combination.
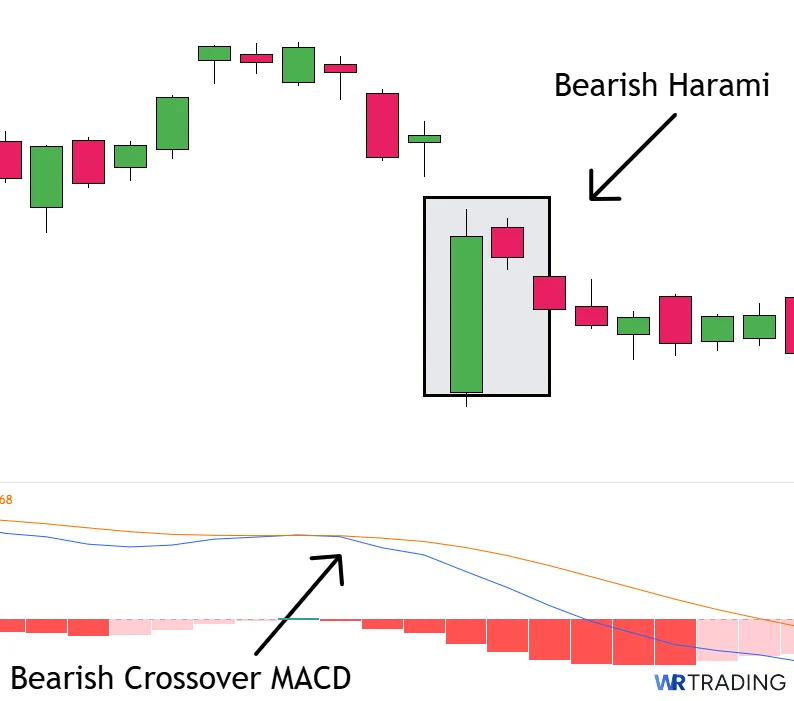
Use indicators for additional confirmation:
- RSI: Look for overbought conditions or a bearish divergence.
- MACD: A bearish crossover supports the setup.
- Bollinger Bands: A pattern forming near the upper band adds weight.
- Volume: Reduced volume on the first candle and rising volume on the second hints at growing selling interest.
2. Wait For The Appearance Of The Bearish Harami
It’s essential that the bearish candle fits entirely inside the body of the bullish candle.
Let’s look at a real-life example of the bearish harami.
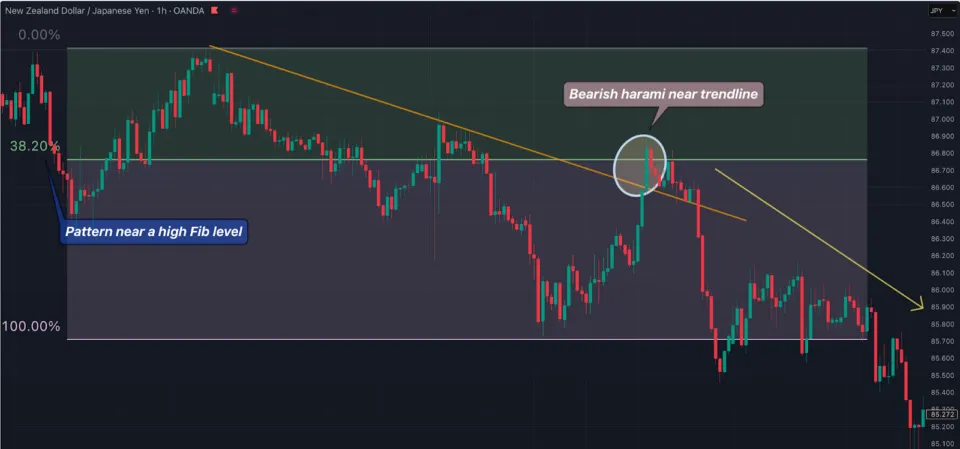
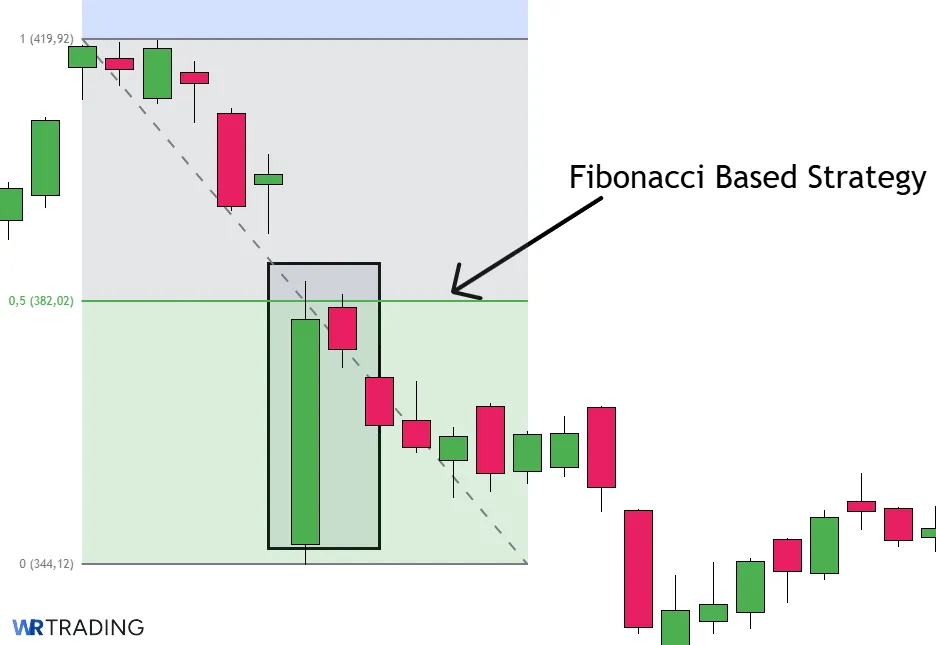
The first is on the 1HR chart of NZD/JPY, where we have a bearish trend. Here, the bearish harami forms near a trend line break. This suggests that, while it would have appeared a new trend had occurred, the trend was likely to continue.
Another solid confluence is the Fibonacci, specifically the 38.2% level. Markets can retrace at any point on the Fibonacci. However, the higher the pullback, the better. This is because a trader has a greater target to aim for when the price moves in the expected direction. It also sometimes means you can have a tighter stop, depending on the length of the move.
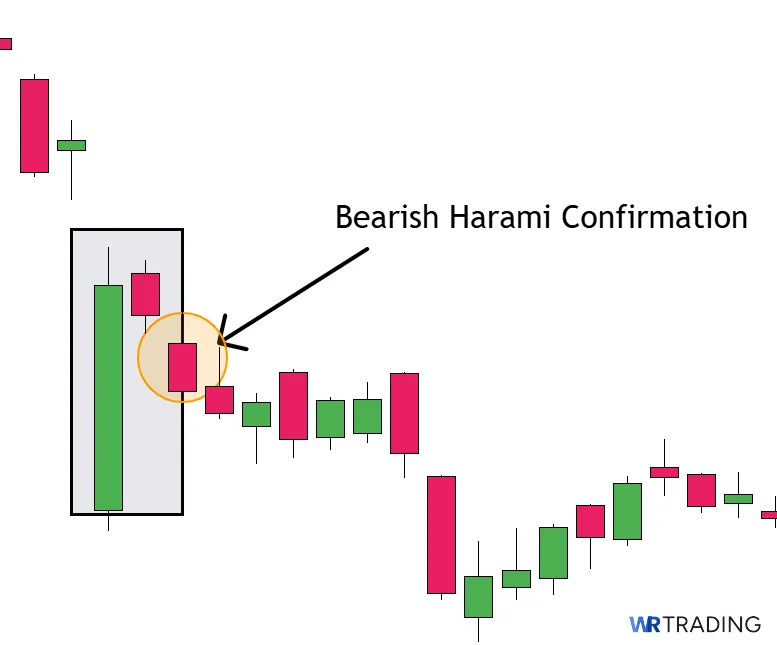
Something else worth noting when waiting for the harami to appear is the confirmation bar or the candle that occurs afterward. It is a more reliable sign when the candle is bearish, reducing the likelihood of a false signal. Let’s examine the daily chart of XRP (a reversal setup) for illustration.
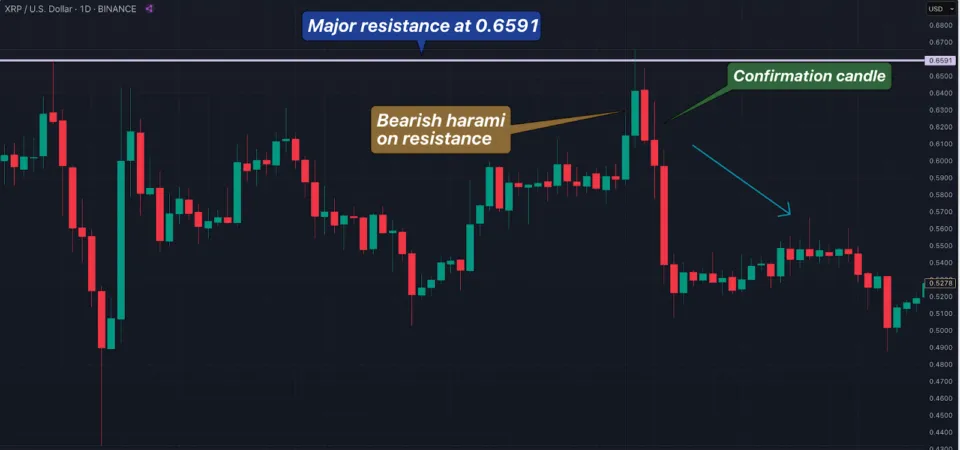
Here, we have the bearish harami show perfectly on the resistance at 0.6591. However, notice the candle afterwards: a bearish hammer. Entry into this setup should ideally have occurred after this point, as it’s a conservative approach.
Of course, some traders may opt for a riskier, early approach, depending on their confidence in the position or other indications.
3. Open The Trade – Entry Point (Setup Up Stop Loss / Position Size)
To open a trade, the trader can wait for the confirmation candle or opt for the aggressive entry. The first method is safer, but it usually doesn’t offer the best risk-to-reward ratio, as you are entering relatively late. Meanwhile, the second option is riskier, but you can gain a tighter stop, increasing your reward potential.
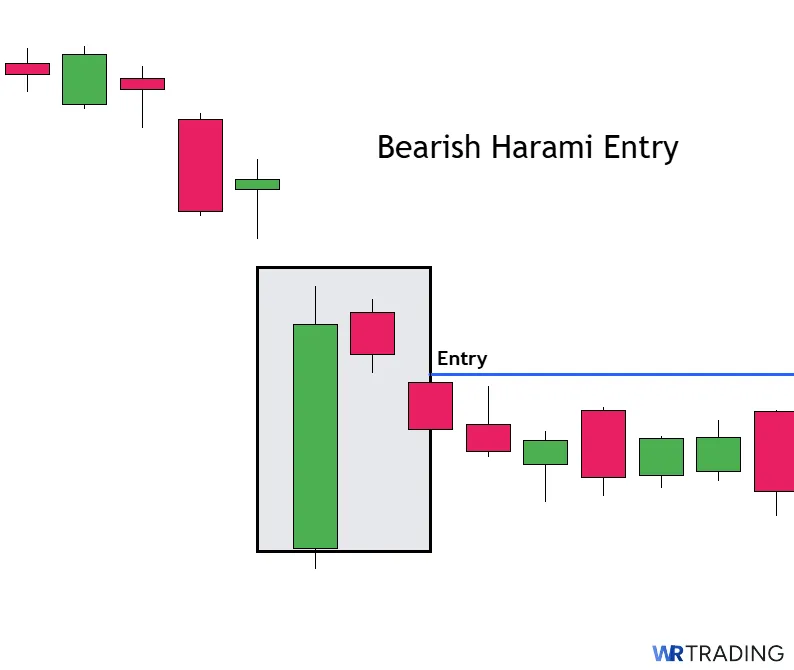
Another method is with the retest entry, which is the best of both worlds. Here, a trader waits for the market to pull back to a specific level within the pattern, once it has formed (such as a Fibonacci level or moving average). It provides an opportunity for a favourable risk-to-reward ratio. However, there is always a chance of missing the move.
Now, let’s get into other various stop loss placement methods:
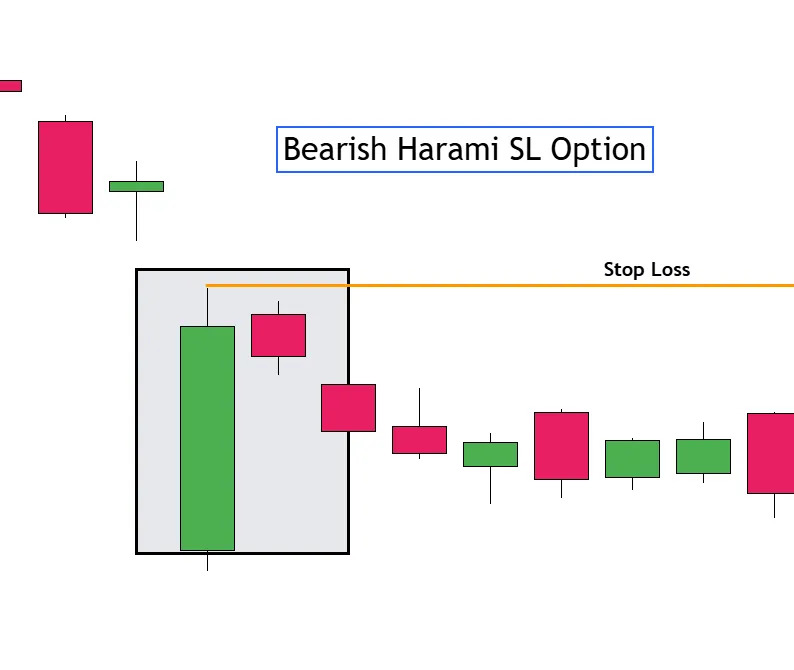
1. Above the High of the First Candle
- How it works: Set the stop somewhere above the high of the larger (first) bullish candle. It’s ideal for all types of entries.
- Why it’s effective: Invalidates the pattern if price pushes above the high, signalling potential continuation of the prior uptrend.
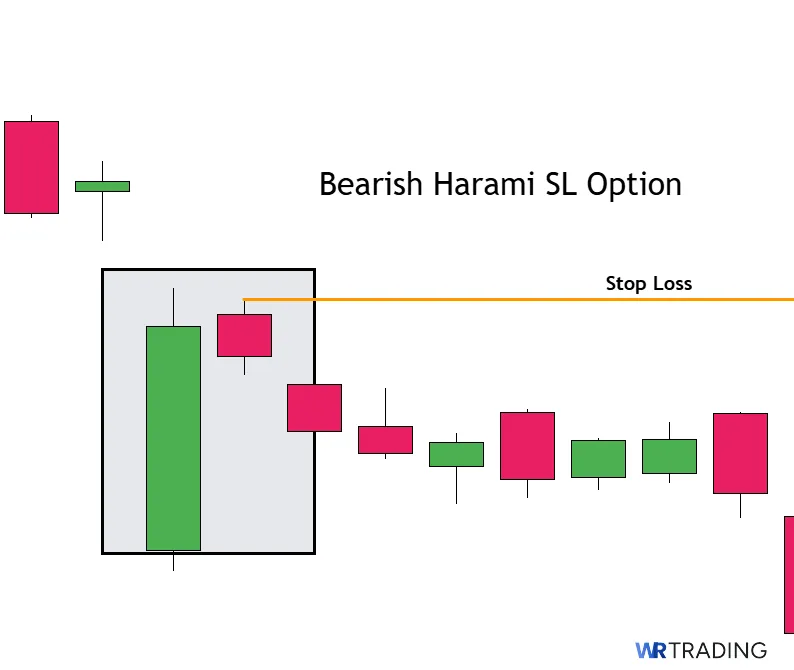
2. Above the High of the Second Candle
- How it works: Set the stop somewhere above the second candle of the harami. This is a less conservative approach (as the chances of getting kicked out by intraday noise are present), suitable for traders seeking the tightest stop.
- Why it’s effective: It’s ideal for scalpers or day traders seeking quick entries with low risk and high reward potential.
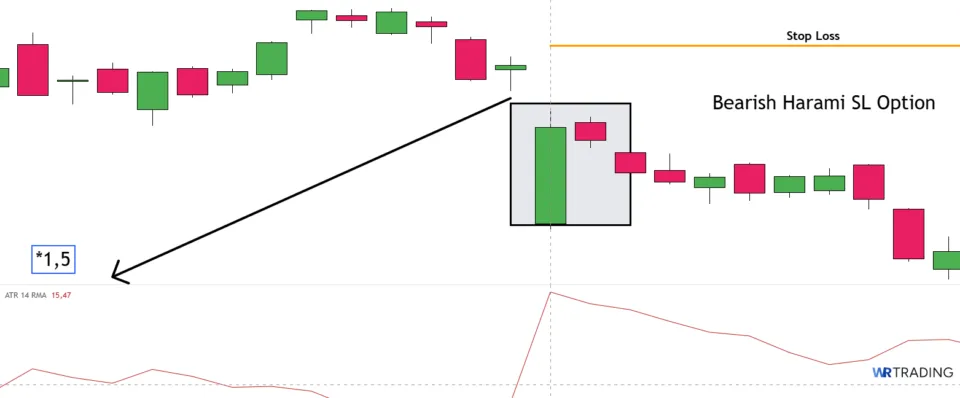
3. ATR-Based Stop
- How it works: Use the Average True Range (ATR) to place the stop a fixed multiple above the high (e.g., 1.5x ATR).
- Why it’s effective: Adjusts to current market volatility, giving trades breathing room without being arbitrary.
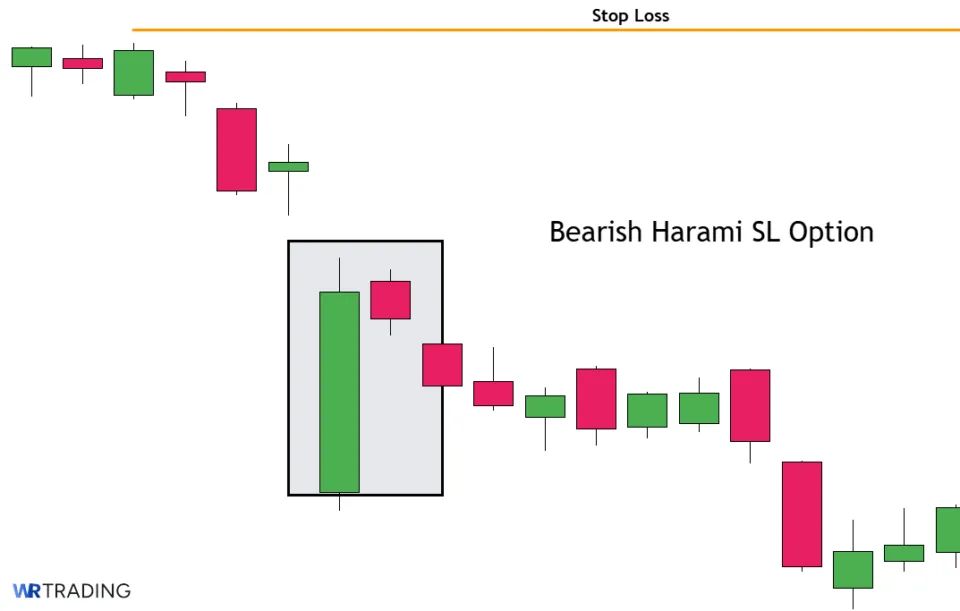
4. Structure-Based Stop
- How it works: Place the stop above the most recent swing high or resistance level, especially when trading on higher time frames.
- Why it’s effective: Aligns with market structure, reducing the chance of premature exits.
Regardless of the technique chosen, ensure your position size is adjusted to accommodate it and does not exceed 2% of your account equity.
4. Choose The Trading Take Profit (Goal Of The Setup)
Traders have a few options for taking profit with the bearish harami. They should revolve around a major turning point or swing low, usually a support area. This is a natural level where the price will bounce or pull back, making it a viable time to think of exiting with some gains.
Traders can target multiple minor resistances along the trade’s path (which will be demonstrated shortly) or the major one further down the line, depending on their risk-to-reward parameters.
Let’s study a reversal bearish harami trade on the 4HR chart of EUR/GBP
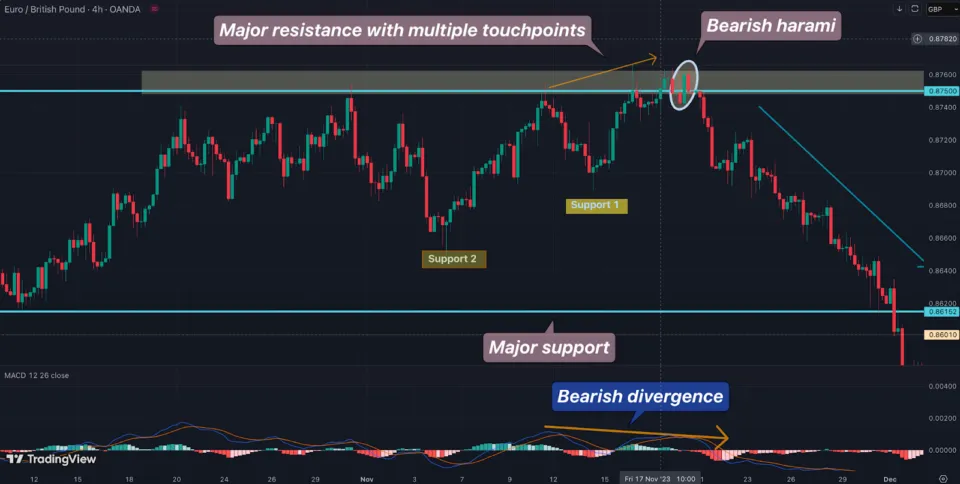
Here, we have a brilliant support level (around 87.500) with multiple touchpoints, i.e., the price hit this area a few times without exceeding it. There are a few candles with long wicks for confirmation.
The second thing to note about this trade is that the bearish harami appeared after a bearish divergence on the MACD (another solid bearish sign).
Notice how the trade travelled towards the major support at 0.86152. This would be the most ambitious target. However, the points marked ‘support 1’ and ‘support 2’ were to be alternate targets, depending on the trader.
Here are other techniques you can use to determine your TP:
- Fibonacci retracement or extension levels
- Closing a trade when a notable reversal signal appears
- Exiting on oversold conditions (e.g., using the RSI, MACD or stochastics)
- Using moving average crossovers to exit your position
Finally, another consideration is the hands-on trade management. Some traders may utilise a trailing stop to secure profits at pre-determined levels. The key here is to give enough ‘breathing room’ for your stops to prevent premature exits.
Also, other traders could scale out or take partial profits when trading the bearish harami. Using horizontal levels, such as support and Fibonacci, can help in this regard.
(Learn To Trade And Read Candlestick Patterns Like A Pro)
What Are The Pros And Cons Of Trading The Bearish Harami Pattern?
Some advantages of the bearish harami include its ability to signal a reversal, simple visual structure and use across different time frames. Conversely, the downsides revolve around the pattern not being foolproof and the potential for fakeouts
Let’s look at each of them in deeper detail.
Pros
- Provides early warning of a potential trend reversal
- Simple to identify visually
- Works across multiple timeframes
- Clear, defined risk management
Cons
- Does not guarantee a reversal or continuation
- Heavily dependent on context
- Possibility of Fakeouts
Pros
The pattern signals that bullish momentum may be weakening, giving traders a heads-up of a potential reversal. This helps them exit from buy positions or prepare to go short in anticipation of the new trend. The bearish harami consists of only two candles and is easy to spot. Hence, it’s a setup all traders can utilise, especially those seeking a quick reversal formation.
Traders can use this pattern in intraday charts as well as on higher time frames. So, it’s suitable for all traders: scalpers, day traders, swing traders, and position traders. Since the pattern has a clear high point (typically the high of the first candle), it provides an obvious place to set a stop-loss. Thus, a trader’s risk-to-reward calculations are more precise.
Cons
While it shows possible bearish intent, no amount of signals can always confirm a legit swing low which moves substantially. Like many chart patterns, the bearish harami requires context and numerous confirmation factors to decrease its failure rate.
As with tons of other chart patterns, traders may be trapped by false breakouts. The price can briefly dip below the harami’s low and quickly shoot up and break its high.
How Accurate Is The Bearish Harami Pattern?
Two comprehensive studies, by Thomas Bulkowski and the Department of Economics at Hong Kong Baptist University, indicate success rates of 53% and 63%, respectively. This isn’t far off with the general accuracy of trading (50%), where the price can only move in two directions.
However, the bearish harami is naturally a less reliable pattern since it doesn’t have the same level of confirmation compared to other multiple bar setups (e.g., three candles, four candles). Ultimately, it takes more than the harami to witness a turning point in the markets.
This leads us to see how we can improve this formation’s hit rate:
- Higher time frames should be used as they contain less ‘noise.’ While decreasing the frequency, it is this rarity that is likely to make them more effective.
- Study the momentum or volume of the small candle, ensuring it is as high or greater than the last few of the bullish candles preceding it.
- Consider trading the harami in high-liquidity sessions instead of lower ones, where moves are more random. Also, avoid participating a few hours before, during and after high-impact economic events.
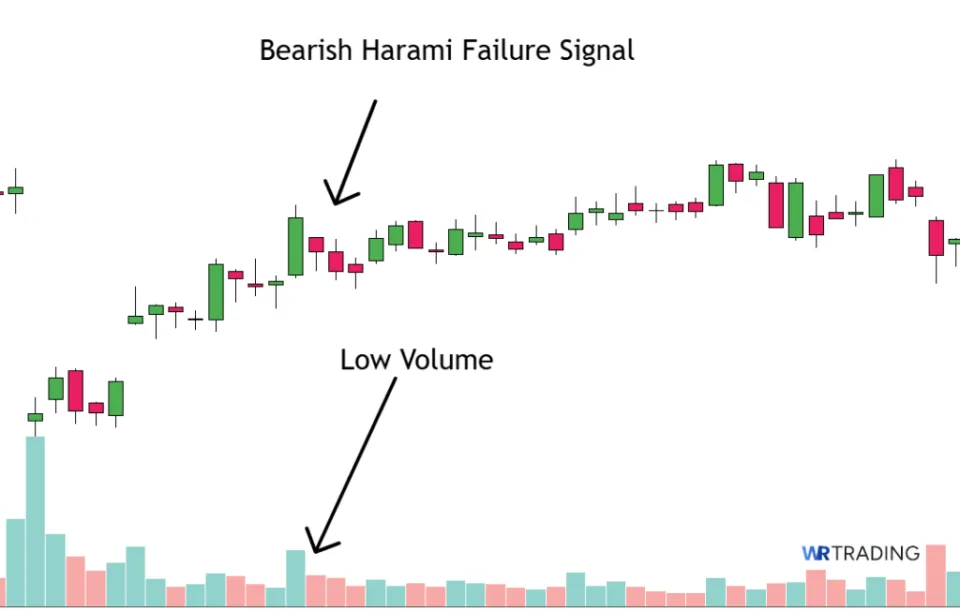
Can The Bearish Harami Pattern Have Failure Signals?
Yes, the bearish harami has plenty of failure signals, usually for the following reasons:
- Weak confirmation (a lack of follow-through invalidates the setup)
- Too strong of an uptrend due to an overwhelming bullish market or sentiment
- Poor placement on the chart (haramis, which form at random places or in sideways markets, are far less effective)
- Low volume or momentum during the pattern
(Learn To Trade And Read Candlestick Patterns Like A Pro)
Possible Strategies For The Bearish Harami Candlestick Pattern
Below are simple strategies that apply to the bearish harami:
- Confirmation Entry Strategy
- Break of Support Strategy
- Trend Reversal Strategy
- Indicator-Based Trend Strategies
Confirmation Entry Strategy
Here, a trader waits for the candle following the bearish harami to close below the pattern’s low before going short. A trader can place their stop loss at or beyond the high of the entire pattern’s high or, for a more aggressive approach, above the harami’s high.
Break of Support Strategy
This strategy revolves around combining the harami with nearby support zones. If price breaks a key support level after the harami forms, it can signal strong bearish momentum, making it a good point for entry.
Trend Reversal Strategy
You can use the bearish harami at the top of an extended uptrend. Look for other signs of exhaustion (e.g., overbought RSI or bearish divergence) to increase the likelihood of a reversal trade setup.
Indicator-Based Trend Strategies
There are several indicators which traders can use with the bearish harami:
You can apply Fibonacci retracement levels to the prior bearish leg and trade the pattern when it aligns with a 61.8% or 78.6% retracement zone. Moving averages (like the 50- or 200-period MA) can act as dynamic resistance. You would simply seek the harami near or below one of these as a sign of price rejection.
What Are The Alternatives To The Bearish Harami?
Here are the different interesting variations traders can choose:
- Harami cross: This is the harami with a doji (a very tiny-bodied candle that looks like a cross with identical open and close prices) next to the larger candle..
Dojis have rare appearances (more so in a two-bar structure), making the harami cross a distinct, significant pattern.
- Dark cloud cover: This two-candle formation involves a strong bullish candle and a second candle that opens above the previous close but closes below the midpoint of the first.
- Evening star: This three-candle pattern consists of a bullish candle, a small cross-like candle just above it and then a bearish candle. Generally, three-bar setups are more reliable than two-bar ones like the bearish harami.
- Three black crows: Here is another powerful three-bar setup with three consecutive long bearish candles, each closing lower than the last.
With our trading candlestick patterns PDF, you can find more alternatives for free.
What is the Difference Between the Bearish Harami and Bullish Harami?
Lastly, we have the bullish harami, the direct opposite to the bearish harami. Here are the differences between the two:
| Feature | Bearish Harami | Bullish Harami |
|---|---|---|
| Market setting | Occurs towards the end of an uptrend or a retracement from a bearish trend | Appears near the end of a downtrend or a pullback from a bullish trend |
| First candle | Large bullish candle | Large bearish candle |
| Second candle | Small bearish candle | Small bullish candle |
| Signal type | Potential bearish reversal or bearish trend continuation | Potential bullish reversal or bullish trend continuation |
| Reliability | Medium | Medium |
| Strong variations | Bearish harami cross, bullish engulfing, morning star, morning star doji | Bullish harami cross, bearish engulfing, evening star, evening star doji |
| Risk management tips | Stop above harami high | Stop below harami low |
Learn Pattern Trading With The WR Trading Mentoring
WR Trading offers expert advice on navigating various market patterns effectively. However, we also understand that success goes beyond knowing a few chart formations.
Knowing when (and when not to) to trade, excellent risk-to-reward analysis, low time commitment and building solid trading plans are all areas covered in our mentorship program. The latter is designed for all traders seeking to take their trading to the next level.
(Learn To Trade And Read Candlestick Patterns Like A Pro)
Conclusion: Trading Smarter with the Bearish Harami
While the bearish harami is a simple and subtle pattern, it can become a powerful turning point signal. Whether it appears at the end of an uptrend or as a retracement swing in a downtrend, traders can use it to form strong trade setups.
Of course, these should be backed by the many confluent aspects discussed here, along with solid risk management. Ultimately, the bearish harami isn’t foolproof, something backed by data.
Regardless, the pattern still boasts a decent win rate. Still, timing, context, and confirmation are essential to improve accuracy. Alternatively, traders can consider similar setups like the bearish harami cross and evening star, despite having their own trade-offs.
For traders looking to sharpen their technical skills and build solid strategies around chart patterns like the bearish harami, WR Trading Mentoring offers the guidance needed to move from basic recognition to professional-level execution.
FAQs: Most Frequently asked Questions on Bearish Harami Candlestick
What is the Bearish Harami Candlestick Pattern?
The bearish harami is a two-candlestick reversal formation that typically emerges at the end of an uptrend or during a retracement within a bullish one. It signals the potential beginning of renewed bearish momentum.
What is the Psychology behind the Bearish Harami?
The meaning behind the bearish harami pattern is that bullish momentum is weakening following an optimism peak. After a period of strong buying, the smaller candle represents a slowing pace of bullish momentum and the presence of a small group of sellers. This period may also represent profit-taking, as buyers are uncertain
How accurate is the Bearish Harami Candlestick?
The bearish harami has a win rate of 53-63% based on research. A rare yet more reliable variation of the pattern exists known as the bearish harami cross, featuring a doji instead of a regular small bearish candle.