
The bullish harami is a candlestick reversal formation that typically appears at the end of a downtrend or a retracement of a bearish trend that indicates bullish momentum.
The pattern consists of a large bearish candle, which precedes a smaller bullish candle. The second is engulfed in the body of the first. The following candle should surpass the high of the previous two to confirm the harami.
Interestingly, the term ‘harami’ comes from a Japanese word that means ‘pregnant’ due to the pattern’s likeness to a pregnant woman. The bullish harami has a variable success rate of 54-76% based on research. A variation of the bullish harami exists (the harami cross), which appears less often but is more reliable.
Let’s cover this pattern more accurately in this article, including plenty of examples and trading strategies.
Key Facts of the Bullish Harami Pattern:
- First Candle: Long, big bearish, or red candle (left)
- Second Candle: Fairly large bullish or green candle in the range of the first candle (red)
- Type Of Pattern: Reversal
- Trend Prior The Pattern: Bearish
- Opposite Pattern: Bearish Harami
- Entry Options: Entry after confirmation candle; entry after the second candle in the pattern; retest entry
- Stop-Loss Placement: Below mother candle; below harami low; below recent support or swing low
When Does A Bullish Harami Pattern Appear?
As with many patterns, the bullish harami can appear in three situations (in uptrends, downtrends, and sideways markets) in various financial markets like forex / stocks / indices, etc.:
Bullish Harami in an Uptrend
Seeing a bullish harami in an uptrend would be a continuation signal. The market may have experienced a short pullback or consolidation phase, represented by a large bearish candle.
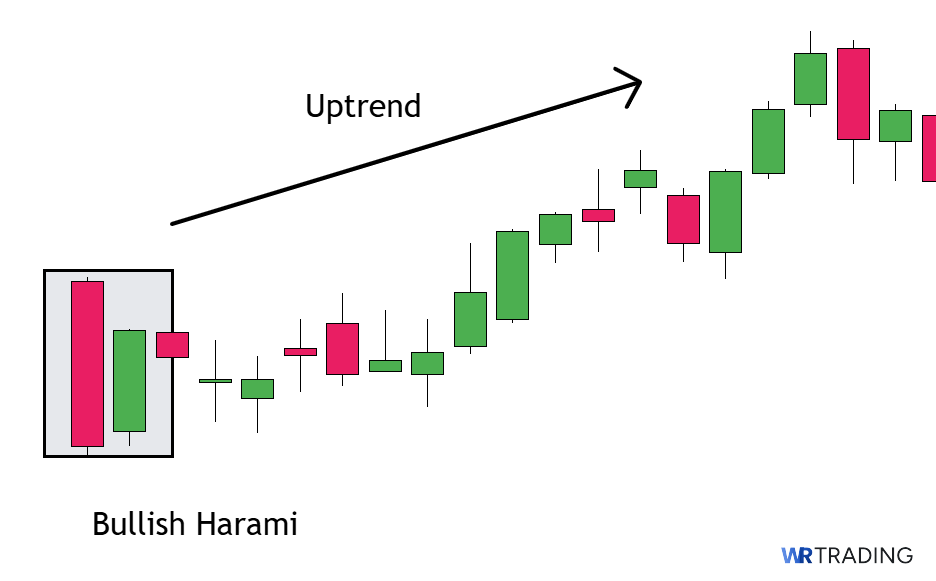
However, the next candle signals that the selling pressure is fading. The assumption is that buyers are still in control. Hence, the trend is likely to make new highs soon.
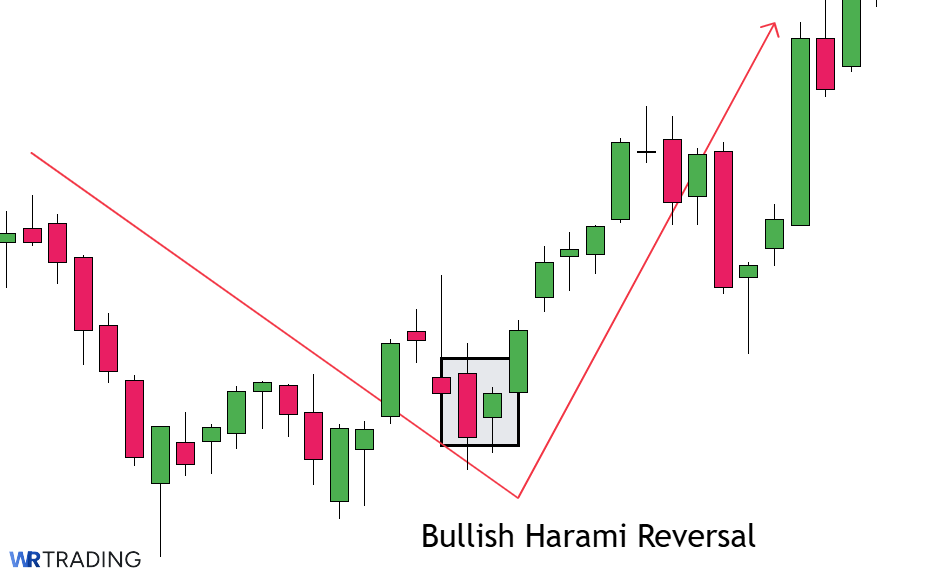
Bullish Harami in a Downtrend
A bullish harami in a downtrend suggests a possible reversal. The large bearish candle shows the dominant selling force, but the smaller inside bullish candle is the first sign that sellers are losing steam.
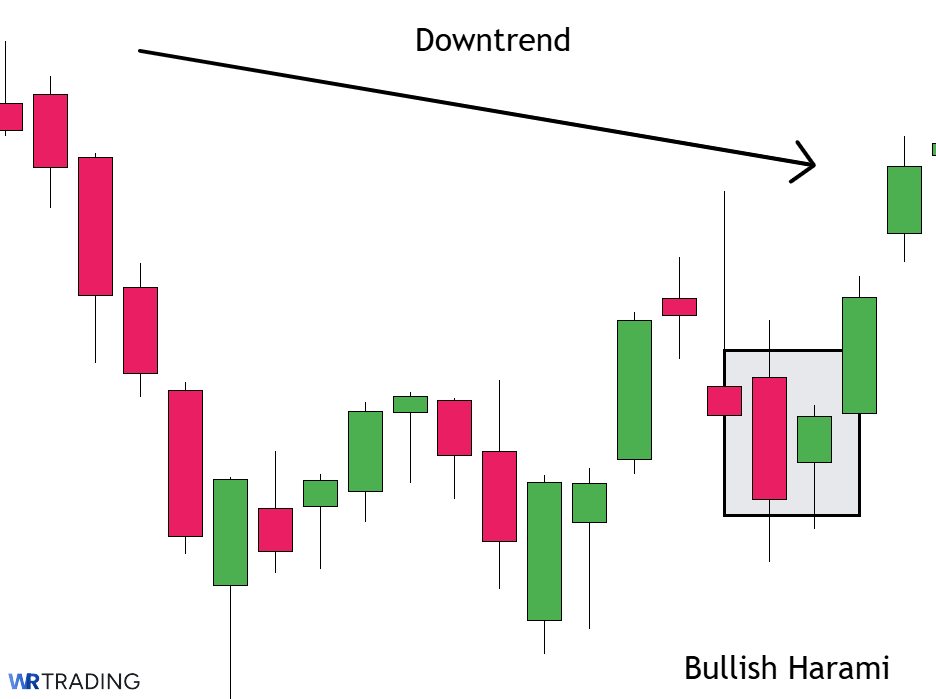
As more buyers step in once the price breaks the pattern’s high, a trend reversal is likely to occur.
Bullish Harami in a Range
This setup typically appears near the lower boundary of a range, where prices have found support multiple times. Here, the pattern suggests that buyers are stepping in to defend the range at this level, increasing the likelihood of a bounce back toward resistance.
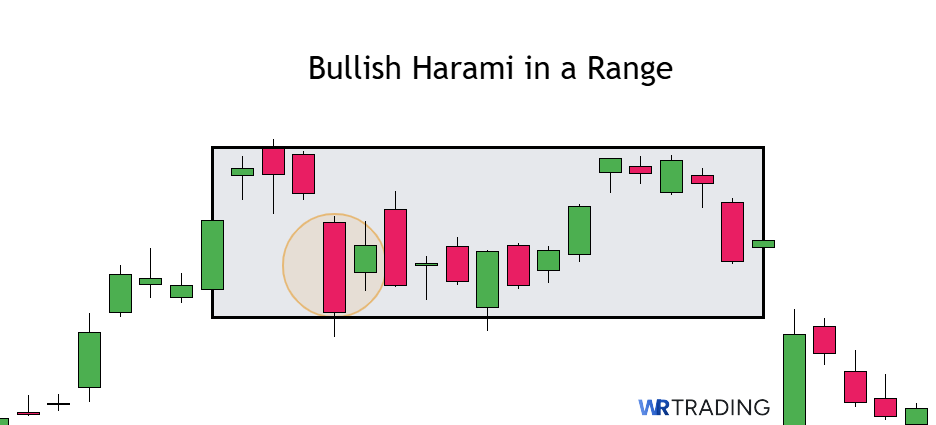
In other cases, the previous trend may continue – so context is key.
What Is The Meaning Of The Bullish Harami Candlestick Pattern?
The bullish harami indicates shifting momentum from bearish to bullish in a particular move. Here, we see mostly red or bearish candles. The appearance of an opposite candle would indicate that the current momentum is slowing down.
This candle is contained in the range of the previous, indicating that the market was strong enough to almost surpass the high of the former. The final piece of this harami setup is the candle that appears afterward, which should be full-bodied and close confidently beyond the previous high. This presents a buying opportunity as a hint of waning selling strength exists.
Psychologically:
- The market is pessimistic, expecting the price to continue moving downwards.
- Eventually, selling pressure starts to fade, with buyers cautiously entering.
- Finally, the complete appearance of the harami means traders see a turning point with buying interest increasing.
How To Trade Bullish Harami Pattern:
Let’s go into detail on how to trade the bullish harami, from finding the right setup to choosing your take profit:
- Find the pefect Setup
- Wait for Appearance
- Open Trade
- Choose Take Profit
1. Find The Right Bullish Harami Candlestick Pattern Setup
The first obvious clue is to see the bullish harami in a strong, well-defined downtrend or a pullback of an uptrend. This should be coupled by a major support zone from a clear previous swing low, Fibonacci retracement level, trend line, moving average, psychological level or other powerful confluence.
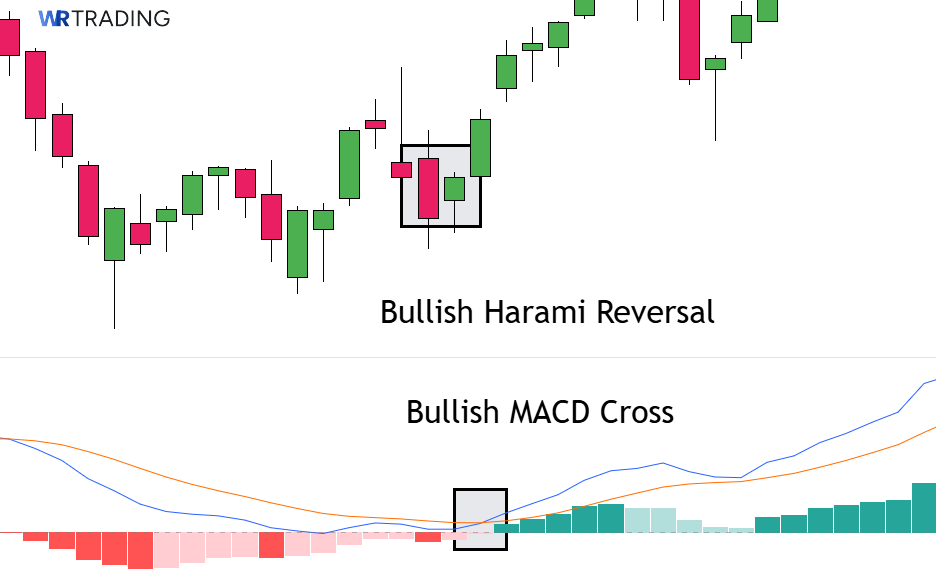
Furthermore, check for additional confirmation signals from technical indicators like:
- RSI (Relative Strength Index): search for a point where the indicator has exited the oversold region, indicating a decrease in bearish momentum.
- MACD (Moving Average Convergence Divergence): a bullish crossover can support the setup.
- Bollinger Bands: If the pattern forms near the lower band, it’s excellent confirmation.
- Volume: a decrease in volume during the first bearish candle and an increase in volume on the bullish candle suggest stronger buyer interest.
2. Wait For The Appearance Of The Bullish Harami
Assuming you have considered the factors above, now it’s time to wait for the harami to appear perfectly. It’s key to ensure that the second bullish candle is completely within the range of the first – close enough isn’t good enough.
Let’s look at some real-world examples of the bullish harami with a few of the aspects already discussed.
The first is on the daily chart of GBP/NZD. Here, we have a bullish harami near the key support at 2.02821. Note how the market moved upwards as it did around the same area before (as marked with the two arrows).

The next illustration is on the weekly chart of oil, which demonstrates the harami as a continuation pattern (as it’s on or near the trendline). Interestingly, there were two of these patterns on or near the latter. This shows us that trend lines can be excellent confirmation factors.

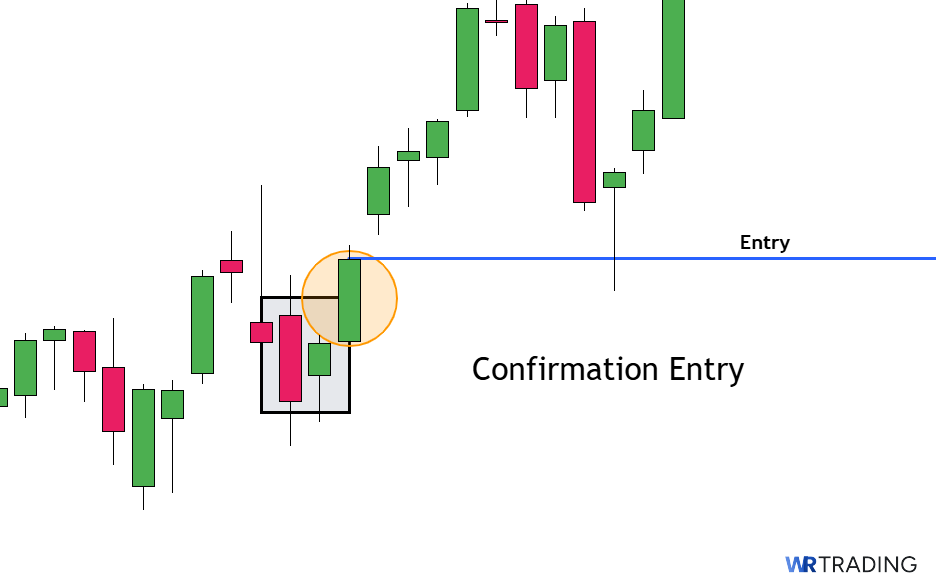
Another crucial component for when the harami has appeared is the confirmation candle/s or the candles that form afterward. Entering this setup soon after it appears is risky, as it may be a false signal.
After the harami’s appearance, you should enter when the next candle or two is a full-bodied green candle. This would indicate buying strength. Let’s check this out with an example.
Below is the 4HR chart for the S&P 500 index in a range-bound market, highlighting a clear support level. Note the first candle after the bullish harami. It’s a fairly large body, but the wick is more compelling due to its notable length.
This indicates greater bullish strength as sellers were unable to push the market to a low. It would have been a great confirmation candle and a great time to enter the trade.

3. Open The Trade – Entry Point (Setup Up Stop Loss / Position Size)
While we have mentioned entering after the confirmation candle. Still, let’s list the main entry and stop loss methods you can use.
- Close Above Harami High: This would be the standard and fairly conservative way to enter this setup. Traders can enter once the price has fully closed above the high of the harami pattern.
- Breakout confirmation entry: Here, you enter as soon as the market breaks above the high of the smaller or second candle in the harami. While providing a better entry, it’s a more aggressive approach due to the higher risk of a false signal.
- Pullback entry: For a less aggressive method, traders can wait for a slight pullback after a bullish candle has closed above the pattern’s high. You may aim for a 50% Fibonacci retracement. Despite being a calculated way, a trader could miss the move if the price doesn’t return.
You can incorporate these techniques with confluence from technical indicators. You should also have a separate plan for placing your stops. Again, traders can choose between conservative and aggressive approaches. They should also ensure their position size aligns with the method chosen and is no more than 2% of their trading capital.
- Below the mother candle: This approach involves a trader placing their stop below the mother candle of the entire pattern, which is a conservative approach.
- Below recent support or swing low: An even more cautious method is to place your stop at the most recent support level or swing low. This usually allows for a larger ‘breathing room,’ greatly reducing premature exits. However, you need to have a wider target to compensate for the risk.
- Below harami low: Here, one places their stop loss below the harami candle. While it offers a tighter stop, it’s more aggressive.
It’s worth noting that traders should use their discretion on how far below their stops should be. This is where an indicator like the Average True Range could be useful. Furthermore, the approach should consider market context. For instance, a tighter stop may be less effective with little volume or momentum.
4. Choose The Trading Take Profit (Goal Of The Setup)
Assuming your trade moves in your favour, you should already have a smart plan to take profits. Traders should aim for somewhere near or at the resistance point. By design, markets stall or pause at support/resistance areas. This would be the perfect time to exit to keep as much profit as possible in case the market turns.
Let’s look at one example on the 4HR chart of GBP/CAD. Here, we have the harami near a point of a trend line break (something alluded to earlier as crucial when identifying the pattern).

Secondly, a notable bullish spinning top was present in the same area, which is often a powerful reversal signal. Most importantly, you should note how the price moved from the harami and reached the major 1.8000 resistance before retracing slightly.
Also, note the minor 1.77500 resistance where the price stalled. The key point is that resistance levels should be considered when determining your take-profit (TP) level.
Other considerations:
- A 1:3 risk-to-reward ratio is recommended.
- Traders can also use Fibonacci to determine take-profit zones.
- You may add a trailing stop or manually trail to lock in profits at pre-determined points, while giving your position enough space to potentially move in your favour. This prevents premature exits.
- Traders using scaling techniques could scale out at a specific point (e.g., when the price exceeds 1:1 of their trade) while leaving the rest for higher levels.
(Learn To Trade And Read Candlestick Patterns Like A Pro)
What Are The Pros And Cons Of Trading The Bullish Harami Pattern?
Below, we break down the key advantages (such as early trend reversal detection and visual clarity) and also highlight some drawbacks, including the risk of fakeouts and the need for confirmation.
Pros
- Early reversal signals
- Visual simplicity
- Defined risk
- Applicable in multiple trading setups and time frames
Cons
- Possibility of Fakeouts
- Decreased Accuracy Rate Than Other Two-Bar Patterns
- Requires More Confirmation:
Pros
Haramis are known to appear at the start of a potential bullish reversal. This can give you early entry opportunities before a major move and improved risk-to-reward ratios. The pattern is easy to spot: just two candles: a large bearish one followed by a smaller bullish candle within its range. It’s a clean setup which is quick to scan on the charts without additional tools.
You can place your stop loss somewhere below the pattern’s low, giving you clear risk parameters. A break below the pattern’s low invalidates the setup, making it straightforward to exit losing trades. The bullish harami is relevant whether you’re trading trends, reversals, range, or breakouts across all time frames.
Cons
Like many chart patterns, traders may be trapped by false breakouts with the harami. Given its common frequency and need for greater confirmation, the bullish harami doesn’t have as high a win rate as other chart formations.
The bullish harami isn’t a solid signal on its own. Thus, it is crucial to examine the candles after the pattern and ensure they are powerful follow-throughs.
What Is The Hit Rate Of The Bullish Harami Pattern?
According to research, the win rate for this formation ranges from 54% to 76%. The reason these win percentages are lower may be due to how relatively common the harami is.
Based on the Encyclopaedia of Candlestick Charts book by Thomas N. Bulkowski, two or three-bar patterns that appear less frequently tend to perform better.
Also, the 54-76% win rate is because two-bar patterns have less inherent confirmation than three-bar patterns. Thus, they are arguably less reliable. Finally, many consider the harami as a ‘pause signal’ instead of a pattern that can generate a key turning point on its own.
That’s why traders should have a more holistic approach to increase the hit rate (in addition to the pointers previously mentioned).
- One credible sign is an increase in volume or momentum in the second candle (compared to the last few bullish candles before it).
- Higher time frames are usually more effective, as chart patterns appear less frequently but are more distinct and meaningful when they do occur.
- Trade the harami on clear support levels (horizontal, Fibonacci, demand zones, etc.).
- Due to the erratic volatility during this time, avoid trading the pattern a few hours before, after, or during high-impact news releases and economic events.
Can The Bullish Harami Pattern Have Failure Signals?
Yes, haramis do fail, as do other chart patterns. Here are the typical scenarios:
No Confirmation Candle
- Failure sign: Price continues downward immediately after the harami pattern.
- Why it fails: Without a strong green close above the harami, there likely is no real shift in sentiment.
- Fix: Wait for a third bullish candle to close above the high of the pattern.
Pattern Forms in a Strong Downtrend
- Failure sign: Harami forms, but price resumes the downtrend quickly.
- Why it fails: In powerful downtrends, minor pauses often look like reversals but are just consolidations before continuation.
- Fix: Use trend strength indicators.
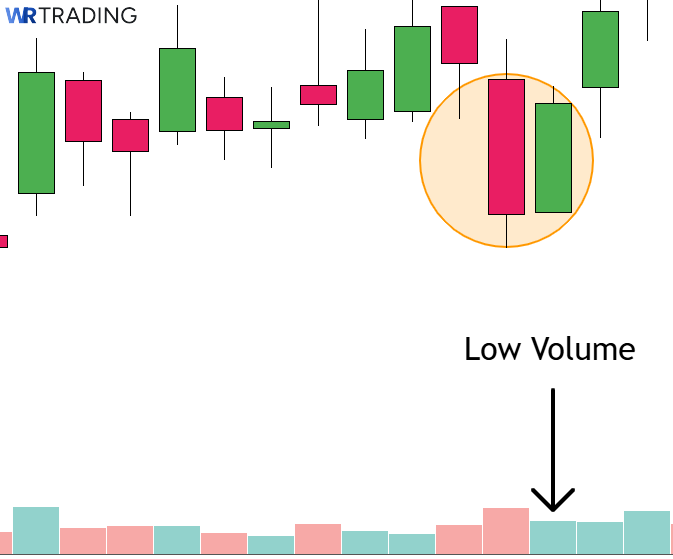
Low Volume or Momentum on the Second Candle
- Failure sign: Second (bullish) candle forms, but with very low volume or momentum.
- Why it fails: Lack of real buying interest or conviction.
- Fix: Look for spikes in volume or momentum on the second and confirmation candle.
No Key Support Zone
- Failure sign: Harami forms in ‘no-man’s land’, areas with no prior support, Fibonacci level, or pivot zone.
- Why it fails: There’s no technical reason for buyers to step in.
- Fix: Combine with support levels, trendlines, or retracement zones.
Bearish Continuation Pattern Forms Right After
- Failure sign: Price forms a bearish flag, pennant, or other bearish formation after the harami.
- Why it fails: Bears regain control quickly.
- Fix: Be cautious if price consolidates bearishly right after the pattern.
Possible Strategies For The Bullish Harami Candlestick Pattern
Here’s a list of effective strategies you can use around the bullish harami to:
Confirmation candle entry strategy
Here, you wait for a bullish candle to form after the pattern. In doing so, the market shows clear intent by breaking above the high of the harami before going long.
A stop-loss is usually placed just below the low of the harami, and targets can be set using nearby resistance zones or similar areas using a minimum 1:3 risk-reward ratio. This method reduces false signals by ensuring momentum is shifting.
Inside bar breakout strategy
This is a classic inside bar breakout play. Entry happens on a breakout above the high of the harami candle, with a stop-loss below the low of the pattern.
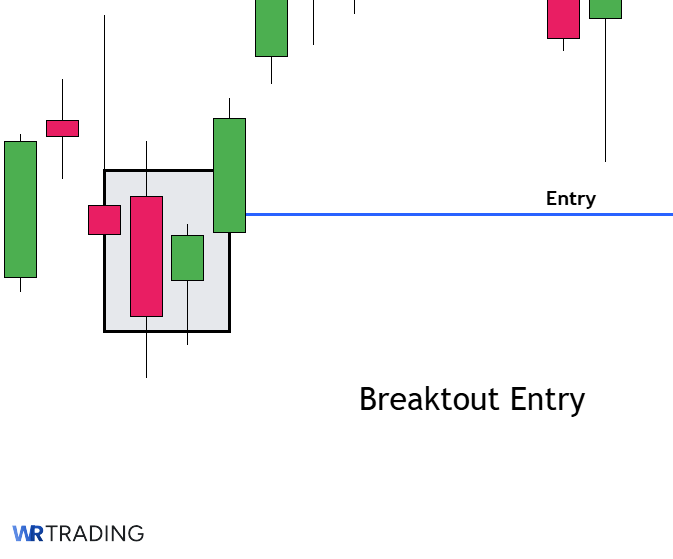
Targets are set based on recent resistance or using a risk-to-reward approach. This technique works well for traders who favour momentum breakouts and want tighter risk management.
Support confluence strategy
Here, traders only take bullish harami signals that occur near key support levels (which we have already mentioned)
When the pattern lines up with one of these supports, the odds of the market bouncing increase. Entry typically happens after a bullish confirmation, and the stop-loss is placed just below the support level or the pattern’s low. Profit targets are often based on prior swing highs or the next resistance levels.
Alternatives To The Bullish Harami Pattern
Traders can also explore a myriad of similar patterns to the bullish harami:
- Harami cross: This is an altered harami where the second candle is a doji, a very tiny-bodied candle that looks like a cross. The open and close prices of dojis are almost identical.
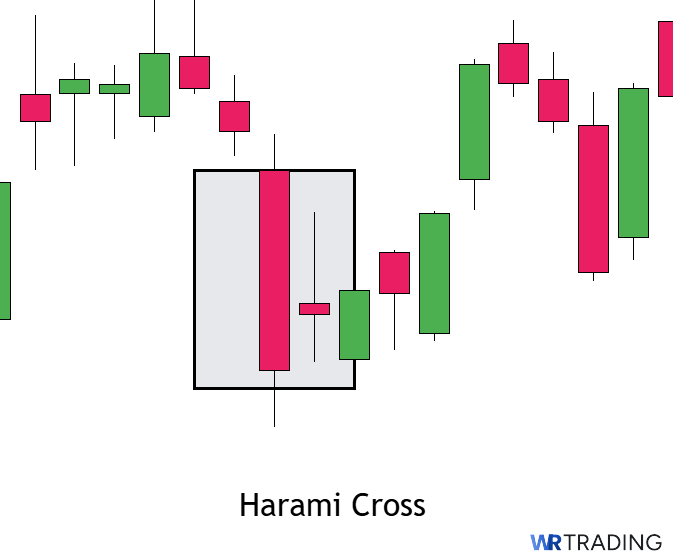
Dojis are widely regarded as indecision candles and rarely appear in a recognised two-bar structure like the harami cross. This makes the latter a distinct pattern with arguably greater significant than the ordinary harami.
- Engulfing: Engulfing patterns occur when a small candle is followed by a large-bodied candle that completely engulfs the previous one. They indicate sudden and massive opposite pressure, meaning they offer more aggressive momentum.
- Morning star: The morning star – or the opposite version, the evening star – is a three-candle pattern. It begins with a bearish candle, a smaller bullish candle in the middle and then a third bullish candle of similar or greater size compared to the first.
The middle candle shows indecision or a slowdown in selling/buying, and the third candle confirms the reversal. Also, there is a doji variation of this setup, as with the harami cross.
Many traders agree that three-bar patterns like the morning/evening star are more reliable than the likes of the harami due to the presence of an extra candle. We recommend you to download our free Candlestick Pattern Bible to find more professional candlestick formations for your needs.
What is the Difference Between the Bearish Harami and Bullish Harami?
Finally, we talk about the bearish harami, the opposite of the bullish harami. Unsurprisingly, everything about the former is identical to the latter, except for being directed in the opposite direction.
Below is a table for comparison:
| Feature | Bullish Harami | Bearish Harami |
|---|---|---|
| Market context | Appears towards the end of a downtrend or a pullback from a bulliish trend | Appears towards the end of an uptrend or a pullback from a bearish trend |
| First candle | Large bearish candle | Large bullish candle |
| Second candle | Small bullish candle | Small bearish candle |
| Signal type | Potential bullish reversal or bullish trend continuation | Potential bearish reversal or bearish trend continuation |
| Reliability | Medium | Medium |
| Strong variations | Bullish harami cross, bullish engulfing, morning star, morning star doji | Bearish harami cross, bearish engulfing, evening star, evening star doji |
| Risk management tips | Stop below harami low | Stop above harami high |
Learn Pattern Trading With The WR Trading Mentoring
Pattern trading is one of the key concepts explored in WR Trading’s excellent mentorship program, which is designed to take traders to the next level. We emphasize high risk-to-reward ratio trading, low time commitment, trading plans, eliminating poor trading opportunities, and finding the best setups.
Our mentoring is meant for all experience levels and is intended to help individuals trade effectively and profitably without spending their entire day in front of a screen.
(Learn To Trade And Read Candlestick Patterns Like A Pro)
Conclusion: Mastering the Harami – What You Should Remember
The bullish harami candlestick pattern is a subtle yet powerful tool in a trader’s arsenal. It quietly signals shifting momentum at the end of downtrends or uptrend pullbacks with growing buyer interest.
When used with proper confirmation techniques and market context, the bullish harami can become a high-probability signal for trend reversals or continuations. This is further evidenced by the setup’s excellent maximum accuracy rate.
However, like any pattern, it is not foolproof. Smart traders combine it with confluence, patience, and risk management. By understanding how it works and employing effective strategies, traders can confidently identify the signs of potential reversals before they fully unfold, gaining a key edge in the market.
And if you’re looking to fast-track your pattern mastery, the WR Trading Mentoring program is an excellent way to go from pattern-spotter to pattern-strategist.
FAQs: Most Frequently asked Questions on Bullish Harami Candlestick
What is the Bullish Harami Candlestick Pattern?
The bullish harami is a candlestick reversal formation that typically appears at the end of a downtrend or a retracement of a bearish trend that indicates bullish momentum. The pattern consists of a large bearish candle, which precedes a smaller bullish candle. The second is engulfed in the body of the first. The following candle should surpass the high of the previous two to confirm the harami.
What is the Psychology behind the Bullish Harami?
The bullish harami indicates shifting momentum from bearish to bullish in a particular move. Here, we see mostly red or bearish candles. The appearance of an opposite candle would indicate that the current momentum is slowing down.
How accurate is the Bullish Harami Candlestick?
The bullish harami has a variable success rate of 54-76% based on research. A variation of the bullish harami exists (the harami cross), which appears less often but is more reliable.

