The Breakaway candlestick pattern is a five-candle reversal formation that appears after a strong directional trend. It signals that the prior move has lost its strength and a shift in control is beginning to show.
The pattern begins with a strong candle with a gap above it in the direction of the current trend, followed by three smaller candles that continue the move with less momentum. The fifth candle reverses the direction with a clear close that shows conviction.
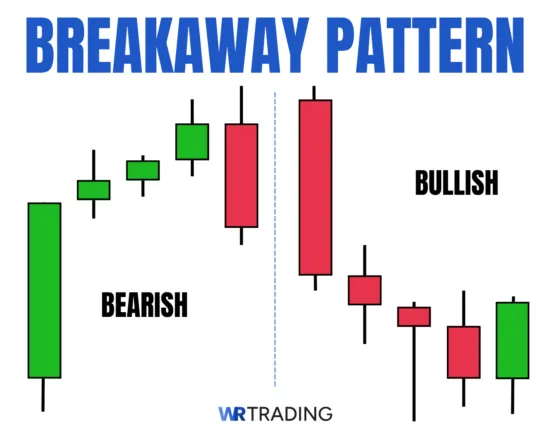
In both bullish and bearish versions, there is a visible gap between the first and second candle, which adds to the patterns’ strength by setting up for a big reversal. The fifth candle closes strongly in the opposite direction, signaling that control has switched. Traders use this pattern to catch early reversal moves that come after trending exhaustion and place trades accordingly into the new trend direction.
In our experience, the Breakaway pattern is a reliable signal for catching new trends just as they begin to form. Our guide explains how the pattern forms, where to find it on the chart, and how to trade it using structure and confirmation, not guesswork.
(Learn To Trade And Read Candlestick Patterns Like A Pro)
What Is A Bullish Breakaway Pattern?
The bullish Breakaway is a 5-candle reversal pattern forming after a downtrend and signals that buyers are starting to regain control. It begins with a large red candle that continues the existing bearish momentum, with a gap between itself and the second red candle. Afterward, three red candles follow the initial red gap candle. These three candles keep pushing lower but with less strength, setting up the shift.
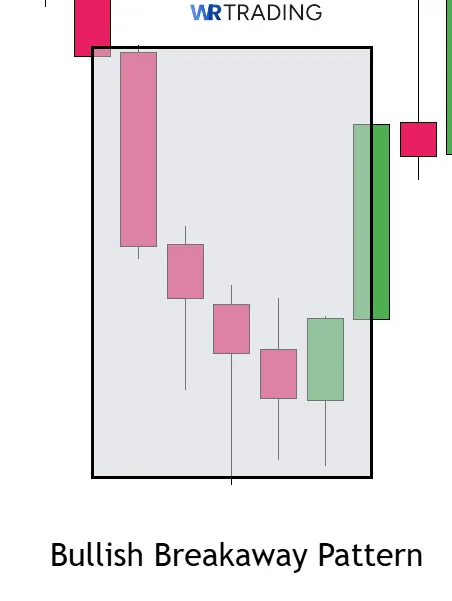
The fifth candle opens above the previous close and ends with a strong green body, closing above the midpoint of the pattern or even near its top. This final candle is the true breakaway, confirming that the market is reversing and buyers are pushing the price higher. When combined with volume and indicators, the bullish Breakaway becomes a clean entry trigger for long trades.
Key Facts About The Bullish Breakaway Candlestick Pattern:
- Type of Pattern: Five-candle bullish reversal pattern
- Construction Characteristics:
- First Candle: Large red candle continuing the downtrend.
- Second Candle: Small red candle that gaps slightly below the first.
- Third and Fourth Candles: Smaller red candles with lower closes and reduced momentum.
- Fifth Candle: Large green candle that closes above the prior bodies, confirming a reversal.
- Trend Prior to Pattern: Forms during extended downtrends or aggressive selloffs.
- Trade Forecast: Signals a reversal and a shift toward bullish momentum.
- Interpretation: Shows that sellers have exhausted their push and buyers are stepping in with strength.
- Stop Loss Placement: Below the low of the fifth candle, or slightly under the lowest candle in the pattern.
- Opposite Pattern: Bearish Breakaway
- Success Rate: 65% to 72%
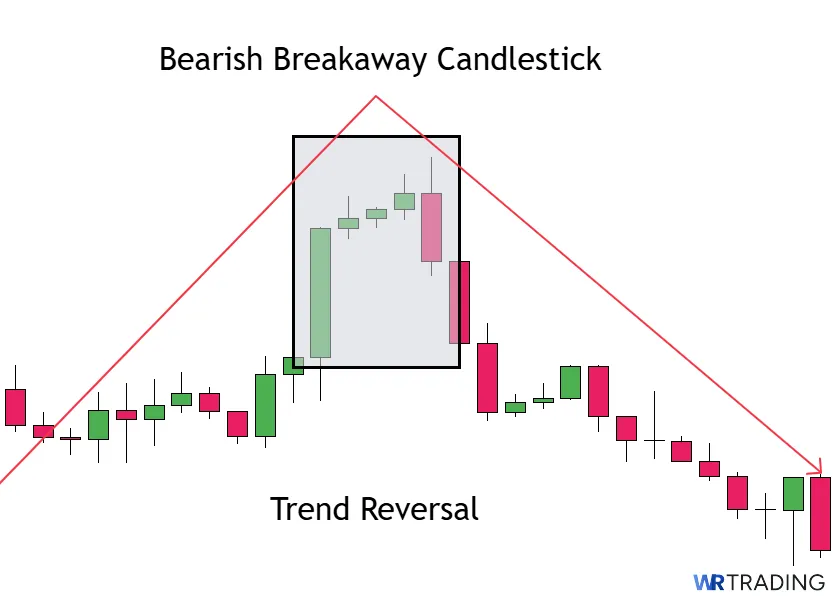
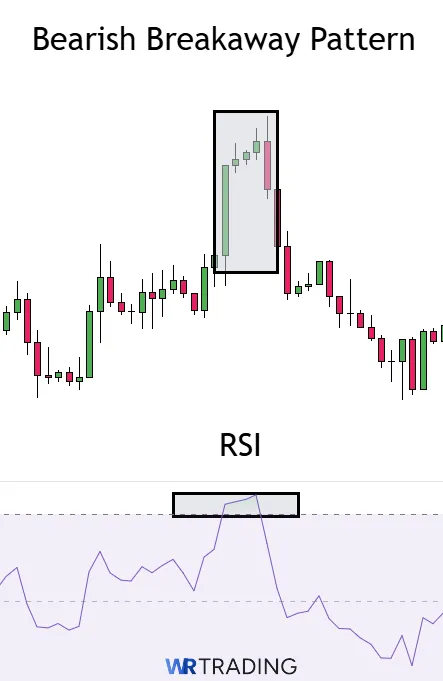
What Is a Bearish Breakaway Pattern?
The bearish Breakaway is a 5-candle reversal pattern that forms after an extended uptrend, showing sellers have gained control of market momentum. It starts with a long green candle that shows continued bullish pressure, followed by a slight gap to the upside and three smaller green candles that continue the move with buying strength. These candles stretch the trend a little further, but the size and structure show the buying energy is losing pace.
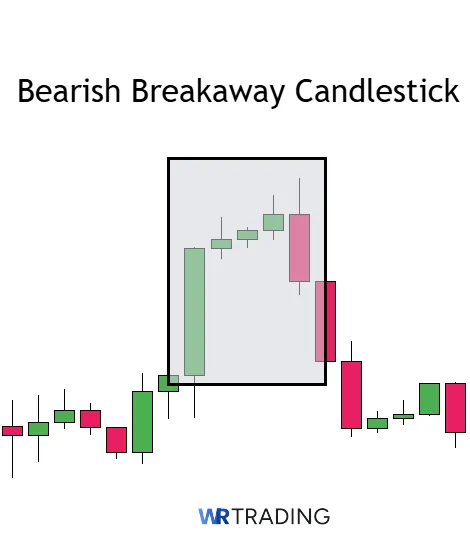
The fifth candle then opens below the last close and prints a strong red body, cutting back through the previous range and confirming that sellers have stepped in. This sudden shift shows the breakaway from the original trend and sets up a short entry. The pattern needs to form after a clear bullish trend to carry any trading value.
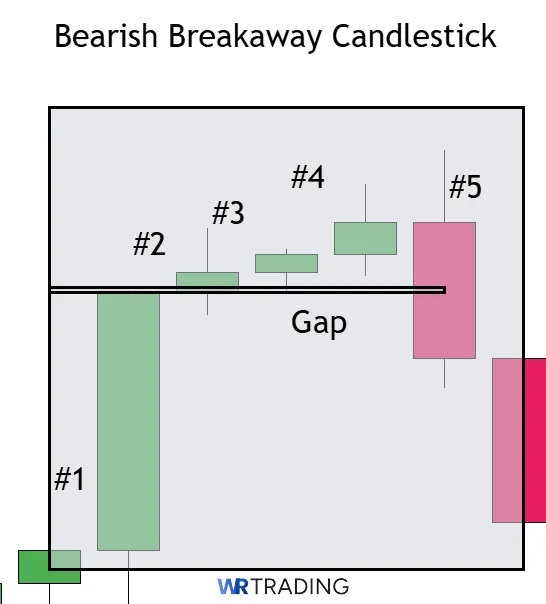
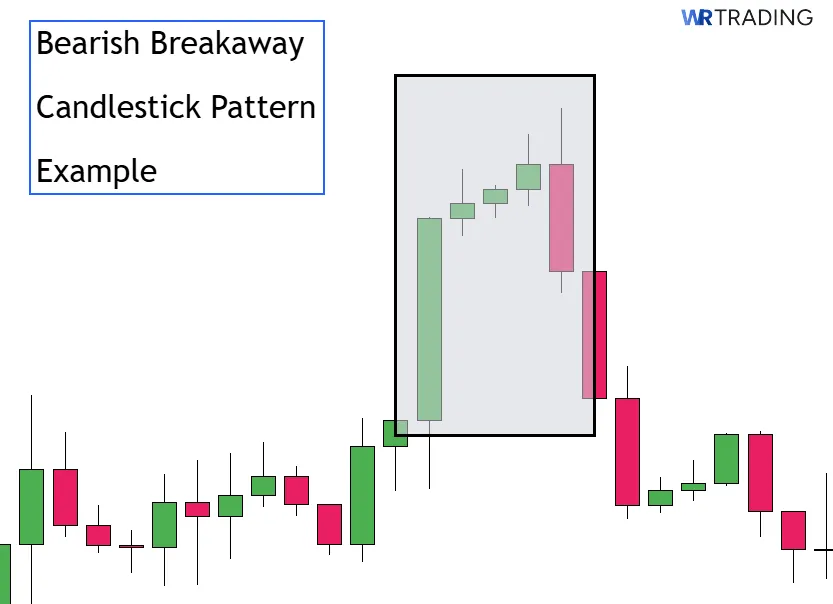
Key Facts About The Bearish Breakaway Candlestick Pattern:
- Type of Pattern: Five-candle bearish reversal pattern.
- Construction Characteristics:
- First Candle: Large green candle continuing the uptrend.
- Second Candle: Small green candle that gaps slightly above the first.
- Third and Fourth Candles: Weaker green candles with higher closes.
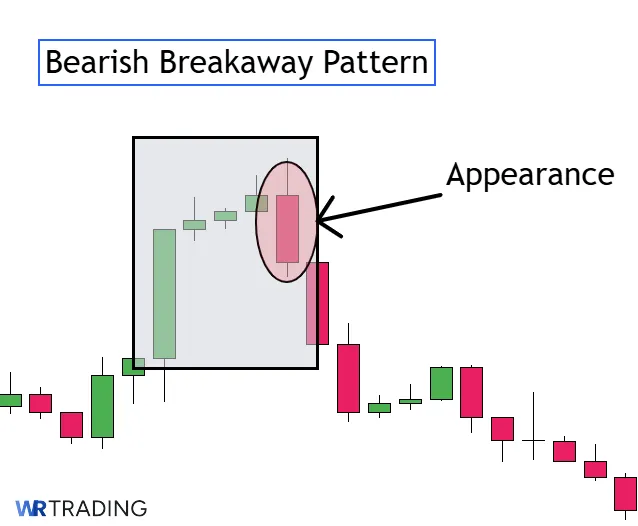
- Fifth Candle: Large red candle that closes deeply into or below the previous bodies.
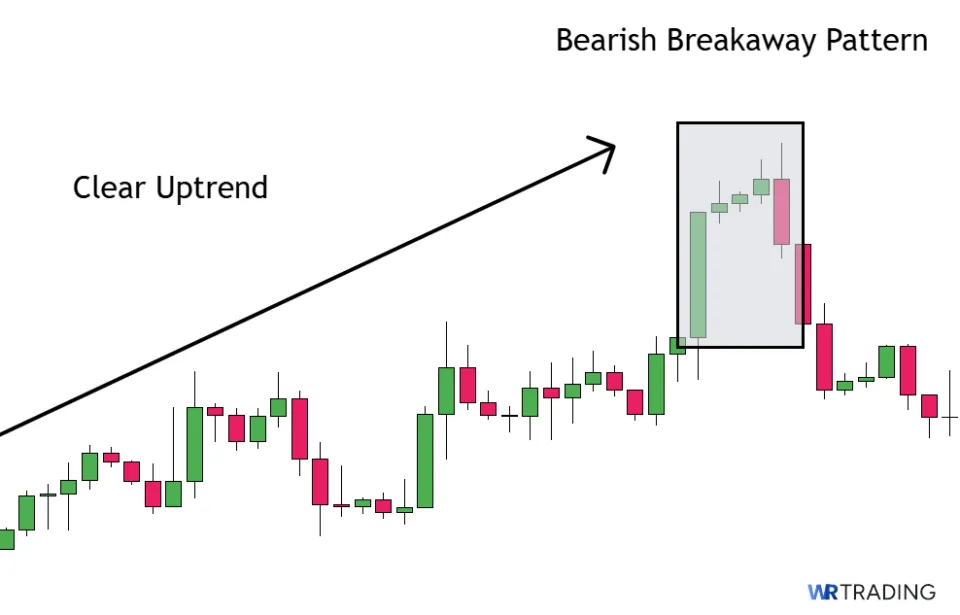
- Trend Prior to Pattern: Appears after long rallies or aggressive bullish phases.
- Trade Forecast: Suggests that the uptrend has ended and a bearish reversal is likely.
- Interpretation: Buyers have lost momentum and sellers are now in control.
- Stop Loss Placement: Above the high of the fifth candle or just above the highest point in the structure.
- Opposite Pattern: Bullish Breakaway.
- Success Rate: 65% to 72%
(Learn To Trade And Read Candlestick Patterns Like A Pro)
How Does a Breakaway Candlestick Pattern Form?
The Breakaway pattern forms across five individual candles, each playing a specific role in marking the trend’s exhaustion and reversal. The time it takes to form depends on the chart, but the full pattern will always completes in five consecutive bars.
The first candle always moves in the direction of the existing trend with strong conviction. The second candle opens with a slight gap, showing continuation in the prevailing trend. The third and fourth candles follow the trend with smaller bodies and reduced energy, making it clear that momentum is fading. The fifth and final candle closes sharply in the opposite direction, cutting back into the previous candles and showing that the breakaway has occurred.
The Breakaway pattern needs trending conditions to be valid. In a bullish version, it forms during a selloff that has extended too far without pause. The final green candle marks the start of the bounce. In a bearish version, it appears after a steep rally that has lost momentum, and the final red candle confirms that buyers have been overwhelmed.
What Does the Breakaway Candlestick Pattern Mean?
The Breakaway candlestick pattern shows a full transition in sentiment within 5 consecutive candles. During the first four candles, the market keeps moving in the direction of the existing trend, but signs of fatigue begin to build. Each smaller continuation candle makes traders believe that the trend might continue, yet the lack of range or volume suggests otherwise.
The final candle flips the direction with power, signaling that the old trend is done and a new phase has begun. This type of structure tells you that one side is stepping away from control, while the other side is beginning to dominate.
It marks a psychological turning point where traders who were following the trend start to exit, and fresh traders enter in the opposite direction. This is what makes it a reversal pattern rather than just a pause or retracement. The Breakaway is not a surprise signal and shows the market slowly letting go, then breaking sharply when the other side takes over.
Where does the name of the Breakaway Pattern Come From?
The pattern gets its name from the way the fifth candle “breaks away” from the previous trend. The structure builds slowly, and the final candle breaks the pattern and confirms a shift in control. It is the clear separation from prior momentum that defines its name and behavior.
(Learn To Trade And Read Candlestick Patterns Like A Pro)
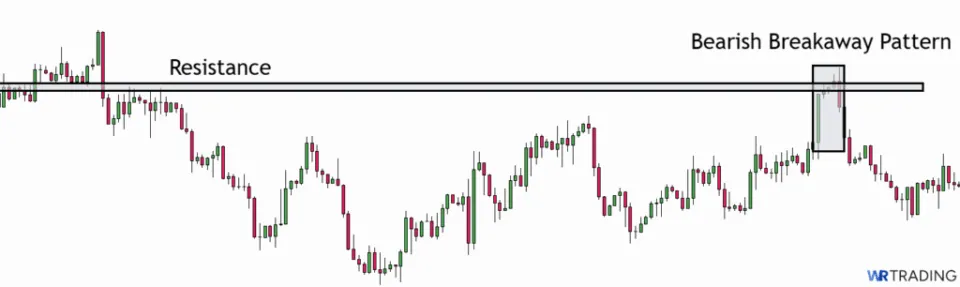
Example of the Breakaway Pattern in the Chart
Here is an Example of a Breakaway Candlestick Pattern spotting in the EUR/USD H4 Chart.
The first Candle is a very strong green Candle. The second candle opens with a small Gap. The next two Candles are small and the last Candle is messured with high Sell Pressure.
How to Identify a Breakaway Candle in the Chart?
To identify a Breakaway pattern correctly, you need to start by scanning for a clear directional trend. In a bullish Breakaway, that trend must be a strong selloff where the price action has consistently pushed downward for several candles. In a bearish version, the pattern follows an extended rally with buyers in control for multiple bars. Without a strong initial trend, the pattern loses meaning and is not worth trading.
Once the trend is confirmed, look for a large candle in the same direction to begin the pattern. This is followed by a second candle that gaps slightly away from the first, continuing in the same direction but with less energy.
The third and fourth candles must also move in the trend’s direction but should be smaller and weaker, showing that momentum is slowing down. The final candle is the most important and must clearly close in the opposite direction with a strong range and body size, signaling that control has shifted.
Breakaway candles are more reliable when they appear near technical zones like support or resistance, where a reversal is more likely to develop. Use tools such as volume analysis or moving averages to confirm the shift in control. You will know the Breakaway is forming correctly when each candle fits the expected behavior, and the fifth candle provides a sharp, clean break from the previous price action. Avoid calling the pattern too early, and always wait for the structure to complete to prevent yourself from entering a losing trade.
How to Trade the Breakaway Candlestick Pattern
The Breakaway candlesticks visually show the changing of trend control, but trading it requires more than just spotting the pattern. You need the right context, confirmation, and entry conditions for it to work as a real trading setup.
Our quick guide walks you through a full strategy, covering what to look for, when to get in, and how to manage the trade properly. We’ve accounted for both the bullish and bearish versions so that you can adapt to whichever version is forming.
- Find the Right Breakaway Candlestick Pattern Setup
- Wait for the Appearance of the Breakaway Candle
- Open Your Trade – Entry Point
- Wait For A Confirmation Or Not
- Choose Your Trading Take Profit
(Learn To Trade And Read Candlestick Patterns Like A Pro)
1. Find the Right Breakaway Candlestick Pattern Setup
Before the Breakaway pattern forms, the market should already be showing strong directional bias. That means clean trends, large candles in one direction, and very little sideways noise. The first four candles must be going in the direction of the trend, with the last three showing less momentum. The fifth candle is the most important because it has to close opposite to the direction of the prior four.
Check that the pattern forms near key zones like support, resistance, or the end of a long trend swing. Add tools like a 20-period EMA or volume profile to confirm if the move is ready to turn. You want the fifth candle to appear where a reversal makes logical sense based on structure.
2. Wait for the Appearance of the Breakaway Candle
Wait for the Breakout to completely form and do not assume the pattern will form until the fifth candle is complete. The structure must develop one candle at a time, and entering too early can expose you to fakeouts. The prior four candles must stretch the trend but slowly lose control. When the final candle sharply breaks that rhythm, the pattern becomes valid and worth trading.
In bullish Breakouts, you need to see a full-bodied green candle that closes above the highs of the previous candles. For bearish setups, the last red candle must close below the low of the earlier move, ideally with increased volume. The shift from hesitation to breakout is what defines the signal, so anything that lacks commitment should be ignored.
You can also use momentum tools like the RSI set to 14 or the MACD crossover to confirm that momentum has turned just as the final candle closes. These tools will shift as the fifth candle completes, helping validate that a real change is underway. Here’s a quick checklist you can do to validate the signal:
Bullish Breakaway Pattern:
- The Breakout pattern shows after a prolonged downtrend or steep selloff.
- The first four candles move lower in size, speed, or volume.
- The fifth candle is large and green, closing above the prior candles’ highs.
Bearish Breakaway Pattern:
- Forms after a strong uptrend or buying spike.
- The first four candles climb with decreasing energy.
- The fifth candle reverses with significant size, closing lower and showing selling strength.
3. Open Your Trade – Entry Point
Once the fifth candle is complete and the pattern checks out, it’s time to place your trade. Enter as close to the closing price of the fifth candle as possible. Do not wait for another bar or use the open of the sixth candle unless confirmation is required in your strategy. Breakaway setups rely on speed and structure. The entire signal depends on that final push showing conviction, so delays often reduce the reward-to-risk ratio.
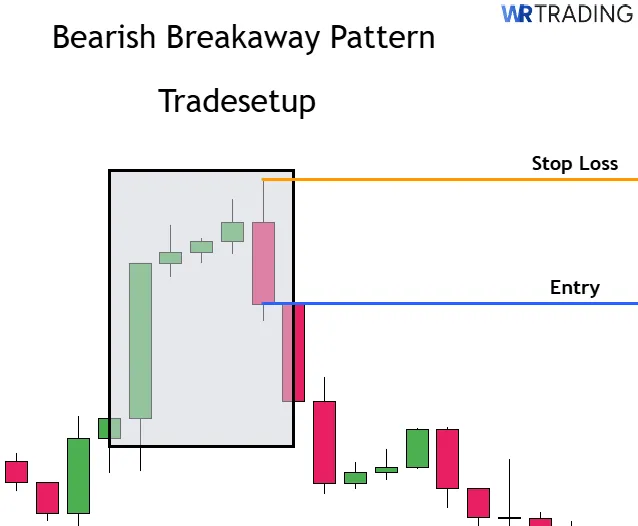
In a bullish trade, go long near the close of the fifth candle and place your stop just below its low. In a bearish trade, go short near the close and put your stop just above its high. This keeps the trade clean because the fifth candle represents the market’s decision point. If the price moves back through it, the trade is no longer valid and you need to exit.
Make sure there is enough room between your entry and the next significant level. Avoid entering if the price is already near a resistance zone in bullish trades or a support area in bearish trades unless its clear momentum will surpass those levels. Clean structure ahead improves your odds of seeing follow-through after entry.
4. Wait For A Confirmation Or Not
The Breakaway pattern can be traded with or without confirmation, depending on your risk tolerance and trading style. Some traders prefer to wait for an additional candle to close in the same direction to confirm that the new move is gaining momentum. This reduces false signals but can also result in a late entry.
In bullish trades, confirmation comes when the next candle closes above the high of the fifth candle. In bearish trades, confirmation is when the next candle closes below the fifth candle’s low. This helps verify that the breakout was not just a spike or one-bar reaction.
However, if the market structure is clean and volume supports the move, entering immediately after the fifth candle can offer the best reward-to-risk setup. Confirmation is most useful when the pattern shows up near a major level or when the volume is unclear. In strong trend reversals, immediate entries often work better, provided the stop-loss is well-placed and you trust your read of the chart.
5. Choose Your Trading Take Profit
Profit targets depend on the size of the move before the pattern is formed and the structure that follows. One method is to measure the distance of the trend leading into the pattern and project a similar move in the new direction. Another is to use recent support or resistance zones as natural price targets.
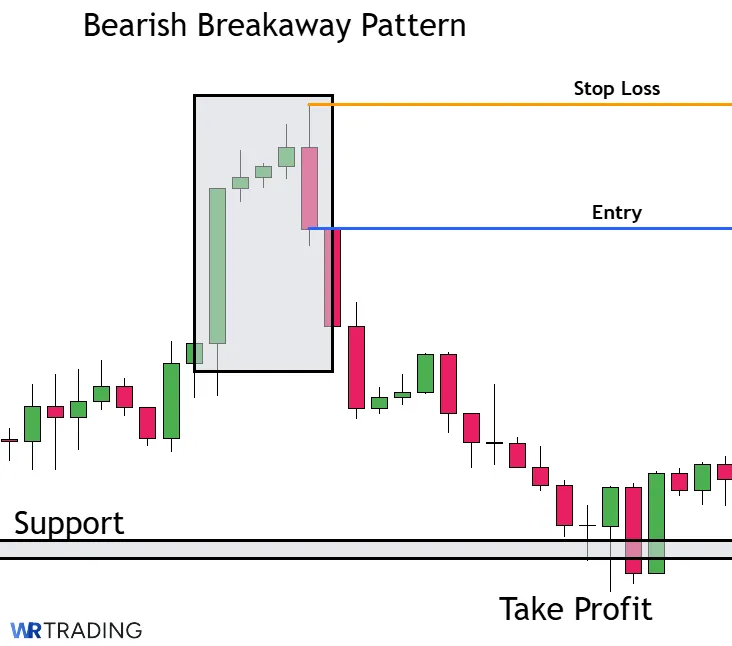
In bullish trades, look for the next major resistance area and set your target slightly below it. In bearish trades, find the next support zone and place your target slightly above it. You can also use Fibonacci extensions or an ATR-based trailing stop to manage the position. Set your take profit in line with the market’s rhythm, and do not force a fixed number of points if the chart structure does not support it.
Consider scaling out of the position in thirds. Take partial profit near the first target, move your stop to breakeven, and let the rest run if the trend continues. This protects your downside and lets you stay in the move longer when the pattern leads to a strong reversal.
(Learn To Trade And Read Candlestick Patterns Like A Pro)
Which Strategies Can Be Used For The Breakaway Candlestick Pattern?
The Breakaway pattern works well when combined with practical tools that offer confirmation. While the pattern alone gives directional clues, its real strength comes when paired with a smart strategy. To help you take advantage of its full potential, the strategies below focus on proven methods. Each one explains how to read the setup, when to enter the trade, and where to place your stop loss.
- Volume Confirmation Strategy
- Support and Resistance Strategy
- Moving Average Pullback Strategy
- News-Based Volatility Strategy
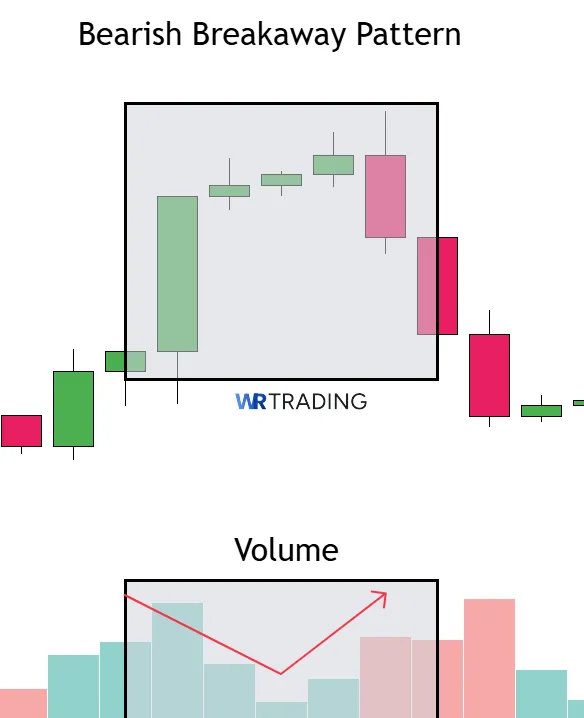
1. Volume Confirmation Strategy
A reliable increase in volume on the fifth candle of the Breakaway pattern gives weight to the setup, signaling that market participants are supporting the new direction. Volume should be light during the four candles and pick up sharply as the final breakout candle forms. This shift in pressure shows that buyers or sellers have stepped in decisively.
When trading a bullish Breakaway, enter after the fifth candle closes above the prior range while volume expands. Place your stop loss just below the low of the second or third candle to protect against false signals. For bearish setups, look for a sharp drop in the fifth candle with volume accelerating and place your stop above the pattern’s highest candle.
2. Support and Resistance Strategy
Using historical levels of support or resistance can provide clear guidance on when the Breakout pattern has a higher probability of following through. A Breakaway pattern that appears directly off a known level offers a built-in confluence factor, reinforcing the signal from the candle formation.
If the price forms a bullish Breakaway just above a broken resistance that has flipped to support, wait for the breakout candle to close firmly above that level before entering. Place your stop below the lowest candle in the pattern or just below the new support line. In bearish cases, look for breakdowns from a failed support level and enter once the breakout candle confirms the rejection.
3. Moving Average Pullback Strategy
The use of a 20-period or 50-period simple moving average helps identify the broader trend and offers structure for entries. When a Breakaway pattern forms after a minor pullback to one of these moving averages, it signals that trend momentum is ready to resume.
In a bullish setup, make sure the price is above the moving average and the pattern forms as the price bounces off that dynamic level. Enter on the close of the fifth candle and place a stop loss just beneath the moving average or pattern’s low.
For bearish setups, the price should be below the moving average with the pattern forming after a retracement up to the average. Entry comes after the Breakout candle closes, with a stop above the highest candle in the structure.
4. News-Based Volatility Strategy
Sharp price shifts caused by news events trigger the emotion needed to form a Breakaway since traders don’t want to be left out of potentially winning trades. These events cause sudden reversals or trend accelerations, making them ideal environments to look for clean multi-candle reversals or continuation moves.
Monitor economic calendars or earnings releases and look for a Breakaway to appear during or shortly after a volatile event. If the fifth candle closes strong and breaks through recent zones, consider entering with a tight stop under the structure or under the second candle. Confirm that the move aligns with the nature of the news and is not just a short-term reaction.
(Learn To Trade And Read Candlestick Patterns Like A Pro)
What Is The Success Rate Of The Breakaway Candlestick Pattern?
There is limited historical data on the exact success rate of the Breakaway candlestick pattern in major academic or institutional research. However, in our general observations from trading and price action analysts show that when confirmed with volume, the pattern has a success range of around 65% to 72%, depending on the timeframe and context.
Since the pattern involves a breakout from a consolidation or reversal structure, it tends to perform better when traded in liquid markets with clear directional bias and confluence from support or resistance levels.
Is the Breakaway Candlestick Pattern Suitable For Beginners?
Yes, the pattern has a clear five-candle structure that makes it easier to identify than many advanced reversal signals, and it teaches newer traders how to understand breakout mechanics in the context of price action. However, beginners must still learn to combine it with basic tools like volume or trend analysis, or they risk trading into false signals or against larger market trends.
What Are the Pros and Cons of Trading the Breakaway Candle Pattern?
Breakaway patterns offer unique strengths and challenges when trading. On one hand, their structure gives traders a reliable signal for interpreting trend reversals and market shifts. However, success depends heavily on reading the context correctly and knowing when the setup carries real momentum.
The five-candle formation may look simple, but it requires a sharp eye for trend conditions, volume behavior, and confirmation signals. Below is a quick summary of the most relevant pros and cons before we look at each side in more detail.
Pros
- Can Signal Strong Trend Reversals
- Clear Multi-Bar Structure
- Works Well With Confirmation Tools
- Defines Risk and Entry Zones Clearly
- Visually Easy to Spot With Practice
Cons
- Can Be Misleading Without Trend Context
- Weak in Low-Volume Environments
- Easy to Confuse With Similar Patterns
- Performance Varies Widely Across Markets
- Late Entry Compared To Other Patterns
What Are The Advantages Of The Breakaway Pattern?
Breakaway patterns are useful in reversal trading strategies because of the straightforward signal it provides with many complementary trading tools available. Traders looking for a well-defined pattern that shows early shifts in sentiment often rely on this setup to anticipate momentum turns with more confidence.
When used in the right environment, its multi-candle sequence reveals useful clues about market direction, trader behavior, and possible entry zones that align with risk-managed strategies. Here are the main pros of the Breakout pattern:
- Can Signal Strong Trend Reversals: The Breakout pattern forms after an extended move and can signal that the trend is losing strength. Each candle shows diminishing pressure in the direction of the old trend. By the fifth candle, the new direction becomes dominant and opens up trading opportunities.
- Clear Multi-Bar Structure: The breakaway has five distinct candles that build on each other, which gives traders more information to work with and helps confirm if the market is truly shifting. The sequence of lower highs or higher lows adds validation to the signal.
- Works Well With Confirmation Tools: Breakaway patterns work best when combined with volume analysis, support and resistance levels, or moving averages. These tools help confirm that the move is valid and not just a random price fluctuation. It also improves timing for entries and exits.
- Defines Risk and Entry Zones Clearly: The structure of the Breakaway pattern provides natural entry points near the close of the fifth candle and logical stop placement near the low or high of the first candle. This makes it easier to set up risk-reward ratios that are reasonable.
- Visually Easy to Spot With Practice: Once you understand what to look for, the five-candle sequence becomes easier to recognize on the chart. The contrast between the initial trend and the emerging reversal stands out. This makes the pattern suitable for visual scanning and quick recognition in live markets.
What Are The Disadvantages Of The Breakaway Pattern?
The Breakaway pattern comes with limitations that must be taken seriously to avoid going into losing trades. Its effectiveness drops sharply outside of trending markets, and traders who rely only on the visual structure without supporting evidence often find themselves caught in weak signals. Understanding these disadvantages is necessary if the goal is long-term consistency rather than random results.
- Can Be Misleading Without Trend Context: If the Breakout pattern forms in a sideways market or choppy range, it loses much of its meaning. The candles might appear correct, but without trend pressure, the signal often fails. Trend context is not optional when using this pattern.
- Weak in Low-Volume Environments: Without volume confirmation, the Breakout pattern can result in weak moves. If volume drops during formation, there is no real momentum behind the shift. Traders may enter based on visuals and get stuck in range-bound price action.
- Easy to Confuse With Similar Patterns: Patterns like the kicker or three outside formations may look somewhat similar. Without careful attention to the sequence and the meaning of each candle, traders can mislabel the setup. This leads to incorrect assumptions and risky trades.
- Performance Varies Widely Across Markets: What works on a daily chart of a large-cap stock may not translate to forex or crypto. Some markets are more responsive to this pattern than others. Backtesting is important to understand its value in a specific environment.
- Late Entry Compared to Other Patterns: Since confirmation comes only after five candles, entries are naturally slower. Other reversal patterns might provide faster entries with tighter risk. The tradeoff is more information in exchange for less early positioning.
Can the Breakaway Pattern Have Failure Signals?
Yes, the breakaway pattern can fail if the sequence forms in poor conditions or lacks proper follow-through. Traders must be aware of the warning signs that suggest the pattern is losing its reliability.
- Low Volume On The Breakout Candle: If the fifth candle that completes the Breakout pattern closes with weak volume, the breakout lacks support. Strong directional shifts must be backed by increased participation, otherwise the move may fade quickly. A quiet finish suggests hesitation rather than momentum.
- Forms Inside A Consolidation Range: When the Breakout pattern appears in the middle of a range-bound market, its strength is often neutralized. The absence of trend pressure reduces the meaning of the formation. This often results in sideways movement or a failed breakout.
- False Breakout Followed By Sharp Reversal: Sometimes, the breakout candle pierces a level only to get rejected immediately. If the next candle after the fifth reverses fully and closes inside the pattern, it invalidates the signal.
- No Prior Clear Trend Before Formation: Without a strong directional move leading up to the Breakout pattern, it becomes unreliable. The structure assumes a trend is weakening and reversing. If there was no real trend to begin with, the meaning behind the shift is weak.
- Breakout Against Strong Resistance Or Support: Even if the breakout candle looks strong, running into a well-tested resistance or support zone can stop the move. If the price fails to close beyond that level, it signals that the pattern was not enough to break through. This often leads to price stalling or reversing.
- Overlapping Candles With Long Wicks: If the five candles show long upper and lower shadows and overlapping bodies, it signals indecision. A clean breakaway must have directional energy. Wicks and overlaps dilute that strength and create confusion.
- Market News Invalidates The Setup: Unexpected events like central bank announcements or geopolitical news can wipe out any technical setup. A perfect breakaway can fail if the news contradicts the signal. Always check for upcoming events before placing a trade.
(Learn To Trade And Read Candlestick Patterns Like A Pro)
Which Indicators Can Be Combined With The Breakaway Pattern?
Breakaway patterns reveal early shifts in market direction, but using them without confirmation tools can leave traders exposed to false signals or late reactions. To strengthen the pattern’s reliability and improve timing, pair it with technical indicators that highlight momentum, trend strength, or key price levels. Here are a few indicators that work well with Breakaway setups across both bullish and bearish versions.
- Volume (OBV or Standard Volume Tool): Volume helps validate the strength behind each candle in the Breakaway sequence. When volume increases on the breakout candle (the fifth one), it confirms that buyers or sellers are stepping in with conviction. A low-volume move often fails to follow through, so the volume profile should align with the direction of the breakout. Standard volume bars or On-Balance-Volume (OBV) can both be used to monitor this.
- Relative Strength Index (RSI): The RSI tracks momentum and can help identify if the pattern is occurring in overbought or oversold conditions. A bullish Breakaway forming during an oversold RSI zone strengthens the case for a rebound, while a bearish one near overbought levels signals exhaustion. Use the RSI crossing back below 70 or above 30 as additional timing input. Settings of 14-period RSI work well for most chart setups.
- Moving Averages (EMA 20 and EMA 50): Moving averages help define the broader trend and offer dynamic support or resistance levels around the pattern. A bullish Breakaway forming above the 20 or 50 EMA shows the price is aligned with trend continuation. A bearish Breakaway that breaks under these moving averages signals that a deeper move is developing. Watch how the price reacts around these lines before and after the pattern forms.
- ADX (Average Directional Index): The ADX is used to measure the strength of a trend, regardless of direction. Values above 20 or 25 suggest a trend is beginning to gain traction, which supports the move after the Breakaway completes. A flat or falling ADX reading may warn that the signal is premature or lacking follow-through. Combine this with directional movement lines (DI+ and DI−) to read confirmation more clearly.
What Are Similar Patterns To The Breakaway Pattern?
The Breakaway pattern is unique in its structure, but several other candlestick patterns offer similar signals or appear in similar contexts. These patterns either share the multi-bar construction, signal early reversals, or follow strong directional shifts in price. Learning how these patterns differ in structure or interpretation can improve how you use the Breakaway or avoid confusing it with lookalikes.
| Pattern Name | Key Characteristic | Best Use Case |
|---|---|---|
| Morning Star | Three-candle reversal with a large bearish candle, a small-bodied middle candle, and a strong bullish close that regains control. | Detecting a shift in sentiment after aggressive selling. |
| Evening Star | Starts with a strong bullish candle, followed by a narrow-bodied candle, and then a full bearish close that erases gains. | Spotting a transition from bullish exhaustion to new bearish pressure. |
| Three Inside Up | Inside bullish reversal where the second candle is contained within the first, and the third confirms direction. | Catching early reversal signs backed by strong confirmation. |
| Rising Three Methods | Five-candle continuation where three small candles move against the trend before a full resumption candle. | Holding through a pullback within a strong ongoing uptrend. |
| Abandoned Baby | Rare reversal marked by a gap, a standalone doji, and a sharp close in the opposite direction. | Capturing sudden reversals during volatile price action. |
What Is The Opposite Pattern Of The Breakaway?
There is no opposite pattern of the Breakaway formation. The opposite of the bullish Breakaway pattern is the bearish Breakaway, and vice versa. These two setups mirror each other in candle structure and market behavior but in entirely different directions. The bullish version appears after a downtrend and ends with a strong green candle that confirms a reversal upward. The bearish version starts from a rally and ends with a decisive red candle that confirms sellers have taken control.
Each candle in the sequence works the same way but reflects the opposite sentiment. A bullish Breakaway shows a gradual loss of selling pressure followed by a surge in buying, while the bearish version shows weakening buyers before the final breakdown. Traders can apply the same structure, timing, and confirmation tools to both sides, but always pay attention to the trend direction beforehand, as this determines which version you are working with.
| Section | Bullish Breakaway | Bearish Breakaway |
|---|---|---|
| Main Characteristics | Appears at the end of a prolonged decline, indicating that selling pressure has weakened and buyers are gradually gaining strength. | Forms at the peak of an uptrend, suggesting that the buying pressure has lost momentum and bears are beginning to step in. |
| Construction | Candle 1: Large red candle showing strong selling. Candle 2: Red gap candle with lower close. Candle 3: Smaller red candle indicating slowing momentum. Candle 4: Small-bodied candle that begins to reverse direction. Candle 5: Large green candle that closes above the previous range. | Candle 1: Large green candle with strong upward momentum. Candle 2: Green gap candle continuing the rally. Candle 3: Smaller green candle with weaker follow-through. Candle 4: Small-bodied candle hinting at reversal. Candle 5: Large red candle that breaks below the range. |
| Forecast | Signals that the downtrend has ended and a new bullish trend may be starting. | Indicates that the uptrend is over and a reversal to the downside is underway. |
| Type of Pattern | Five-candle reversal pattern | Five-candle reversal pattern |
| Trend Prior to Pattern | Forms after a strong downward trend with consistent selling pressure. | Develops following an extended rally or sharp bullish move. |
| Best Use Case | Most effective when found at the bottom of a longer-term decline, if supported by volume or a reversal zone. | Best used after a steep rise where the market appears overextended and exhaustion becomes visible. |
For more candlestick patterns, see our free Candlestick Patterns Cheat Sheet PDF.
(Learn To Trade And Read Candlestick Patterns Like A Pro)
What Is The Difference Between The Breakaway Pattern And The Breakaway Gap?
The Breakaway Gap is a one-candle event, often triggered by a catalyst that forces the price to leap away from a previous trading range. It does not rely on candle structure, sequences, or gradual shifts in momentum, like the Breakaway pattern. Instead, it depends on an immediate market imbalance that creates a visible price gap, often with heavy volume. The signal is fast and powerful, but lacks the buildup and confirmation seen with the 5 candle Breakaway pattern.
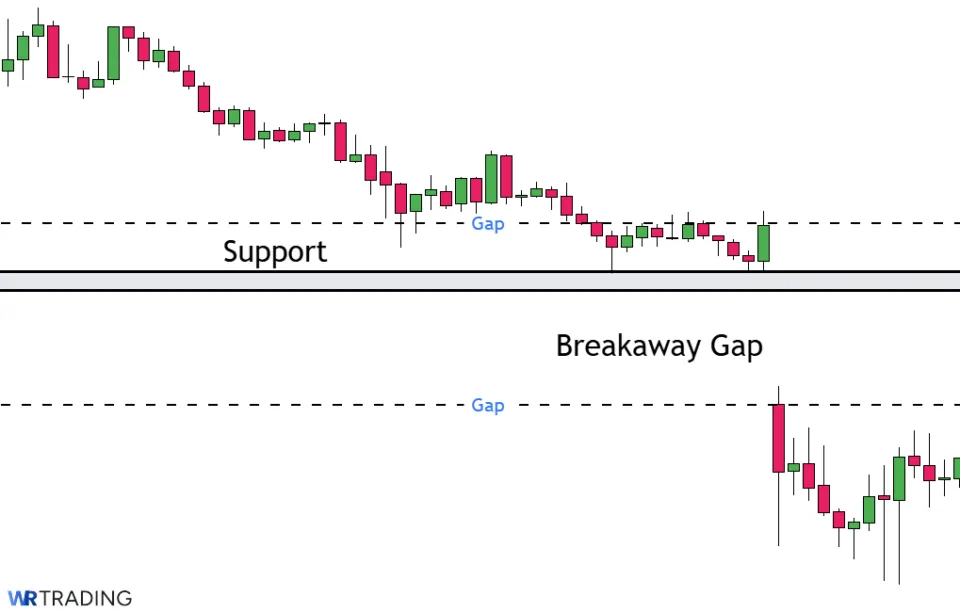
Compared to the Breakaway pattern, the Breakaway Gap offers less context but forms faster. There is no development period or candle progression to observe. That makes it ideal for traders who react quickly to new price information but less helpful for those who prefer patterns with clear reversal logic. The Breakaway pattern gives traders more time to analyze the chart, while the gap pattern demands fast decision-making.
| Section | Breakaway Pattern | Breakaway Gap |
|---|---|---|
| Main Characteristics | A structured five-candle sequence that signals a change in direction after a trend loses strength. | A sudden gap in price that breaks away from a congestion zone, marking the start of a new trend. |
| Construction | Candle 1: Strong trend candle. Candle 2: Continuation in the same direction with a gap. Candle 3: Smaller candle with waning momentum. Candle 4: Smaller candle with less volume. Candle 5: Breakout candle in the opposite direction. | Single strong candle that opens significantly above or below the prior day’s range, leaving a visible gap between the candles. |
| Forecast | Predicts a full reversal of the previous trend once the fifth candle confirms the setup. | Suggests the beginning of a strong trend in the direction of the gap. |
| Type of Pattern | Five-bar reversal pattern | Single-bar momentum pattern |
| Trend Prior to Pattern | Requires a clear ongoing trend for context and reversal confirmation. | Often forms after sideways movement or consolidation periods. |
| Best Use Case | Best for traders who use structured price action patterns to identify reversals. | Suitable for momentum traders who look for fast entries after a price gap. |
What Is The Difference Between The Breakaway Pattern And The Kicker Pattern?
The Kicker pattern is a two-candle reversal setup that appears after major sentiment shifts, news events, or unexpected volatility. It starts with a candle in the direction of the existing trend, immediately followed by a candle in the opposite direction that opens with a noticeable gap. That gap is the defining feature of the Kicker and signals an instant shift in momentum without any gradual build-up. There is no middle ground or indecision between the candles, just a clean break in sentiment from one candle to the next.
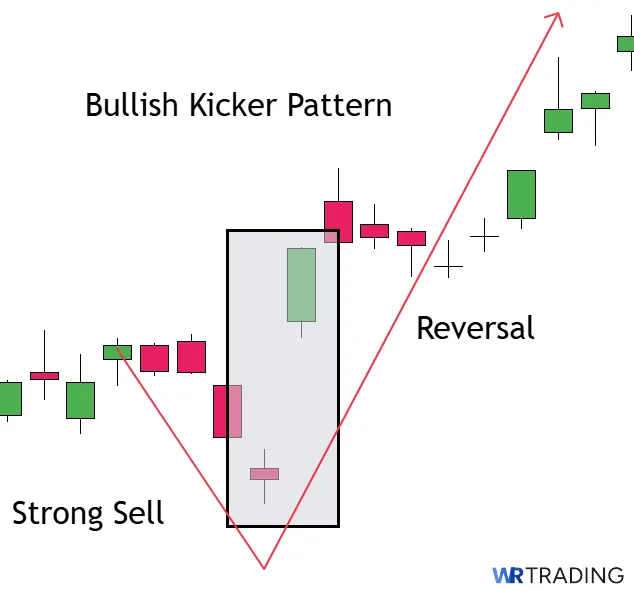
The Breakaway pattern also involves a gap, which can make it look similar to the Kicker at first. However, it builds over five candles, not two, and shows a gradual loss of strength in the current trend before the reversal is confirmed. Both are strong reversal signals, but they suit different types of traders and market environments.
| Section | Breakaway Pattern | Kicker Pattern |
|---|---|---|
| Main Characteristics | Structured pattern that signals a reversal after a prior trend weakens over multiple candlesticks. | A fast two-candle formation with a sharp reversal in sentiment, seen as a strong signal. |
| Construction | Candle 1: Dominant trend candle. Candle 2: Follow-through in the same direction with a gap. Candle 3: Smaller candle with fading strength. Candle 4: Indecision or reversal candle. Candle 5: Large candle in the new direction confirming the shift. | Candle 1: Strong trend candle. Candle 2: Opposite-colored candle that opens with a gap and moves forcefully in the other direction. |
| Forecast | Indicates a full reversal when the fifth candle confirms a shift in control. | Points to a rapid change in direction and often starts a new trend. |
| Type of Pattern | Five-bar reversal pattern | Two-bar reversal pattern |
| Trend Prior to Pattern | Appears after an extended move either upward or downward, often near exhaustion. | Forms at the end of a strong trend or during a news-driven event. |
| Best Use Case | Works well in structured setups where reversal builds over time and confirmation is needed. | Best in fast-moving markets where immediate reversals occur, such as after a surprise catalyst. |
What Are The Limitations Of The Breakaway?
The Breakaway candlestick pattern can offer strong visual signals, but it does have limitations like any other pattern. One major limitation is that it takes five candles to fully form, which often causes the entry to lag behind the initial move, or by the time the fifth candle closes, much of the early momentum may already be priced in.
Another issue is that Breakaway patterns are not always obvious in real-time and some traders may confuse it with other patterns until it fully forms. Without proper context, traders might force the pattern where it does not exist or ignore the need for confirmation. It also loses reliability in low-volume environments where the price action lacks conviction.
- The five-candle structure can cause late entries compared to faster signals.
- It loses accuracy when traded in sideways or low-volatility markets.
- The pattern is often misread without clear trend direction leading into it.
- Volume confirmation is required but not always available across assets.
- It does not work well on lower timeframes due to chart noise.
- Traders may confuse it with other multi-bar patterns like the kicker.
Learn Pattern Trading With the WR Trading Mentoring
Trading the Breakaway pattern successfully takes more than just recognizing its five-candle structure since you need to understand when to trust the setup, how to manage the trade, and what conditions make the signal more reliable. That level of clarity only comes from hands-on experience, guided practice, and learning from someone who has already made the mistakes for you.
The WR Trading Mentoring program is designed for traders who want to speed up their learning curve and stop guessing in the markets. You will learn how to spot, validate, and trade patterns like the Breakaway using proven strategies that are practical and straightforward to apply.
Moreover, with expert coaching, chart breakdowns, and regular support, you will gain confidence in your strategy and learn how to navigate real trading conditions without relying on hope or luck. If you’re serious about turning patterns into profits, WR Trading is where you start.
(Learn To Trade And Read Candlestick Patterns Like A Pro)
Conclusion: The Breakaway Candlestick Pattern Is a Clear Reversal Signal
The Breakaway candlestick pattern provides a straightforward way to read reversals and market shifts that many traders overlook. When used correctly with technical indicators and volume confirmation, it offers a clear multi-candle signal that reflects a transition from one trend to another, giving enough time to assess each step in the shift.
From personal experience, it works best when applied on daily or 4h charts with strong trend context and proper risk management. It’s not meant for every situation and is not ideal for fast scalping or flat markets, but it can be a powerful signal in reversal zones. Learn how to apply it consistently, understand the full formation, and combine it with other tools to turn a visual structure into a working part of your trading strategy.
FAQs: Moste frequently asked Questions on Breakaway Candlestick Pattern
Can the Breakaway Pattern Be Used in Forex Trading?
Yes, the Breakaway pattern can be applied in forex on longer time frames where reversals matter. Daily and 4h charts provide the clearest structure in most major currency pairs. Always combine it with volume proxies or momentum tools since forex lacks centralized volume.
How Do I Know if I Am Looking at a True Breakaway Pattern?
A real Breakaway pattern must follow a clear five-candle structure with lower highs or higher lows forming across the first four candles. The fifth candle must break the pattern and signal a directional shift. If the sequence is not clear, it may not be a valid setup.
Is the Breakaway Pattern Only Useful in Trend Reversals?
While it’s mostly known for signaling reversals, it can also work as a continuation signal in strong trending conditions. Identifying the context before the pattern forms is important since a Breakaway appearing in a trend pullback can signal the next move in the same direction.
Can the Breakaway Pattern Fail Even With Confirmation?
Yes, no pattern is perfect and the Breakaway can still fail even when volume or momentum confirms the move. External news or sudden volatility can interrupt clean technical setups. That is why stop losses and risk planning remain necessary.
Should I Trade Every Breakaway Pattern I See?
No, not every Breakaway should be traded unless it meets the right conditions. The pattern must appear in the correct context with confirmation tools to support the setup. Always evaluate the surrounding structure, volume, and location on the chart before committing.