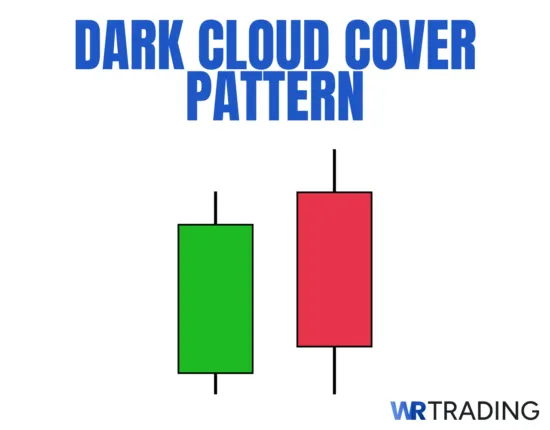
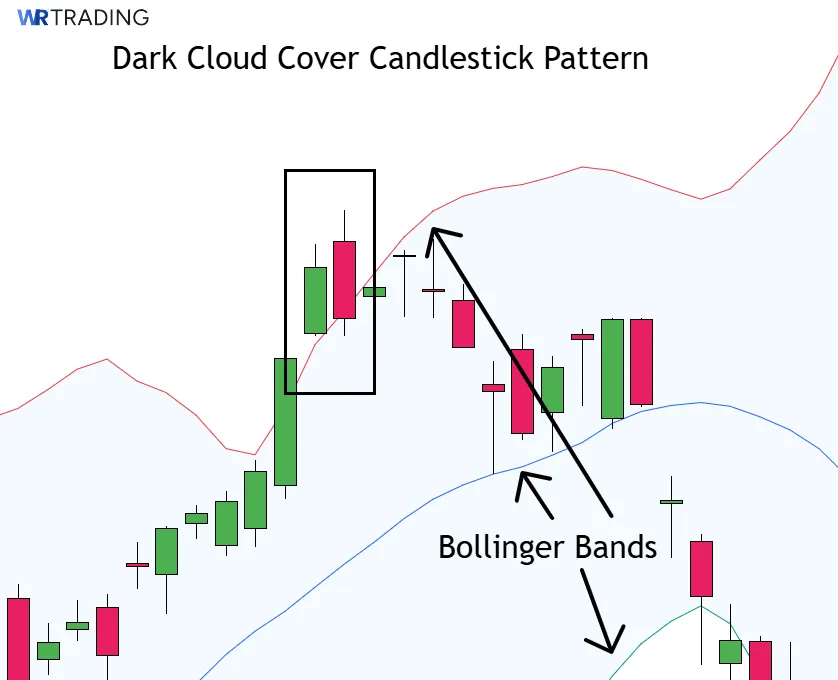
The Dark Cloud Cover is a bearish reversal candlestick pattern consisting of two candles that form at the end of an uptrend or during a significant bullish swing. The first green candle in this formation is bullish and demonstrates strong buying pressure, closing near its high. However, the second red candle opens with a gap above the first candle’s close, signaling bullish continuation initially, but then reverses sharply to close well within the previous candle’s body, ideally below its midpoint.
This reversal signals to traders that bullish momentum is likely fading, providing an opportunity to enter short positions or close existing longs. In this comprehensive guide, you’ll learn exactly how to spot this pattern accurately, understand its market psychology, and explore detailed trading strategies to leverage its signals effectively.
Key Facts About The Dark Cloud Cover Candlestick Pattern:
- Type of Pattern: Two-candle bearish reversal pattern.
- Construction:
- First Candle: The first is a strong green candle closing near its high, showing sustained buying strength.
- Second Candle: The second is a red candle that opens above the prior close and closes deep into the green candle’s body, preferably below the midpoint.
- Forecast: This structure signals that bullish momentum has likely peaked and selling pressure is starting to take control. It often leads to short-term reversals or larger trend shifts if confirmed by follow-through red candles.
- Trend Prior to Pattern: The Dark Cloud Cover forms during an uptrend or after an extended bullish swing.
- Opposite Pattern: The Piercing Line
- Stop-Loss Placement: Place a stop-loss just above the high of the second candle, allowing for a tight and logical risk level if the Dark Cloud Cover fails.
- Candlestick Success Rate: The Dark Cloud Cover has an estimated success rate around 60%, depending on confirmation and market context.
(Learn To Trade And Read Candlestick Patterns Like A Pro)
How Does a Dark Cloud Cover Candlestick Pattern Form?
The Dark Cloud Cover pattern forms over two candles during an uptrend or extended bullish swing. It begins with a strong green candle that closes near its high, confirming continued buying interest and upward momentum. The following candle opens higher, often above the previous close, creating the impression that the bullish move will continue.
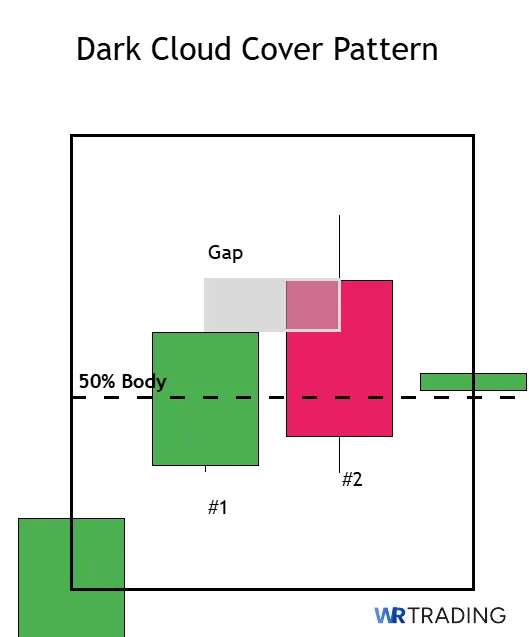
However, instead of building on those gains, sellers step in and drive the price lower. The second candle closes deep into the body of the first, past the midpoint, shifting the tone from optimism to caution.
This sharp rejection of higher prices is the core of the Dark Cloud Cover. The transition from bullish to bearish sentiment happens quickly and visually, giving traders an early clue that the uptrend may be losing strength. The deeper the second candle closes into the first, the stronger the potential signal.
What Does the Dark Cloud Cover Candlestick Pattern Mean?
The Dark Cloud Cover pattern delivers a strong bearish signal, clearly showing traders that bullish strength has likely reached its limits. Traders see bullish action through the first green candle, as it confirms the current bullish trend and attracts additional buyers expecting further gains.
The sharp reversal demonstrated by the second red candle, serves as a clear warning sign. Traders recognize this as a pivotal shift, indicating that the bullish optimism driving prices higher is reducing, and sellers have regained control.
Furthermore, since the reversal candle decisively closes deep within the previous bullish candle’s range, it provides traders with a straightforward signal for short-selling positions or exiting longs.
Where does the name of the Pattern Dark Cloud Cover Come From?
The name “Dark Cloud Cover” reflects how the second bearish candle visually overshadows the first bullish candle, resembling dark clouds rolling in after a stretch of clear skies. It represents the idea that previous optimism is being smothered by sudden selling pressure, hinting at a shift in control from buyers to sellers.
(Learn To Trade And Read Candlestick Patterns Like A Pro)
How to Identify a Dark Cloud Cover Candle in the Chart?
To identify the Dark Cloud Cover, look for the pattern only after a clear and sustained uptrend, as the pattern’s significance diminishes if it forms randomly during sideways or indecisive market conditions. The first candle must always be strongly bullish, preferably large in size and closing near its high, reinforcing bullish sentiment.
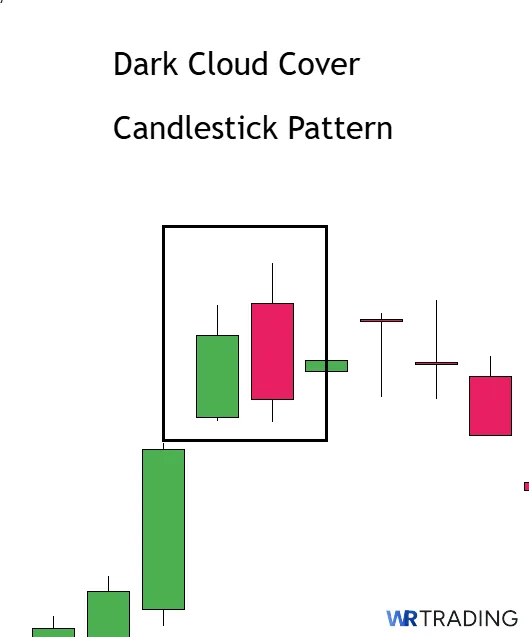
The second candle provides the critical signal; it must open above the previous candle’s close, initially suggesting bullish continuation. However, throughout the candlesticks’ formation, selling pressure should clearly dominate, causing the candle to close significantly lower, ideally below the midpoint of the first bullish candle. Traders must confirm that this bearish candle closes firmly inside the previous candle’s body for the signal to remain valid.
How to Trade the Dark Cloud Cover Candlestick Pattern?
Effectively trading the Dark Cloud Cover candlestick pattern requires clear guidelines, precise timing, and confirmation through reliable indicators. While the pattern is straightforward visually, ensuring accuracy involves verifying market context and using additional technical tools for confirmation. In this trading strategy guide, we outline a step-by-step approach covering:
- Find the Right Dark Cloud Cover Candlestick Pattern Setup
- Wait for the Appearance of the Dark Cloud Cover Candle
- Open Your Trade – Entry Point
- Wait For A Confirmation Or Not
- Choose Your Trading Take Profit
(Learn To Trade And Read Candlestick Patterns Like A Pro)
Find the Right Dark Cloud Cover Candlestick Pattern Setup
The first step to trading the Dark Cloud Cover pattern requires correctly identifying suitable market context. Find scenarios where prices have been consistently rising, demonstrating clear bullish momentum through multiple bullish candles. Look for these scenarios near resistance levels, significant Fibonacci retracement points, or previous highs, as reversals occurring at these areas generally have stronger validity.
Moreover, using technical indicators helps validate the context further. The Relative Strength Index (RSI) provides valuable insights; look for RSI readings exceeding 70, signaling overbought conditions. The stochastic oscillator is another effective tool; when both %K and %D lines cross downward from the overbought territory above 80, it indicates diminishing bullish strength.
Wait for the Appearance of the Dark Cloud Cover Candle
After identifying the right context, wait patiently for the complete formation of the Dark Cloud Cover. Avoid prematurely entering positions before the second red candle closes. Confirmation of the bearish close within the previous candle’s body ensures that the pattern accurately signals a genuine shift in market sentiment.
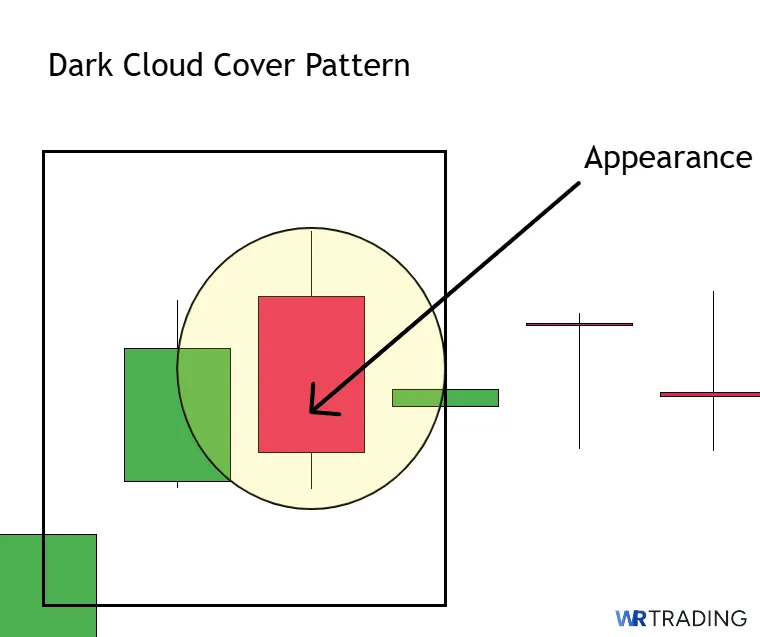
Furthermore, always verify that the second candle’s penetration into the first candle’s body is substantial, closing below its midpoint. Shallow penetration often leads to weaker signals and potentially unreliable trade entries.
Open Your Trade – Entry Point
Upon verifying the complete and properly formed Dark Cloud Cover pattern, prepare your entry points. Initiate short positions immediately at the opening price of the following candle, capturing potential early bearish momentum following the pattern’s confirmation.
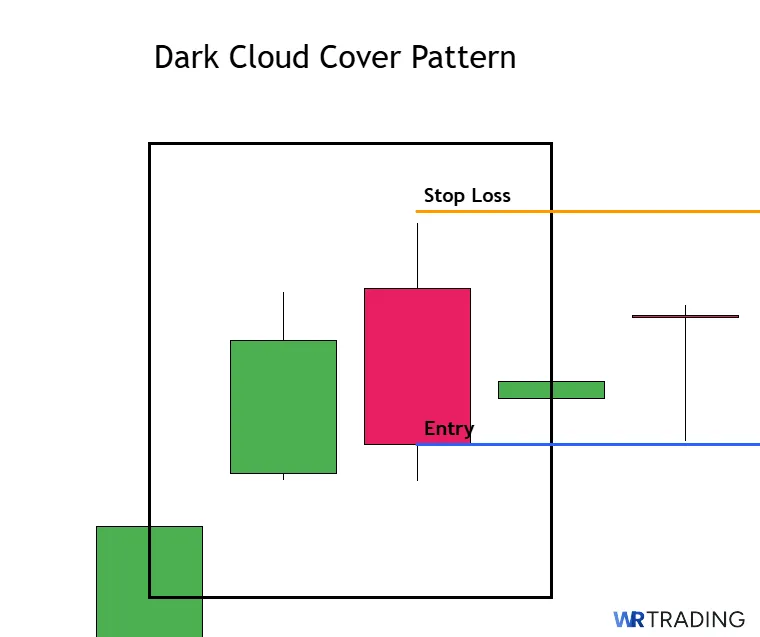
Entering at this point offers the advantage of maximizing the potential downside while keeping the risk manageable. Place the stop-loss just above the high of the second red candle, which acts as a natural invalidation level if the price breaks above it.
Alternatively, traders preferring higher confirmation might opt to enter after observing slight bearish continuation below the second candle’s closing price. Using this more conservative entry method ensures that the bearish move is genuinely underway, but the downside is that it might slightly reduce the potential risk-reward ratio.
Wait For A Confirmation Or Not
Deciding whether to wait for additional confirmation after the Dark Cloud Cover forms can significantly impact the trade’s success and risk exposure. Aggressive traders who prioritize early entries might initiate positions immediately, relying solely on the candle structure and reversal evidence provided by the pattern. This approach allows traders to enter positions closer to reversal peaks, receiving more significant moves early in their development.
On the other hand, conservative traders often wait for additional confirmations such as a bearish indicator signal, increased bearish volume, or subsequent bearish candle closes before entering trades. Indicators like MACD bearish crossovers, RSI dropping below the 50 midpoint, or price falling below a short-term moving average (such as the 20-period EMA) are excellent confirmation tools for the Dark Cloud Cover Pattern.
Choosing this method reduces the risk of false signals at the cost of slightly delayed entry points, which can impact profit potential.
Choose Your Trading Take Profit
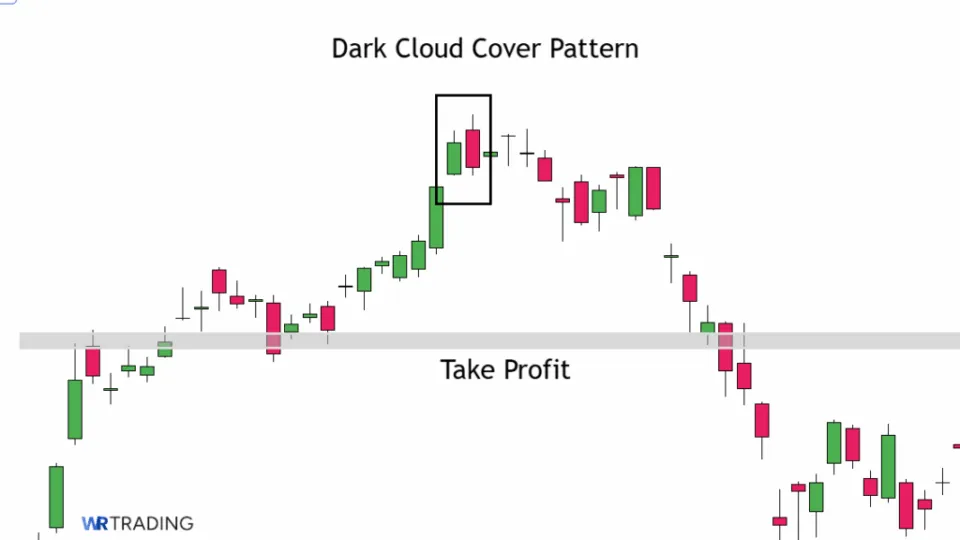
A common and highly effective method for exit points for the Dark Cloud Cover is targeting the nearest support levels identified through prior market structure. Aim for levels where the price previously consolidated, formed swing lows, or encountered strong buying interest historically, providing logical and achievable profit objectives.
Furthermore, traders frequently incorporate Fibonacci retracement levels to establish additional price targets. Commonly used Fibonacci levels, such as 38.2%, 50%, and 61.8% retracements of the preceding bullish move, offer well-defined profit-taking zones.
Alternatively, traders can manage positions dynamically, progressively moving their stop loss to lock in profits as the price continues downward, ensuring protection of accumulated gains even if the price reverses unexpectedly.
(Learn To Trade And Read Candlestick Patterns Like A Pro)
Which Trading Strategies Are Suitable For The Dark Cloud Cover Pattern?
Traders can utilize multiple strategies for the Dark Cloud Cover pattern, which enhance its accuracy and profitability. These include approaches based on momentum indicators, price-volume analysis, and moving average confirmations. Each strategy outlined below guides traders through identifying, confirming, and executing trades effectively with this pattern.
- RSI Divergence Strategy
- Volume Confirmation Strategy
- Moving Average Break Strategy
1. RSI Divergence Strategy
An effective strategy involves combining the Dark Cloud Cover with bearish divergence signals on the Relative Strength Index (RSI). First, confirm an upward price movement accompanied by RSI levels above 70, highlighting overbought market conditions. A subsequent bearish divergence occurs if the price makes higher highs while RSI creates lower highs, signaling weakening bullish momentum despite rising prices.
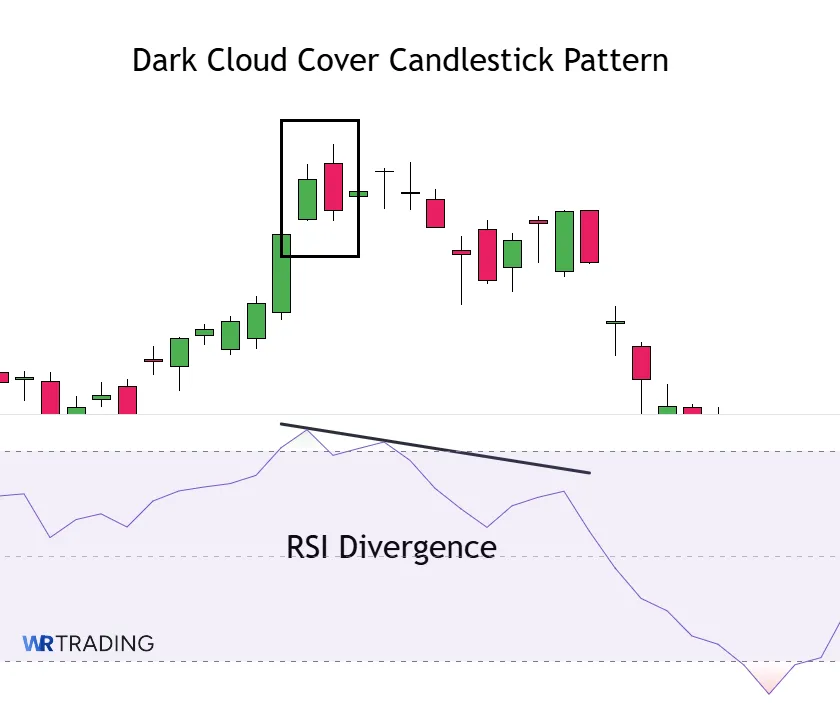
Then use the appearance of the Dark Cloud Cover as the definitive signal to initiate short positions. This dual confirmation method ensures higher reliability, reducing false entries while clearly defining trade risk. Managing the trade with clearly defined RSI targets, such as a return below the midpoint (50) or oversold territory (below 30), helps optimize exits and enhances overall performance.
2. Volume Confirmation Strategy
Look for a significant increase in trading volume during the formation of the second bearish candle of the Dark Cloud Pattern, showing high selling pressure underpinning the reversal. Increased bearish volume reinforces the validity of the reversal signal, significantly increasing the trade’s probability of success.
Upon confirming elevated bearish volume, enter short positions, ideally at the opening of the following candlestick. This strategy minimizes false signals, enhancing trade reliability due to the confirmation that sell orders are increasing. Maintaining attention to subsequent volume trends can further improve exit decisions, allowing you to remain short as long as bearish volume remains elevated and exiting when volume subsides.
3. Moving Average Break Strategy
Incorporating moving averages into the Dark Cloud Cover trading setup provides additional validation and structure for trades. Traders commonly use short-term exponential moving averages (EMA), such as the 20-period or 50-period EMA, as dynamic support levels during bullish trends. The appearance of the Dark Cloud Cover that coincides with a breakdown through these EMAs significantly strengthens the bearish reversal signal.
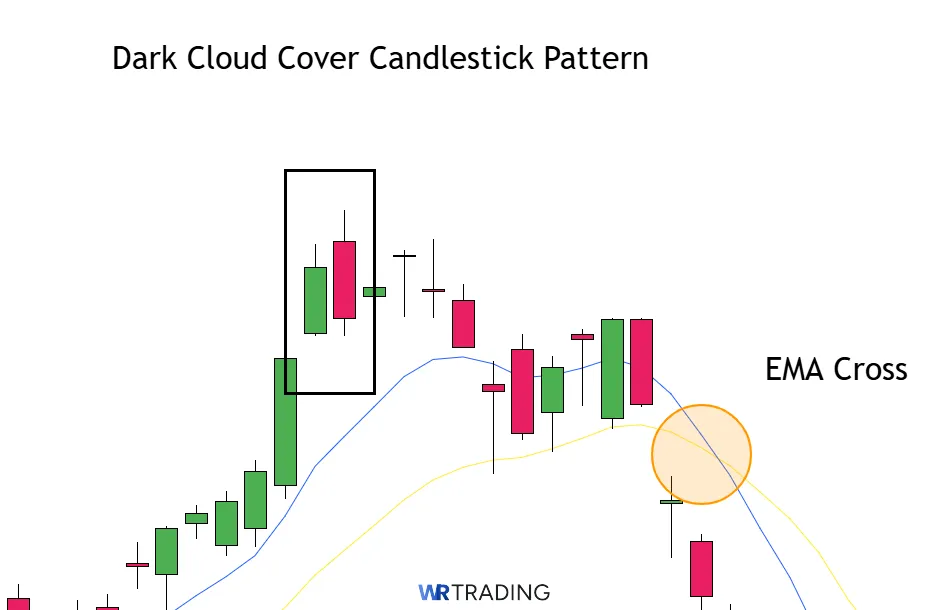
After confirming this EMA breakdown alongside the pattern formation, initiate short positions. The subsequent price action below these EMAs further validates the bearish direction, providing ongoing trade justification and guiding profitable exit points. This approach improves consistency in trading outcomes and risk management.
What Is The Success Rate Of The Dark Cloud Cover Candlestick Pattern?
According to historical backtesting and pattern research by Thomas Bulkowski, this setup holds a success rate around 60%. However, that number is not fixed and depends heavily on factors like market structure, timeframe, and how well the Dark Cloud Cover fits within a broader technical context. The pattern tends to perform best when there is high volume, and it forms after a clear bullish trend or near key resistance levels.
(Learn To Trade And Read Candlestick Patterns Like A Pro)
What Are the Pros and Cons of Trading the Dark Cloud Cover Candle Pattern?
The Dark Cloud Cover is great for spotting bearish reversals and easy to identify, making it one of the more beginner-friendly patterns to trade. However, trying to trade it with weak context or no prior bullish trends can lead to false signals that result in losing trades. Therefore, you should study the main benefits and downsides of the pattern before using it in live trading.
These are the main pros and cons of trading the Dark Cloud Cover:
Pros
- Clear Bearish Reversal Signal
- Easy to Identify Visually
- Defined Entry and Stop Levels
- Effective Near Resistance Zones
- Quick Setup with Minimal Delay
Cons
- Weak Context Makes It Unreliable
- Fails Without Midpoint Close
- No Confirmation Built In
- Prone to False Signals in Strong Trends
- Requires Strong Prior Trend
What Are The Advantages Of The Dark Cloud Cover Pattern?
The Dark Cloud Cover is one of the most well-known two-candle reversal patterns because of how clearly it signals a potential shift from bullish momentum to bearish pressure. These are the main advantages of the pattern:
- Clear Bearish Reversal Signal: The Dark Cloud Cover shows a strong transition from buyer strength to seller pressure within just two candles. The deep close into the first candle’s body confirms that bulls have lost control. It acts as a straightforward cue for a potential trend change.
- Easy to Identify Visually: The contrast between the bullish first candle and the strong bearish second candle stands out on the chart. Traders can quickly spot it without needing indicators or specialized tools. This helps streamline scanning and trade selection.
- Defined Entry and Stop Levels: It provides a natural entry below the second candle and a stop above its high. This structure gives traders a clear risk-to-reward framework. There’s no guesswork about where to place protective levels.
- Effective Near Resistance Zones: The Dark Cloud Cover gains strength when it forms around swing highs, previous supply areas, or trendline resistance. These zones already attract sellers, and the pattern acts as confirmation that the price is reacting. It increases confidence that the move will hold.
- Quick Setup with Minimal Delay: Because the Dark Cloud Cover only requires two candles, traders can act quickly without waiting through a long formation. This allows for more precise entries and less delay in capturing potential reversals. Fast-forming patterns are ideal in volatile markets.
What Are The Disadvantages Of The Dark Cloud Cover Pattern?
The Dark Cloud Cover can be a strong reversal signal in the right conditions, but it also has limitations that every trader should understand. These are the main disadvantages of using the pattern:
- Weak Context Makes It Unreliable: If the Dark Cloud Cover forms in a sideways or choppy market without clear directional bias, it often fails to follow through. Traders may misinterpret it as a top when it’s simply noise. Without trend context, the pattern loses its meaning.
- Fails Without Midpoint Close: The second red candle must close below the midpoint of the first for the setup to be valid. When this doesn’t happen, many traders still treat it as a signal and enter too early. This weak formation often leads to reversals that never play out.
- No Confirmation Built In: Unlike three-candle patterns that include confirmation within the setup, the Dark Cloud Cover only shows a potential reversal. Traders still need to wait for a follow-through candle or indicator support. Acting without confirmation increases the risk of premature entries.
- Prone to False Signals in Strong Trends: During aggressive bull trends, the pattern can appear but the price may resume higher shortly after. That leads to false short entries and drawdowns for traders who trusted the Dark Cloud Cover too early. Without trend exhaustion or confluence, it’s more likely to fail.
- Requires Strong Prior Trend: It only works well when it caps a strong bullish move. If the price has been flat or slowly rising, the pattern may reflect temporary hesitation instead of a full reversal. This causes lower-quality setups to be mistaken for high-probability signals.
Can the Dark Cloud Cover Pattern Have Failure Signals?
Yes, even though the Dark Cloud Cover is a reliable bearish reversal signal, it can still fail under certain market conditions or when misidentified. Traders need to watch for specific signs that weaken its reliability and increase the risk of false entries.
- Weak penetration into the prior candle: When the second red candle fails to close at least halfway into the body of the first green candle, the pattern loses its edge. This weak penetration suggests sellers lack the conviction needed to reverse the trend. Without deep intraday rejection, bullish pressure might continue instead of reversing.
- Forming during sideways markets: If the Dark Cloud Cover shows up during choppy or flat price movement rather than after a strong uptrend, it’s unreliable. Patterns formed without prior directional bias often produce false signals. Traders should avoid setups that form in indecisive or non-trending markets.
- Low volume on the reversal candle: The second red candle should ideally come with higher volume to confirm aggressive selling pressure. If volume drops during the pattern’s formation, it may reflect a lack of participation from institutional traders. This increases the chances that the reversal is short-lived or fake.
- Overshadowed by larger bullish structure: Sometimes, the Dark Cloud Cover appears within a broader bullish trend with no nearby resistance or overbought conditions. In such cases, the pattern may only cause a brief pullback before the bullish trend resumes. Assess the bigger picture before acting on the signal.
- Confirmation fails on the next candle: A strong confirmation should follow the Dark Cloud Cover, such as a third candle that continues lower. If the next candle gaps up or turns green, it invalidates the reversal signal. Lack of follow-through weakens the credibility of the pattern.
Which Indicators Can Be Combined With The Dark Cloud Cover Pattern?
To boost the reliability of the Dark Cloud Cover signal, many use technical indicators to confirm momentum shifts, overbought conditions, or volume strength. These tools help validate that the pattern is forming under the right context, improving trade accuracy and reducing false entries. Here are a few indicators that work well alongside the Dark Cloud Cover candlestick setup:
- Relative Strength Index (RSI): RSI is commonly used to confirm overbought conditions leading into a reversal. When the RSI is above 70 just before the pattern appears, it suggests that the market is stretched and due for a pullback. The bearish candle of the pattern adds a strong visual cue that momentum may be turning, helping traders confirm the short opportunity.
- Stochastic Oscillator: This momentum tool highlights potential trend exhaustion. When the %K and %D lines are above 80 and then cross downward, it reinforces the idea that buyers are losing strength. If this cross happens alongside the Dark Cloud Cover formation, it can provide excellent confirmation for entering a short setup.
- Volume: A spike in volume during the second candle of the Dark Cloud Cover confirms that sellers are stepping in forcefully. When this second candle forms with much higher volume than the first, it adds conviction to the pattern. Traders can use simple volume bars with no smoothing or complex settings needed.
- 20-Period Exponential Moving Average (EMA): The 20 EMA acts as a dynamic support during uptrends. If the second candle of the Dark Cloud Cover closes below this EMA, it suggests that the trend might be breaking. You can also use the EMA as a visual aid for stop loss or re-entry positioning.
- Average True Range (ATR): ATR does not signal direction but helps size the trade properly. A higher ATR reading when the Dark Cloud Cover appears means more volatility, and therefore stop losses should be placed a bit wider to avoid being hit by random price noise. A standard setting of 14 periods is sufficient for most swing trading setups.
- Bollinger Bands: When the bullish candle of the Dark Cloud Cover touches or breaches the upper Bollinger Band and the second candle closes deep inside the band, it often signals a reversal. This shows price exhaustion and a return to the mean. Using Bollinger Bands with a 20-period setting and a standard 2.0 deviation works well.
(Learn To Trade And Read Candlestick Patterns Like A Pro)
What Are Similar Patterns to the Dark Cloud Cover?
Several candlestick patterns share structural or behavioral traits with the Dark Cloud Cover. Some offer comparable reversal signals, while others reflect similar two-candle or multi-candle setups that traders can use to confirm bearish shifts. Below is a table listing 5 alternative candlestick patterns, focusing on their type, best use case, and main characteristics.
| Pattern | Type of Pattern | Best Use Case | Key Characteristic / Condition |
|---|---|---|---|
| Bearish Engulfing | Two-candle bearish reversal | Spotting sharp bearish reversals after a strong rally | The second red candle completely engulfs the previous green candle’s body, signaling a full rejection. |
| Evening Star | Three-candle bearish reversal | Confirming major reversals at tops of trends | Starts with a bullish candle, followed by a small-bodied candle, then a bearish candle that closes deep into the first. |
| Shooting Star | Single-candle bearish reversal | Catching failed bullish breakouts during rallies | Features a small body near the low and a long upper wick, signaling rejection of higher prices. |
| Hanging Man | Single-candle bearish reversal | Identifying weak bullish continuation setups | Appears after an uptrend with a small body and long lower wick, hinting at a loss of buying power. |
| Tweezer Top | Two-candle bearish reversal | Spotting repeated resistance at the same price level | Two candles with matching highs where the second fails to push higher, suggesting strong resistance. |
For more candlestick patterns, see our full PDF here!
What Is The Opposite Pattern Of The Dark Cloud Cover?
The Piercing Line is the opposite candlestick pattern to the Dark Cloud Cover. It is a bullish two-candle reversal setup that appears after a downtrend or strong bearish swing. The first candle is a long red candle that shows continued selling pressure, while the second green candle opens with a gap down and closes deep into the body of the first, above its midpoint.
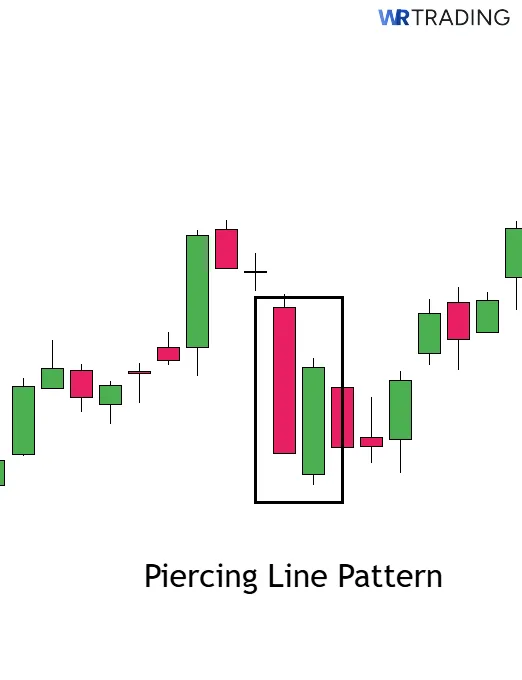
This reversal structure shows that buyers have stepped in aggressively after an initial gap lower, signaling that the bearish momentum has weakened. The deeper the second candle pushes into the previous red candle, the stronger the potential reversal. When combined with support levels, oversold indicators, or confirmation from volume, the Piercing Line becomes a useful pattern for timing long entries near the bottom of a trend.
What is the Difference between the Dark Cloud Cover pattern and the Piercing Line Pattern?
The Dark Cloud Cover and the Piercing Line pattern share a nearly identical structure but signal reversals in completely opposite directions. Both involve a strong initial candle followed by a second candle that gaps at the open and then closes deep into the body of the first. The difference is in the direction of the setup and the message it provides. The Dark Cloud Cover marks a potential top, while the Piercing Line suggests a bottom may be forming.
The psychology behind the moves also flips. In the Dark Cloud Cover, buyers initially push higher, but then sellers overpower the move and drag the price back down. In the Piercing Line, sellers start strong but lose power as buyers reclaim control with a decisive close. Both patterns are also most effective when they form near key technical levels and are confirmed with follow-through on the next candle.
| Section | Dark Cloud Cover | Piercing Line |
|---|---|---|
| Construction | First candle: strong green close after an uptrend. Second candle: red, opens above and closes deep into the green candle. | First candle: strong red close after a downtrend. Second candle: green, opens lower and closes well into the red candle. |
| Forecast | Signals a shift to bearish sentiment and potential downside reversal. | Signals a shift to bullish sentiment and potential upside reversal. |
| Type of Pattern | Two-candle bearish reversal. | Two-candle bullish reversal. |
| Trend Prior to Pattern | Appears at the top of an uptrend or extended rally. | Appears at the bottom of a downtrend or steep selloff. |
| Opposite Pattern | Piercing Line. | Dark Cloud Cover. |
(Learn To Trade And Read Candlestick Patterns Like A Pro)
What is the Difference between the Dark Cloud Cover pattern and the Bullish Engulfing Pattern?
The Dark Cloud Cover and Bullish Engulfing are both two-candle reversal patterns, but they appear in completely opposite market conditions and signal different directional shifts. The Dark Cloud Cover forms after a bullish advance and warns of a potential downside reversal, whereas the Bullish Engulfing appears after a bearish trend and suggests a shift to the upside.
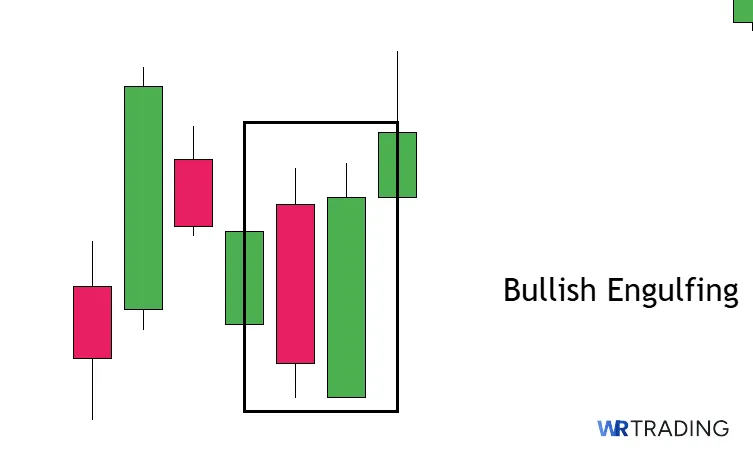
Structurally, the Dark Cloud Cover begins with a strong green candle followed by a red candle that opens above the prior close and then closes deep into the green body. In contrast, the Bullish Engulfing starts with a red candle and is followed by a green candle that opens lower but fully engulfs the previous body by closing above its high.
Their meanings and trading implications also differ. The Dark Cloud Cover indicates fading buying strength and the emergence of selling pressure, often leading traders to prepare short positions or exit longs near key resistance. The Bullish Engulfing pattern signals that sellers have lost momentum and buyers are stepping in, making it a possible long entry near support or after a steep decline.
| Section | Dark Cloud Cover | Bullish Engulfing |
|---|---|---|
| Construction | First candle: a strong green candle with a close near its high, showing clear bullish strength. Second candle: a red candle that opens above the first candle’s close and closes deep into its body, often below the midpoint. | First candle: a strong red candle closing near its low, showing active selling pressure. Second candle: a green candle that opens below the first candle’s low and closes above its high, completely engulfing the previous body. |
| Forecast | Bearish reversal suggesting a shift to downside momentum. | Bullish reversal suggesting a potential upward move. |
| Type of Pattern | Two-candle bearish reversal. | Two-candle bullish reversal. |
| Trend Prior to Pattern | Appears after an uptrend or a strong bullish swing. | Appears after a downtrend or strong selling pressure. |
| Opposite Pattern | Piercing Line. | Bearish Engulfing. |
What Are The Limitations Of The Dark Cloud Cover?
The Dark Cloud Cover can be a helpful early warning sign of bearish pressure, but it’s far from perfect. In certain environments, it may produce misleading signals or lack the strength to trigger meaningful reversals. Knowing its limitations helps traders apply it more carefully and avoid common traps.
- It can form during sideways markets and fail to lead to any breakout.
- Weak volume can reduce its reliability and conviction.
- Without confirmation from the next candle, the signal often lacks follow-through.
- If the second candle doesn’t close past the midpoint, the setup loses strength.
- In strong trends, it may appear but still get overpowered by bullish momentum.
Learn Pattern Trading With the WR Trading Mentoring
Traders who rely solely on pattern recognition often find themselves misreading setups or reacting emotionally to price movements. Learning how to trade the Dark Cloud Cover effectively takes more than just spotting the red candle cutting into green. Through WR Trading Mentoring, students go beyond visuals and start understanding the conditions that make a pattern worth trading, such as timing, confirmation, market context, and risk control.
Mentorship sessions teach you how to connect price action with bigger-picture technical factors like momentum shifts, support and resistance, volume dynamics, and trend exhaustion. This transforms the Dark Cloud Cover into part of a complete strategy, not just an isolated signal.
You’ll learn how to avoid weak setups, validate strength behind bearish pressure, and make confident entries backed by logic. If you’re serious about refining your edge and trading with discipline, WR Trading is where you build those real-world skills.
(Learn To Trade And Read Candlestick Patterns Like A Pro)
Conclusion: The Dark Cloud Cover Pattern Is a Quick and Clear Bearish Warning
The Dark Cloud Cover is a powerful pattern for traders seeking a fast, visual signal that bullish momentum may be weakening. Its two-candle structure gives immediate insight into a potential reversal near market tops, allowing short sellers and profit-takers to act quickly. When used with proper context, like trend exhaustion or resistance zones, the setup becomes even more effective.
This pattern works best when paired with confirmation tools like RSI, MACD, or volume. It is not meant to be traded blindly, but when part of a structured system, it can offer great timing for entering short positions or tightening up long trades.
FAQs: Most Asked Questions on the Dark Cloud Cover Candlestick Pattern
When Is a Dark Cloud Cover Most Effective?
The Dark Cloud Cover is most effective after a strong uptrend or extended bullish move. The pattern carries more weight when it appears near resistance or after overbought conditions. Clean structure and supporting context are key to its success.
When Is a Dark Cloud Cover Most Effective?
The Dark Cloud Cover is most effective after a strong uptrend or extended bullish move. The pattern carries more weight when it appears near resistance or after overbought conditions. Clean structure and supporting context are key to its success.
Does Volume Matter When Trading a Dark Cloud Cover?
Yes, volume can help confirm the strength of the reversal signal. A spike in volume during the second red candle shows that sellers are stepping in with conviction. Low volume may reduce the reliability of the pattern.
How Deep Should the Second Candle Close for the Pattern to Be Valid?
Ideally, the red candle should close below the midpoint of the green candle. The deeper the close into the first candle, the stronger the signal. Shallow closes may indicate weaker selling pressure.
Is the Dark Cloud Cover a Reversal or Continuation Pattern?
The Dark Cloud Cover is a bearish reversal pattern. It signals that a previously strong bullish move may be coming to an end. Traders use it to anticipate downside momentum by placing short orders.
What Timeframes Does the Dark Cloud Cover Best Work Best On?
The Dark Cloud Cover is most effective on the 1-hour, 4-hour, and daily charts. Shorter timeframes may produce more noise, while longer ones help filter out weak signals. Always pair it with volume or trend context for best results.