The Hanging Man is a single-candle bearish pattern that forms at the top of an uptrend and signals a potential price reversal. It’s defined by a small real body near the top of the range and a long lower shadow, showing intraday selling pressure despite a strong open.

The traditional hanging man pattern is a bullish to bearish reversal concept with the following structure:
How The Hanging Man Candlestick Pattern Is Structured:
- Construction: The pattern is constructed with two candles
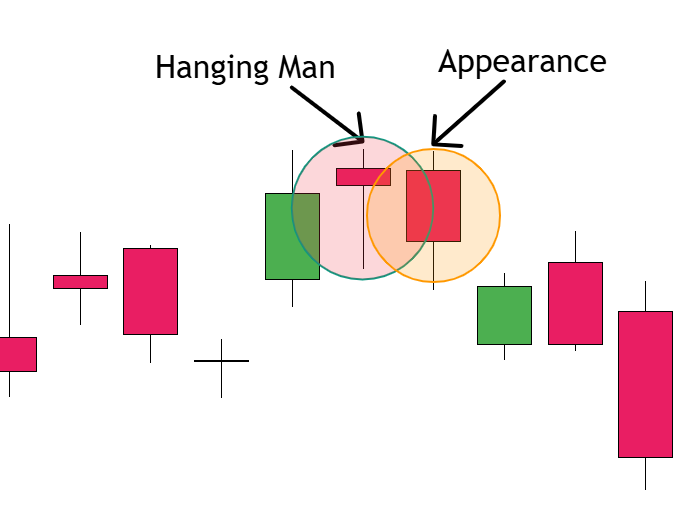
- First Candle: Part of a clear uptrend, showing continued bullish momentum
- Second Candle: The candle opens significantly higher, and trades much lower during the session, eventually closing near the opening price, resulting in a small real body at the upper end of the trading range
- Forecast: Expect prices to move lower following confirmation
- Type of Pattern: Bearish Reversal
- Trend prior to the Pattern: Uptrend
- Opposite Pattern: Hammer
- Stop-loss placement: Above the high of the hanging man candlestick
In this article, we at WR Trading will break down its structure, trading setups, key types, usage, and examples. We will also discuss how to boost your edge using stats, indicators, and strategy.
What Is A Green Hanging Man Pattern?
A green Hanging Man is a candlestick with a small green body, a long wick below the green body, and little to no wick above the green body, such that the resulting candlestick sort of looks like a man with a green torso. All three criteria must be present by the time the candlestick closes for it to be considered a green hanging man.

This pattern is formed when the market opens low, dips significantly during the session, but then rallies to close above the opening price. It typically occurs at the top of an uptrend, signaling a potential shift in momentum.
The structure may look bullish, but the meaning flips when placed in the right context. It tells us that sellers stepped in hard, and despite a recovery, that pressure could continue. We see this as a warning shot, not a standalone signal, but one that demands attention and confirmation.
What Is A Red Hanging Man Pattern?
A red Hanging Man is a candlestick with a small red body, a long wick below the red body, and little to no wick above the red body, such that the resulting candlestick looks like a man with a red torso. All three conditions must be present by the time the candlestick closes for it to be considered a red hanging man.

A red Hanging Man forms under the same conditions as the green one, but closes below the opening price. This shows that sellers hit hard and stayed in control by the close. This version is often viewed as more bearish because the close reinforces the selling sentiment. We treat the red Hanging Man as a higher probability signal for a potential reversal, especially when it appears on key resistance levels or after an extended uptrend.
What Is The Difference Between A Bullish And A Bearish Hanging Man Pattern?
The difference between a bullish and bearish Hanging Man pattern lies in the candle’s color and how aggressively sellers controlled the session.
| Bullish Hanging Man | Bearish Hanging Man |
|---|---|
| A bearish Hanging Man has a red body. Price closed below its opening price, indicating that sellers not only entered but also maintained control until the close. | A bearish Hanging Man has a red body. Price closed lower than it opened, showing that sellers not only stepped in but stayed in control until the close. |
We treat both as bearish signals in terms of market implication but we give more weight to the red version for its stronger reversal pressure. Neither should be traded blindly. Confirmation is key.
What Is The Meaning Of The Hanging Man Pattern?
The meaning of the Hanging Man candlestick pattern is tied closely to market psychology and timing. It tells us the uptrend may be running out of steam, and sellers are stepping in with force.

Even though the candle forms during an uptrend, the long lower shadow reveals that the price dropped hard during the session. Buyers managed to pull the price back up but the damage is done. The imprint of price action reveals weakening bullish momentum and introduces doubt in the trend.
This gives us a directional bias. We interpret this pattern as a shift in sentiment, one where smart money may begin scaling out or even shorting. Alone, the Hanging Man is a signal.
Combined with confirmation and strong technical zones, it becomes a powerful technical analysis component worth acting on.
How To Trade The Hanging Man Candlestick Pattern?
The hanging man candlestick pattern should not be traded on its own. It is best to trade it in conjunction with other reversal signals on clear support and resistance zones. Below is our step-by-step strategy to execute this pattern effectively in forex, stocks, or crypto markets.
How To Identify The Hanging Man Candlestick Pattern
To identify the Hanging Man, start by scanning for candles with these features:
- Small real body at the top (either red or green)
- Long lower shadow, at least 2x the body size
- Appears after an uptrend
- Forms on or near a key resistance level, Fibonacci zone, supply area, or round number

We recommend combining price action with resistance zones to improve accuracy. You can also watch for confluence with other reversal signals, such as RSI divergence or bearish chart patterns.
Wait For The Appearance Of The Hanging Man Pattern
Don’t rush. Let the candle occur fully on a significant level. The pattern is only valid after the candle closes and confirms the wick and body shape. Acting before that may lead to premature entries and avoidable losses.
Where Does A Hanging Man Candlestick Pattern Appear?
The Hanging Man pattern only has trading value when it appears:
- At the end of an uptrend
- Near a historical resistance zone or supply area
- After a series of strong bullish candles
- On daily, 4H, or 1H charts (avoid lower timeframes for signal clarity)
It does not occur in a downtrend. If you see a similar structure in a downtrend, you’re looking at a Hammer which has the opposite implication.
Open Your Trade – Entry Point (Setup Stop Loss / Position Size)
Once the Hanging Man candle closes, wait for confirmation. A strong bearish candle usually follows, and only then do we consider entry.
Our Entry Setup for the Hanging Man:
- Sell entry: 1–2 pips below the Hanging Man’s low
- Stop loss: Above the high of the Hanging Man candle
- Position size: Use proper risk management (e.g., 1–2% of your trading account per trade)

This tight setup helps limit risk while maximizing the reward potential if the reversal plays out.
Choose Your Trading Take Profit (Goal Of The Setup)
Every Hanging Man trade should have a target based on technical logic, not emotion. Don’t just enter and hope.
- Use support zones, previous lows, or measured move projections.
- Consider ATR (Average True Range) to estimate realistic price movement.
- Use trail stops if momentum stays strong.

What Is The Target Of The Hanging Man Candlestick Pattern?
There’s no fixed pip count. We target a 1:2 or 1:3 risk-to-reward ratio, depending on the setup strength. For example:
- In a case where the stop loss is 20 pips, aim for 40–60 pips minimum
- For stocks, set targets near the next major support level or consolidation zone
- In forex, pair the pattern with volatility metrics to size realistic targets.
- Realistically, you can also set your target to the next swing high or low.

The key is to stay consistent, don’t let one pattern dictate your whole risk model.
(Learn To Trade And Read Candlestick Patterns Like A Pro)
What Are The Pros And Cons Of Trading The Hanging Man Pattern?
Like all tools in technical analysis, the Hanging Man pattern has strengths and limitations. We trade this setup across forex, stocks, and crypto, and here’s how we break it down:
Pros
- A clear structure that makes it easy for traders to identify at any level.
- Often forms at the top of strong uptrends, offering early reversal potential.
- Useful when combined with other tools like RSI, MACD, or volume analysis
- Defined entry and target levels improve trade planning.
- Fits well within high-probability price action systems
Cons
- Requires confirmation; trading it on its own can lead to a false signal
- Appears frequently but many don’t lead to significant moves
- Vulnerable to chop and noise on lower timeframes
- Not all green or red Hanging Man candles have the same weight
- Emotional trading around this pattern can lead to premature entries
What Is The Success Rate Of The Hanging Man Pattern?
Our research shows that the Hanging Man pattern is confirmed 37.2% of the time across 4,120 markets. Historically, it confirms within 4.3 candles or gets invalidated within 3.6 candles. Once confirmed:
- It hits a 2:1 risk-reward target 35.8% of the time
- It retests its entry-level 81.8% of the time.
- The expected outcome is $7.5 per $100 risked, excluding fees.
Additional Stats (Based on data across all market types):
- Theoretical performance: Bearish reversal
- Tested performance: Bullish continuation 59% of the time
- Overall rank: 87 out of 103 candlestick patterns
- Best 10-day performance: –3.60% in a bear market with a down breakout
- Best confirmation rate: 86% (in a bear market’s down breakout)
How To Improve The Accuracy Of The Hanging Man Pattern
Here’s how to boost the hit rate of your Hanging Man setups:
- Combine it with RSI (70+), MACD divergence, or Bollinger Band rejection
- Look for the pattern to occur in major resistance or institutional zones.
- Avoid low-volume sessions as volume provides context for the candle’s psychology.
- Only enter after strong bearish confirmation (engulfing candle or breakdown)
- Stick to higher timeframes (1H minimum) for better structure and clarity.
These filters significantly increase your chances of catching a clean reversal instead of a trap.
What Are Possible Strategies For The Hanging Man Candlestick Pattern?
The most effective strategies for the Hanging Man Pattern use it within a larger framework, not as a standalone signal. Below are two proven strategies we use internally and in our mentorship programs:
Strategy 1: Coupling the Hanging Man signal with RSI Divergence
- Wait for the Hanging Man to occur at a key resistance or supply level
- Use RSI (14) and look for bearish divergence (meaning that when the price makes a new high, RSI doesn’t).
- Enter after the candle closes and a bearish confirmation follows.
- Set your stop loss above the pattern high and your target at the nearest support zone.
- Works best on 1H, 4H, or Daily timeframes

Strategy 2: Hanging Man + Bollinger Band Rejection
- Set Bollinger Bands to (20,2)
- Spot a Hanging Man that appears at the upper band during an uptrend.
- Confirm with volume drop or MACD histogram weakening.
- Take your entry below the pattern’s low
- Set the target at the middle or lower Bollinger Band.

This setup is highly effective during extended rallies where mean reversal is likely.
What Are The Best Indicators To Combine With The Hanging Man Candlestick Pattern?
Some of the best indicators to combine with the Hanging Man pattern are RSI, MACD and Bollinger Bands. To increase your success rate, here are the most reliable technical analysis tools we recommend pairing with the pattern:
| Indicator | Setting | Purpose |
|---|---|---|
| RSI | 14 period | Look for divergence and overbought conditions |
| MACD | 12, 26, 2009 | Catch early momentum shifts or crossovers |
| Bollinger Bands | 20 period, 2 standard deviations | Detect volatility tops and mean reversion zones |
| Fibonacci Retrace | Use standard levels | Confirm resistance levels (0.618, 0.786) |
| Volume Profile | Session/Visible Range | To spot where institutions may be unloading positions |
The combination of these indicators with the Hanging Man gives you a more structured, higher-probability trades. These are tools we actively teach our traders to use during live sessions.
What Are Alternatives To The Hanging Man Pattern?
There are several alternatives to the Hanging Man Pattern, such as the Shooting Star or Evening Star. The Hanging Man isn’t the only pattern used to spot potential reversal zones. We encourage traders to understand other types of candlestick patterns that provide high-value signals and pick the top two that they can easily recognize, which are most suitable for their trading style.
Here are five reliable alternatives to the Hanging Man:
- Shooting Star: A bearish reversal candle with a long upper wick
- Evening Star: A 3-candle bearish reversal at the top of an uptrend
- Bearish Engulfing: A strong two-candle bearish reversal pattern
- Doji: Signals indecision and possible reversal when formed at the top.
- Dark Cloud Cover: A two-candle setup signaling momentum shift to the downside

All of these patterns can occur at key levels and provide strong setups when confirmed with technical analysis. More formations can be found in our Candlestick Bible PDF.
What is the Difference Between a Hanging Man and a Hammer Candlestick Pattern?
The key difference of the Hanging Man and the Hammer lies in where they form and what psychology they reflect. Altthough they look nearly identical, both pattern have different meanings and uses:
| Pattern | Trend Context | Signal Type | Color | Opposite |
|---|---|---|---|---|
| Hanging Man | After uptrend | Bearish reversal | Green or Red | Hammer |
| Hammer | After downtrend | Bullish reversal | Green or Red | Hanging Man |
A Hanging Man appears at the top of a rally and warns of potential weakness, while the Hammer appears at the bottom of a drop, suggesting buyers are stepping in.
What Is A Reverse Hanging Man Pattern?
There is no formal “Reverse Hanging Man,” but the candlestick pattern that most likely fits the description of a “reverse hanging man” pattern is the Hammer or the Inverted Hammer.
Here’s why:
- Hammer: This pattern appears at the bottom of a downtrend and has the same structure as a Hanging Man (small body at the top, long lower shadow) but signals a potential bullish reversal. It’s essentially the “reverse” in terms of its implications for the trend.
- Inverted Hammer: This pattern also appears at the bottom of a downtrend and signals a potential bullish reversal. It has a small body at the bottom and a long upper shadow, making it look like an upside-down Hammer or a “reverse” of the Hanging Man’s shadow orientation.

Both patterns warn of potential trend shifts to the upside.
Learn Pattern Trading With The WR Trading Mentoring
At WR Trading, we don’t just teach candlestick patterns, we show you how to master them inside a real trading system. Our WR Trading Mentoring Program is built to help you become confident in reading price action, using structured pattern recognition, and combining tools like the Hanging Man, support/resistance, volume, and momentum indicators in live markets. Here’s what you get in the mentorship:
- Weekly live trading sessions with our pro traders
- Personalized chart reviews and breakdowns
- Strategy templates for patterns like Hanging Man, Engulfing, and more
For people who are serious about becoming a profitable trader, our community is where you’ll sharpen your edge. Apply through our site and take your trading to the next level with us.
(Learn To Trade And Read Candlestick Patterns Like A Pro)
Conclusion
The Hanging Man candlestick pattern is one of the simplest tools to spot likely turnarounds in an uptrend. It ought not to be applied by itself, but merged with major technical analysis such as the use of RSI, MACD, and volume indicators. When utilized well, this pattern can produce a success rate of 37,2 – 86%. With proper risk management and a firm strategy, it can be a useful tool in the hands of any committed trader.

