The dragonfly doji is a one-candle neutral pattern with a bullish directional bias. On the price chart, it resembles the capital letter “T” and is said to look like a dragonfly, hence the name. Its extremely small or even non-existent upper wick, combined with its noticeably long lower wick, reflects buyers stepping in to catch the price at lower levels, effectively preventing it from falling any further. This is why many traders consider it a bullish signal and a potential early indication of a trend reversal (serving as a signal tool for reversal trading strategies) when it appears during an ongoing downtrend. Nevertheless, due to its identical or nearly identical opening and closing prices, it is still classified as a doji variant.
Having said this, we personally do not advise viewing it as a decisive bullish reversal pattern on its own, as it is still a variant of the doji, which is inherently indecisive. This is especially true when compared with stronger and more definitive bullish reversal patterns, such as bullish engulfing or a morning star. Moreover, based on our trading experience, the dragonfly doji tends to be largely unreliable when viewed in isolation and without confirmation from another technical analysis tool or a clear confirmation candle.
Key Facts and Specifications of the Dragonfly Doji Pattern:
- Type of Pattern: Neutral one-candlestick pattern with bullish directional bias
- Pattern Construction
- Body: Must be extremely thin (visually, it looks like a small horizontal line)
- Upper Wick/Shadow: Must be extremely small or even non-existent
- Lower Wick/Shadow: Must be relatively long
- Trend Prior to the Pattern: It must appear during an ongoing downtrend. Otherwise, it loses significance if it forms during an uptrend or a sideways (non-trending) market.
- Trend Forecast: It can be a mere pause before the downtrend continues, or a sign of growing bullish pressure at lower price levels. Furthermore, it points to a potential trend reversal to an uptrend if followed by a confirmation candle.
- Opposite Pattern: The “gravestone doji,” which is a doji variant with a long upper wick and an extremely small or non-existent lower wick. Visually, it looks like an inverted letter “T.”
- Stop Loss Placement:
- Aggressive/Tighter Stop Loss: Just below the “confirmation candle” following the dragonfly doji (we will illustrate this later)
- Conservative/Wider Stop Loss: Further below the dragonfly doji’s lower wick
(Learn To Trade And Read Candlestick Patterns Like A Pro)
How Does the Dragonfly Doji Form?
A valid dragonfly doji must appear during an ongoing downtrend. On the price chart, this pattern is represented by a single candlestick where the opening and closing prices are identical or nearly identical, forming a very narrow body. During that same period, the price drops significantly lower but manages to recover near its opening level by the close. This results in a noticeably long lower wick, with little to no upper wick formed.
Visually, it takes the shape of the letter “T.” It is important to note that this pattern must appear during a downtrend for it to carry any real significance. This is because if it forms during an uptrend, it merely aligns with the existing bullish sentiment. And if it appears during a sideways or non-trending phase, then the pattern loses meaning, as there is no dominant market direction to begin with.
What Does the Dragonfly Doji Pattern Mean?
The dragonfly doji, as a doji variant, carries an inherently indecisive nature, reflected in its opening and closing prices being similar or nearly similar. That said, compared with a standard or normal doji, which is completely neutral, the dragonfly doji carries a bullish directional bias due to its unique visual appearance. Essentially, its long lower wick shows how sellers initially pushed the price lower, only for buyers to step in and push it back up near the opening level.
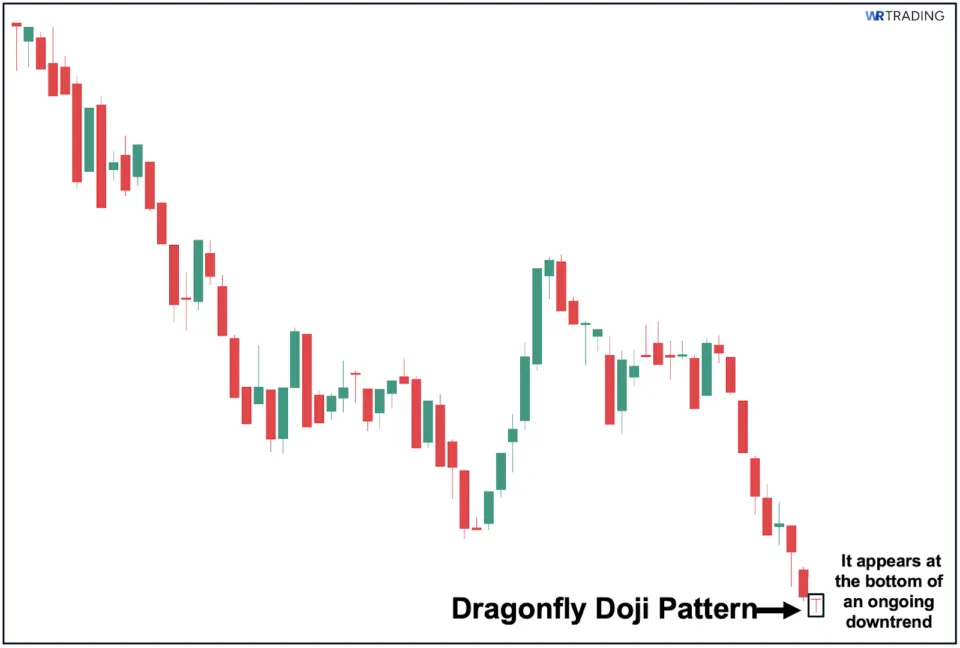
From a market psychology standpoint, this reflects a rejection of lower prices, suggesting that either selling pressure is fading or, more notably, buying pressure is starting to build as buyers begin to defend the lows. Additionally, if the dragonfly doji forms at the bottom of a downtrend, especially after reaching a new low, it may signal that the price has found a key or major support level that is preventing it from falling any further.
That being said, the dragonfly doji is still a type of doji at the end of the day and should not be considered a strong bullish reversal pattern on its own. As a matter of fact, it is generally an unreliable bullish reversal signal unless it is backed by a strong bullish follow-up candle or at least validated by another technical confirmation tool.
How to Identify the Dragonfly Doji Pattern?
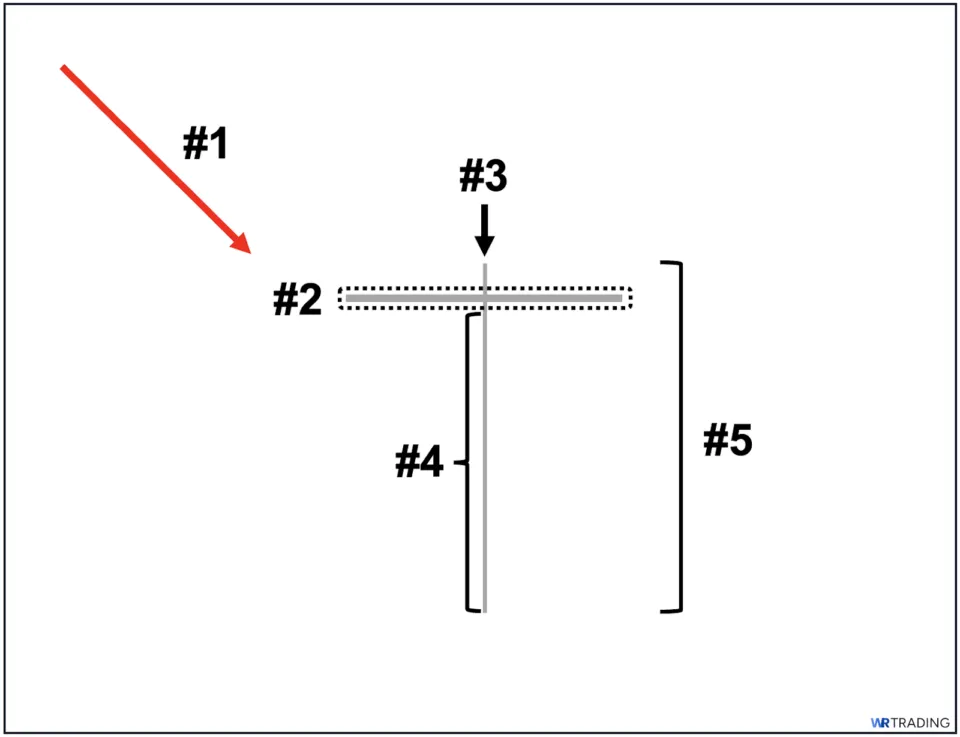
For it to be a valid and actionable candlestick pattern, it must exhibit the following five key characteristics when it forms on a price chart:
- Chart Placement: It must appear during an established downtrend.
- Candle’s Body: It must be extremely slim/thin (representing the identical or nearly identical opening and closing prices).
- Candle’s Upper Wick/Shadows: It must be extremely short or even non-existent.
- Candle’s Lower Wick/Shadows: It must be noticeably long.
- Overall Appearance: Overall, it must look like a capital letter “T” or a “dragonfly” (hence the name).
(Learn To Trade And Read Candlestick Patterns Like A Pro)
What is an Example of the Dragonfly Doji Pattern?
Here, we can see an example of a valid dragonfly doji pattern and how it can be effectively used in trading. As shown, there was a prevailing downtrend that led to the appearance of the dragonfly doji. The price then opened significantly lower, as indicated by the gap down from the previous candle, and continued to move even further downward, reaching a new low for the downtrend. This clearly shows the initial bearish pressure.
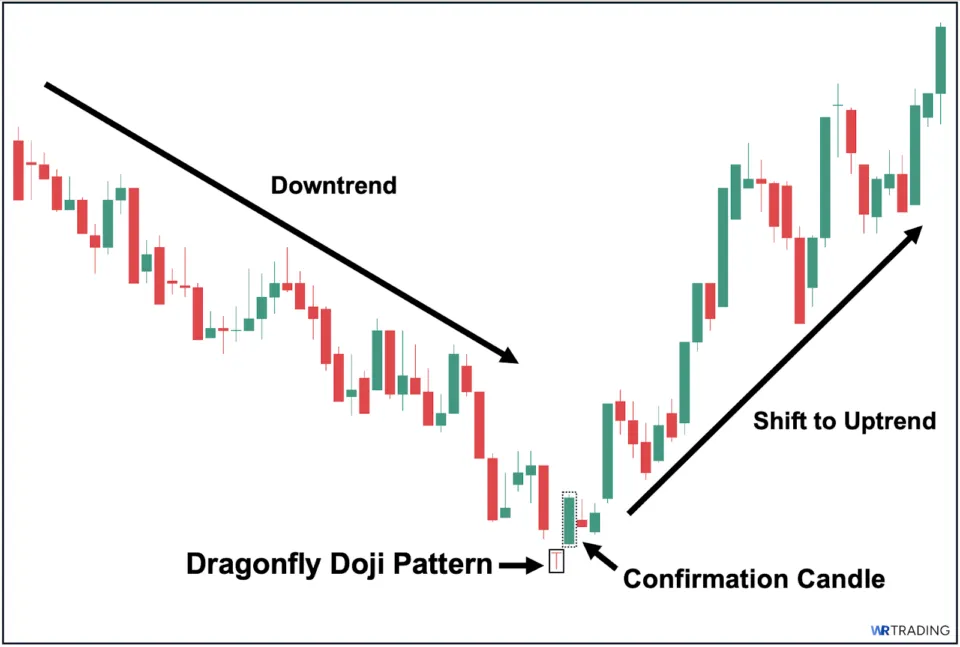
Nevertheless, despite the apparent bearish pressure driving the price lower, buyers eventually stepped in and pushed the price back near its opening level, resulting in the visual appearance of the dragonfly doji as buyers firmly rejected any further move to the downside.
That said, while the dragonfly doji suggests a bullish directional bias, its appearance alone is not enough to decisively signal a potential trend reversal. Fortunately, in this case, the pattern was immediately followed by a long bullish candle that closed even higher, providing confirmation that market sentiment may have shifted and a trend reversal could be underway. Eventually, the reversal played out as the bullish rally developed into a new uptrend.
How to Trade the Dragonfly Doji Pattern: A Comprehensive Guide
The following is a simple 5-step process you can follow to begin trading forex, stocks, and other assets using the dragonfly doji pattern:
Step 1: Identify a Valid Dragonfly Doji Pattern
Before anything else, make sure the dragonfly doji is valid in the first place. Remember that the pattern only holds weight when it appears during a downtrend, just like in the example above. Therefore, you should only look for it when the price chart is clearly moving lower. Therefore, disregard similar-looking candles appearing either during an uptrend (as the trend already reflects a bullish directional bias) or in a sideways market (since there is no clear market sentiment at all).
Step 2: Wait for a Reversal Confirmation Candle to Identify Your Entry
Second, if you’re looking to use the dragonfly doji as a reversal strategy tool, then it is important to first wait for a confirmation candle to show up following the pattern. Remember that, on its own, the dragonfly doji is not a strong bullish reversal signal. Hence, for it to work as a decisive bullish reversal tool, it must be followed by a relatively long-bodied bullish (green) candle that decisively closes above the high of the dragonfly doji (such as shown in the image above), confirming a potential bullish reversal.
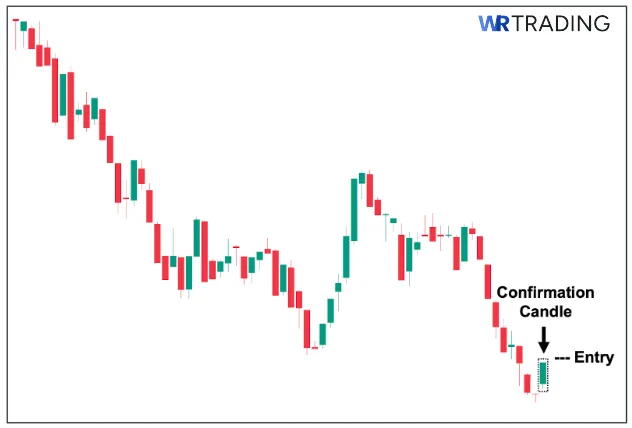
Note that the dragonfly doji is still a doji variant, and as such, is inherently indecisive by nature. This makes it a weak signal (despite its bullish directional bias) when viewed in isolation. Hence, waiting for a confirmation candle is crucial as it “confirms” or affirms the bullish shift in market sentiment. Afterward, you then need to pinpoint your specific entry point. For your entry, we recommend either:
- Aggressive Entry – Place your buy order at the closing price of the confirmation candle.
- Conservative Entry – Place your buy order after the price breaks further above the high of the confirmation candle.
(Learn To Trade And Read Candlestick Patterns Like A Pro)
Step 3: Determine Your Stop Loss (SL) Level
Third, after identifying your entry, you then need to choose your stop loss level, where you will exit the trade if the trade does not go in your favor (in this case, if it resumes on its original downward price trajectory instead of leading to a supposed trend reversal).
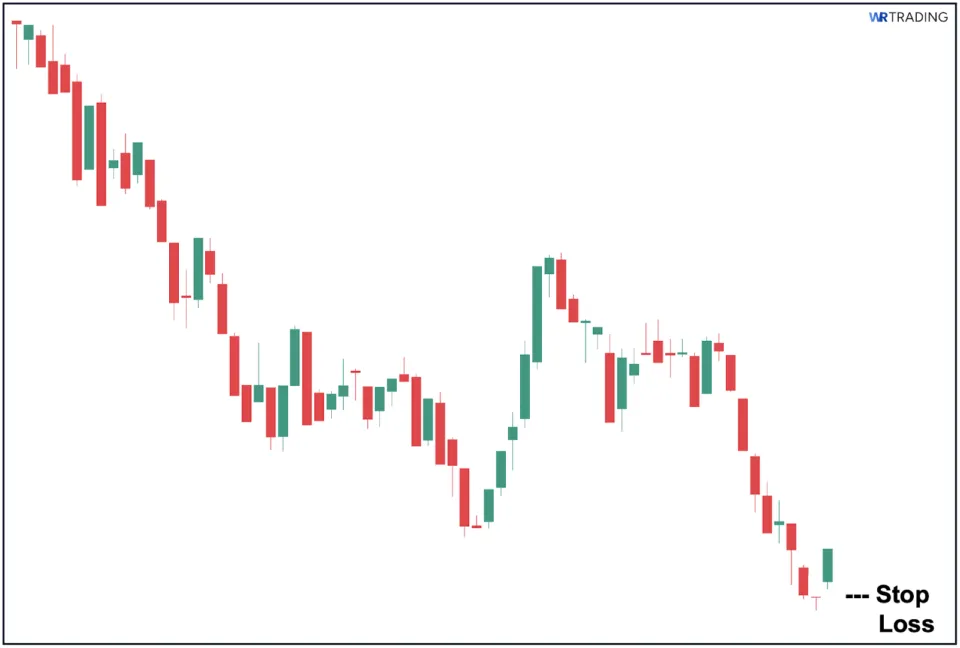
- Tighter Stop Loss – Place your stop loss just below the low of the confirmation candle.
- Wider Stop Loss – Place your stop loss below the dragonfly doji’s lower wick.
Step 4: Set Your Target Price (TP)
Fourth, you then need to pinpoint your target price/s where you will sell if the price moves in your favor (in this case, if a successful trend reversal to an uptrend followed). We recommend selling in tranches (i.e., placing at least two target prices) so you can take advantage in case the bullish rally extends past your first target price.
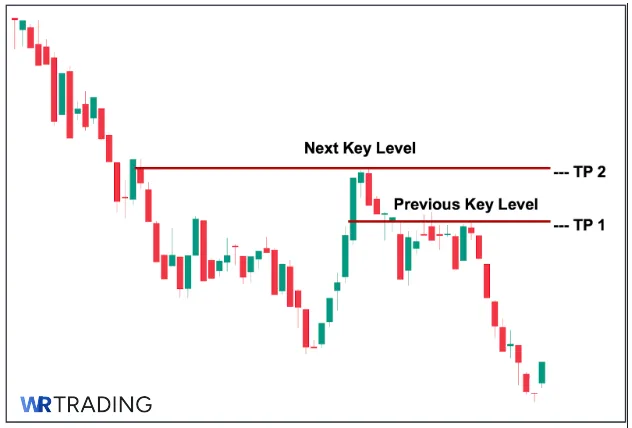
To illustrate, you can see in the image above that we set two target prices just below the key structural levels where the price may likely face significant selling pressure that could prevent further upward move. In our experience, we find setting two to three TPs is ideal, as long as your trade strategy allows for it.
Step 5: Open the Trade
Finally, the last step is to actually open the trade by simply executing the first four steps we mentioned: 1) check if the pattern is valid, 2) identify your entry point, 3) pinpoint your definitive stop loss level, and, of course, 4) identify your TP levels.
Furthermore, we recommend only taking trades with at least a 1:2 risk-reward ratio, meaning the potential upside should be at least twice the potential downside (i.e., the distance from your entry to your first TP should be at least 2x as long compared to the distance from your entry to your stop loss level).
Is the Dragonfly Doji Bullish or Bearish?
Compared with other stronger candlestick patterns, the dragonfly doji is not definitively bearish or bullish. This is because it is a type of doji, which is inherently indecisive by nature. Nevertheless, it is widely considered to have a bullish directional bias when it appears during an ongoing downtrend due to its visual characteristics. Still, it requires a confirmation candle or at least another confirmation tool before it can be treated as a strong enough bullish reversal signal.
(Learn To Trade And Read Candlestick Patterns Like A Pro)
What Are the Best Trading Strategies for the Dragonfly Doji?
Here are three of the best trading strategies to use with the dragonfly doji pattern:
1. Trading the Dragonfly Doji with RSI
RSI Settings: Default (14 SMA, 2 Standard Deviation)
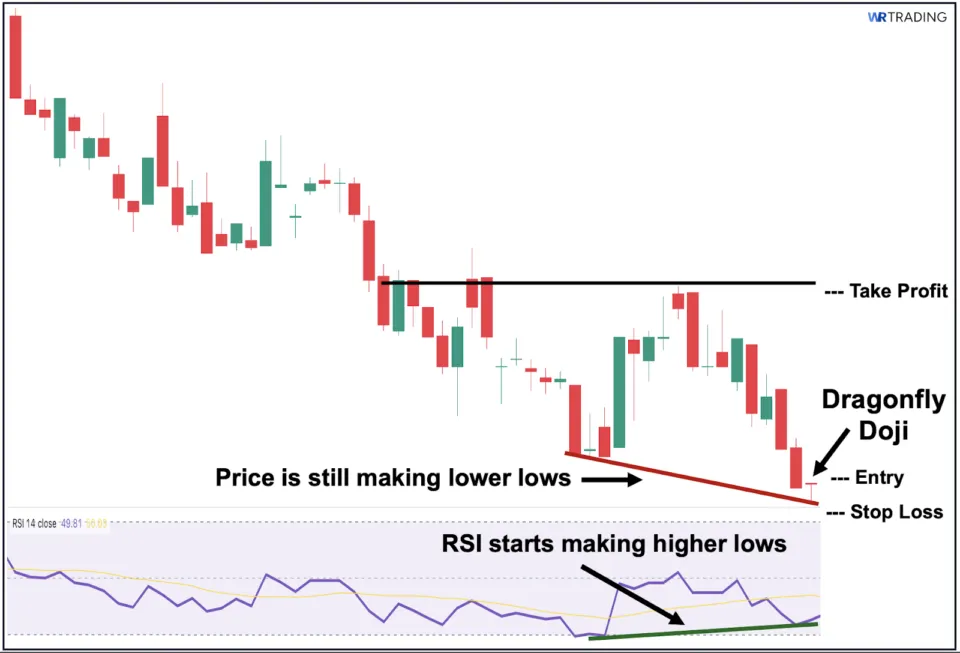
First, we can combine the dragonfly doji pattern with RSI. In technical analysis, a bullish RSI divergence occurs when the RSI’s slope begins to move upward while the price continues to decline, forming lower lows. In this scenario, price shows continued weakness, sloping downward, while the RSI starts making higher lows, signaling that downside momentum may already be fading. As a momentum indicator, the RSI serves as a leading signal in this setup, indicating a potential end to the ongoing downtrend.
To illustrate this, we can see in the image above that while the price continues to decline and form new lows, the RSI gradually begins to slope upward, creating a clear divergence. Within this setup, the appearance of the dragonfly doji (despite being a doji variant) acted as added confirmation of the potential shift in market sentiment. Still, many traders prefer to wait for a confirmation candle before entering a long position.
How to Trade (Trade Setup):
- Entry: Place your entry just above the dragonfly doji’s high (remember, wait for a confirmation candle to first appear).
- Stop Loss: Place your stop loss just below the dragonfly doji’s low.
- Take Profit: Place your TP a few ticks below the nearest key structural level.
2. Trading the Dragonfly Doji with Moving Average
MA Settings: Simple Moving Average (MA Length: 20)
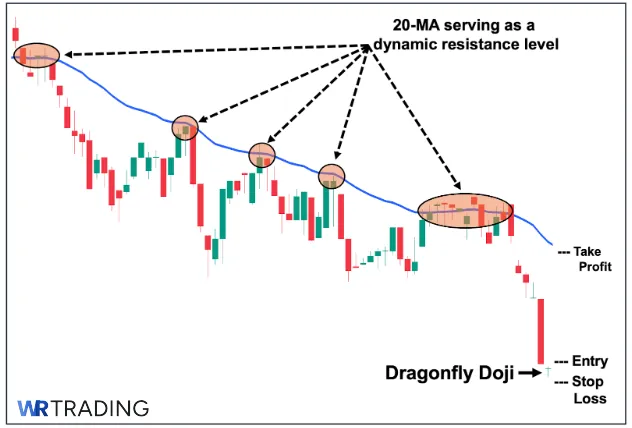
Second, we can use a moving average, specifically, the 20-day simple moving average or 20 SMA, to help identify a dynamic resistance level where price may struggle to move any higher. As shown above, we can see how the 20 SMA has acted as a resistance level during the prevailing downtrend, repeatedly preventing the price from breaking above it.
This suggests that the 20 SMA is a significant level, and the price is likely to face renewed selling pressure once it approaches this area. Therefore, in the event that the dragonfly doji does lead to a bullish rally, we can expect the 20 SMA to serve as a major resistance level that will likely prevent the price from advancing further.
How to Trade (Trade Setup):
- Entry: Place your entry just above the high of the dragonfly doji.
- Stop Loss: Place your stop loss just below the dragonfly doji’s low.
- Take Profit: Place your TP a few ticks below the 20-MA level, as it has successfully acted as a dynamic resistance level and has been preventing the price from rallying past it.
3. Trading the Dragonfly Doji with Market Structure
Finally, we can also view the dragonfly doji’s appearance within the broader market structure. This can be done by zooming out to understand better how the pattern fits into the overall price movement. Unlike technical indicators, this approach places strong emphasis on historical price action and key structural levels. This is an area where the dragonfly doji often proves useful.
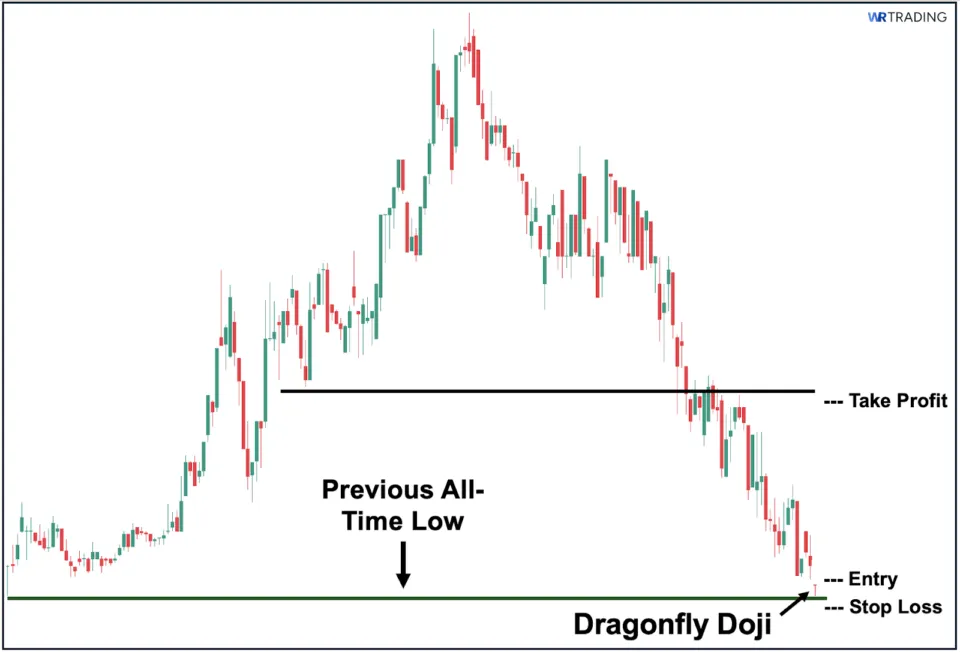
As shown in the image above, the dragonfly doji formed as its lower wick touched a previous major support level. This gives the pattern greater weight, as it visually captures the buying interest that remains active around that area. With sellers failing to push the price further down, this support level is likely to hold, making a downside break more difficult. In some cases, this growing buying pressure may even spark a full trend reversal to the upside.
How to Trade (Trade Setup):
- Entry: Place your entry just above the dragonfly doji’s high (remember, wait for a confirmation candle to first appear).
- Stop Loss: Place your stop loss a few ticks below the previous all-time low support level.
- Take Profit: Place your TP a few ticks below the nearest key structural level.
(Learn To Trade And Read Candlestick Patterns Like A Pro)
What is the Success Rate of the Dragonfly Doji?
Generally, the dragonfly doji should never be used in isolation, as it cannot strongly indicate a shift in market sentiment or serve as a reliable reversal pattern on its own. That said, if the pattern is immediately followed by a confirmation candle suggesting a potential bullish trend reversal, the overall success rate of the reversal playing out tends to fall within the 50-60% range.
Additionally, this success rate can be further improved when the pattern is backed by other supporting technical tools such as the RSI, volume, or key moving averages. Although keep in mind that the pattern’s effectiveness still heavily depends on the specific asset being traded, the broader market context, and, of course, your complete trade setup.
What are the Pros and Cons of the Dragonfly Doji?
The following are the key pros and cons of using the dragonfly doji:
Pros
- Effective near structural support levels
- Acts as an early sign of buyer interest
- Captures the rejection of lower prices
Cons
- Lacks strength if used in isolation
- Requires confirmation to be effective
- Demands a deeper market context understanding
What are the Advantages of the Dragonfly Doji Pattern?
Here are the notable advantages of using the dragonfly doji as part of your trading strategy:
- Effective near structural support level: First, the dragonfly doji tends to be more meaningful when it forms near or directly at key historical support levels. For example, if the dragonfly’s long lower wick touches a known support zone, it can suggest that buyers are actively defending the area and that the level may continue to hold, potentially preventing further price decline.
- It can act as an early sign of buyer interest: Second, although the dragonfly doji is not a decisive bullish reversal pattern, its bullish directional bias can still serve as an early sign that buyers are beginning to step in at lower levels. This can help traders prepare to respond depending on what the next candle reveals: whether a continuation candle (indicating a continued downward move) or a confirmation candle (indicating a potential bullish reversal).
- It captures the rejection of lower prices within the session: Third, the dragonfly doji offers a clear visual snapshot of the market’s intraday activity during a specific trading period. At a glance, we can see that the opening and closing prices are nearly the same or even identical, and that sellers initially drove the price lower. However, buyers eventually stepped in and absorbed the selling pressure, pushing the price back up near the open, resulting in a long lower wick that reflects a strong rejection of the session’s lows.
What are the Disadvantages of the Dragonfly Doji Pattern?
Here are the key disadvantages you need to be aware of when using the dragonfly doji:
- It lacks strength when used in isolation: First, as a variant of the doji, which is inherently indecisive, the dragonfly doji is unwise to be used in isolation as a sole bullish signal. We strongly advise against relying on it as the only basis for a trade, as treating its bullish directional bias as a standalone reversal indicator makes it highly prone to producing false signals.
- Requires confirmation to be effective: Second, because the dragonfly doji is not a strong signal on its own, it depends heavily on additional confirmation: either through a follow-up bullish candle or a supporting technical indicator that helps validate a potential shift in sentiment toward bullish. Without this confirmation, the dragonfly doji tends to be unreliable and easily misinterpreted.
- Demands a deeper understanding of market context: Third, to fully recognize the value of the dragonfly doji, it must be interpreted within the broader market environment, including key support levels and overall sentiment. This makes the pattern less suitable for beginners, as proper interpretation calls for a more advanced grasp of price action and market dynamics.
Can the Dragonfly Doji Produce False Signals?
Yes, the dragonfly doji can and will produce false trading signals. As a matter of fact, despite its bullish directional bias, it is not a strong bullish signal when viewed on its own. This is because it remains to be a variant of the doji, which is inherently indecisive. As a result, it is prone to generating false bullish signals, particularly when used in isolation.
That said, if it is followed by a confirmation candle or backed by a complementary technical analysis tool, this risk can be reduced to some extent. Nevertheless, like any candlestick pattern, it is never 100% accurate or reliable, and it can still lead to false signals despite the added confirmation.
What are the Alternatives to the Dragonfly Doji Pattern?
Here are two potential alternatives to the dragonfly doji pattern:
1. Hammer
On the price chart, the dragonfly doji and the hammer look quite similar. However, unlike the dragonfly doji, the hammer is often treated as a standalone bullish reversal pattern that can be used more decisively on its own. This is primarily because it is not a doji (which is inherently indecisive). Rather, the hammer consists of a single candle with a small real body near the top and a relatively long lower wick.
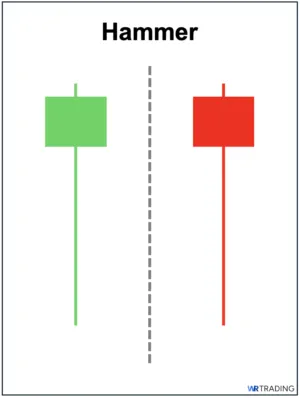
Similar to the dragonfly doji, the hammer’s long lower wick reflects a failed attempt by sellers to push prices lower, as buyers eventually stepped in and defended the lows before the end of the trading session.
2. Tweezer Bottom
Unlike the dragonfly doji, which only suggests a bullish directional bias and often requires confirmation, the tweezer bottom is considered a strong and effective bullish reversal pattern that can be used more confidently on its own. The pattern is composed of two candles with identical or nearly identical lows, signaling a clear rejection of lower prices.
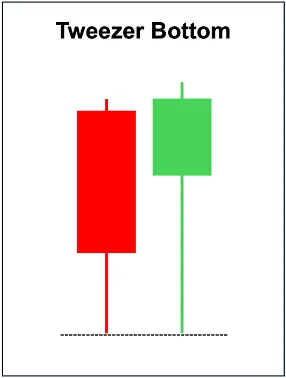
This repeated test of the same support level often marks a key demand area, as it reflects sellers’ failed attempts to push the price further down, with buyers stepping in and regaining control by the close of both candles.
Find more alternatives in our Candlestick Pattern Bible PDF (free download).
(Learn To Trade And Read Candlestick Patterns Like A Pro)
What Other Types of Dojis Exist?
The following are the other types of dojis that can appear on a price chart:
Gravestone Doji
First, the gravestone doji is the complete opposite of the dragonfly doji and resembles an inverted capital letter “T.” The pattern features a long upper wick/shadow, accompanied by an extremely small or nonexistent lower wick/shadow.
Four Price Doji
Second, the four-price doji is a one-candle neutral pattern in which the opening, high, low, and closing prices are all identical or equal. Hence, the four-price doji appears as a thin horizontal line or a minus sign (–) on the price chart, as it has no real body and no upper or lower wicks.
Rickshaw Man Doji
Third, the rickshaw man has symmetrical upper and lower wicks. That said, compared to the dragonfly doji, the rickshaw man’s upper and lower wicks (or shadows) are significantly longer.
Long-Legged Doji
Fourth, like the rickshaw man, the long-legged doji also has long wicks/shadows on both sides. That said, one of its wicks/shadows (either upper or lower) is distinctly larger than the other.
High Wave Doji
Fifth, a high wave doji has “exaggerated” wicks/shadows on both sides (even much bigger than long-legged or rickshaw man dojis). Hence, this makes it literally stand out on a price chart.
Tri-Star Doji
Finally, the tri-star doji is an incredibly rare formation consisting of 3 dojis occurring consecutively. This type of doji usually appears when volatility and liquidity in a particular asset are both extremely low.
Learn Pattern Trading with the WR Trading Mentoring
Understanding the dragonfly doji goes beyond simply recognizing its shape on the chart. To interpret it effectively, traders really need to consider the broader market context and key structural levels. Due to this fact, the pattern may not be ideal for those who are just starting out, as it demands a more advanced grasp of price behavior and market psychology. For those looking to build this valuable skill, we cover the practical use of the dragonfly doji in depth (alongside other technical tools) during our mentoring sessions at WR Trading.
(Learn To Trade And Read Candlestick Patterns Like A Pro)
Conclusion: Dragonfly Doji Is A Bullish Possibility But Not a Guarantee
All things considered, the dragonfly doji is one of the more visually recognizable doji variants, providing traders with a clear visual illustration of intraday rejection at much lower prices. Its extremely slim body, coupled with a noticeably long lower wick, reflects early selling pressure that was eventually absorbed by buyers, who managed to bring the price back near the opening level by the close of the session.
From our charting experience, the dragonfly doji is rarely a credible bullish reversal signal on its own. Despite this, it stands out, as it often hints at a potential shift in momentum ahead of time, where the presence of buyers begins to challenge the prevailing selling pressure. Its significance and value also increase considerably when it appears around a well-established support level during a downtrend, particularly when paired with confirmation from another technical indicator.