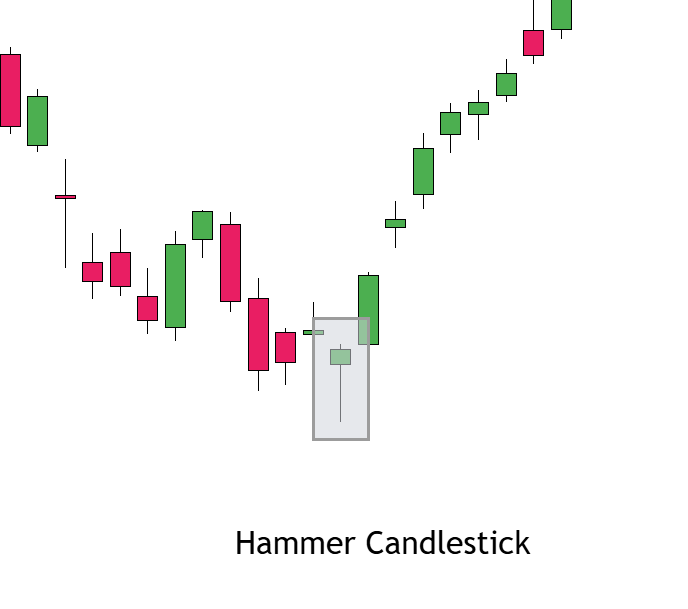
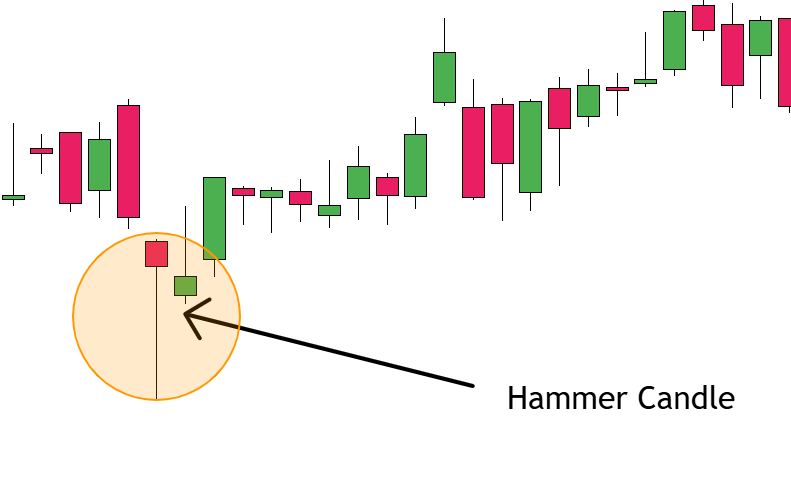
The hammer candlestick pattern is a single-bar formation that signals a possible bullish reversal after a decline in price. It has a small body near the top of the range, little to no upper wick, and a long lower shadow that shows the market dipped significantly but was pushed back up before closing.
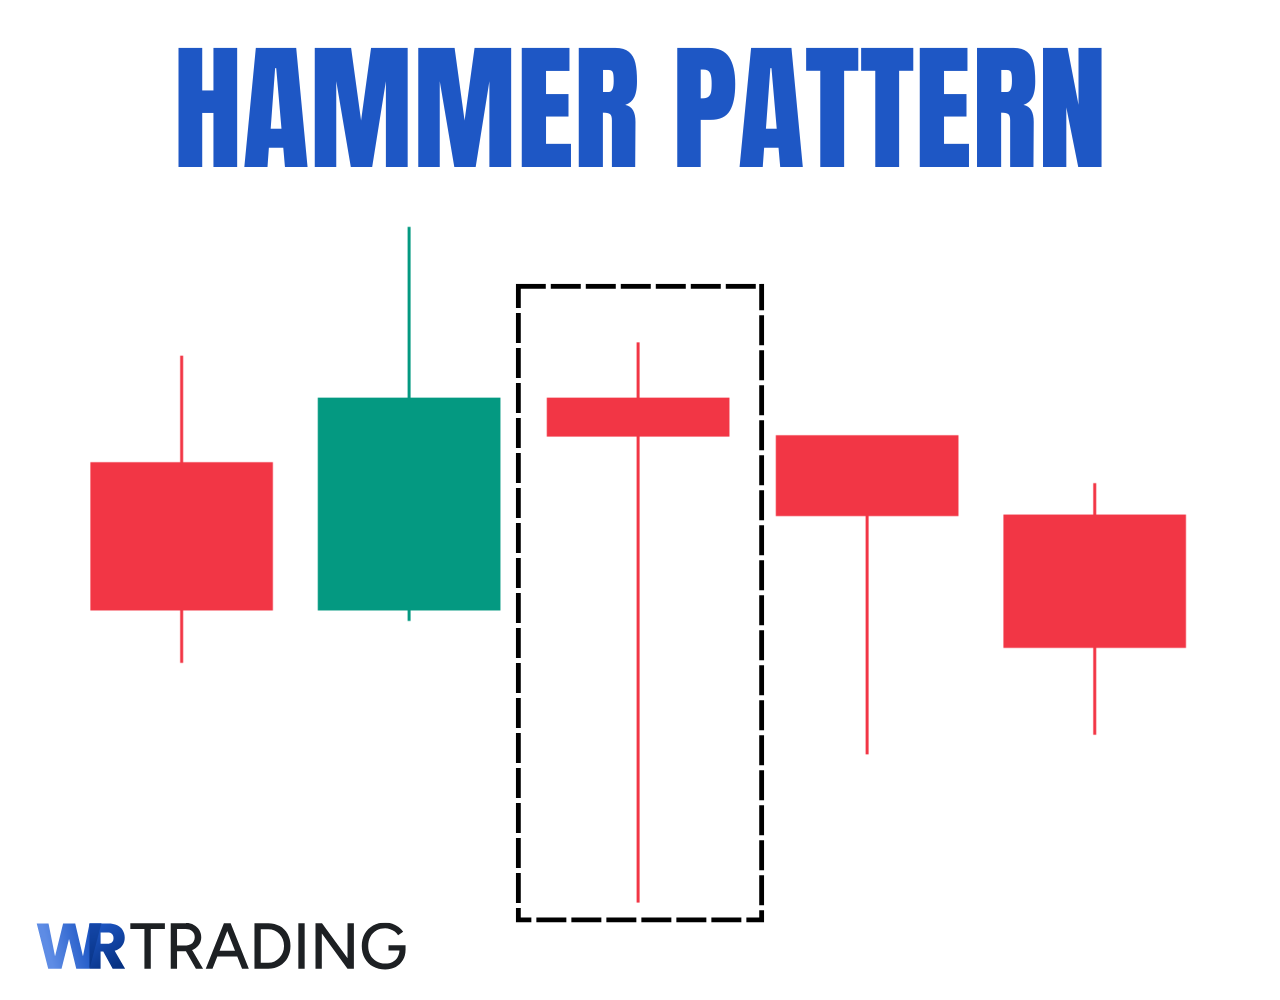
How the Hammer Candlestick Pattern is Structured:
- Construction: A single candle with a small real body near the top of the range, little to no upper wick, and a long lower wick that shows price was rejected at lower levels.
- Forecast: A bullish reversal is likely if confirmed by a strong green candle closing above the hammer’s high.
- Type of Pattern: Single-candle bullish reversal pattern.
- Trend Prior to the Pattern: Forms after a downtrend, signaling a possible upward reversal.
- Opposite Pattern: Inverted Hammer
- Stop-Loss Placement: Below the low of the hammer’s wick to allow for price fluctuations while maintaining a favorable risk-to-reward ratio.
- Candlestick Success Rate: Around 55% – 72%
This article covers what the pattern means, how to trade it, the difference between the hammer and inverted hammer, and how it compares to similar formations.
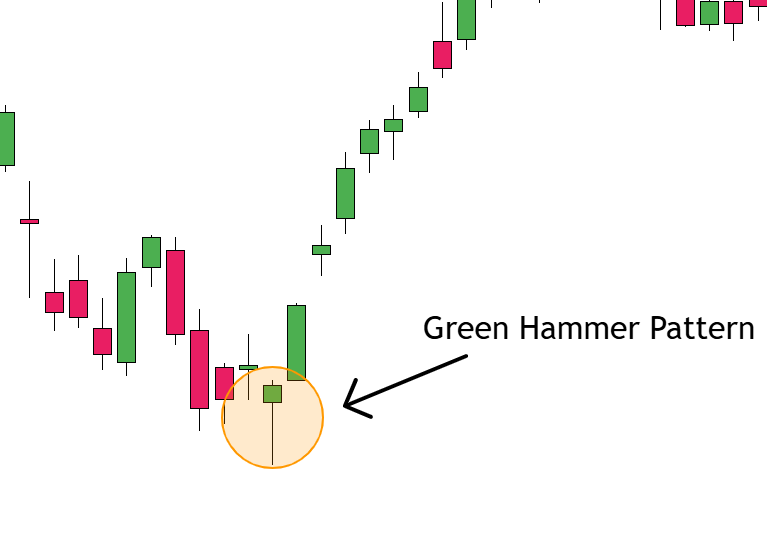
What Is A Green Hammer Pattern?
A green hammer is a hammer candlestick where the closing price is above the opening price. This means the candle finishes higher than it started, reinforcing the idea that buyers were able to completely take over by the end of the session. Green hammers are considered slightly more bullish than red hammers because they show not just a rejection of lower prices, but also that bulls were strong enough to close the candle above the open.
What Is A Red Hammer Pattern?
A red hammer has a closing price that is slightly below its opening price, meaning the session still ended in the red, despite a strong recovery from the lows. This shows that buyers pushed back after sellers drove the price lower, but they weren’t able to fully gain control by closing in the green. While it still qualifies as a hammer pattern, the red body can suggest a more neutral or hesitant reaction by the market.
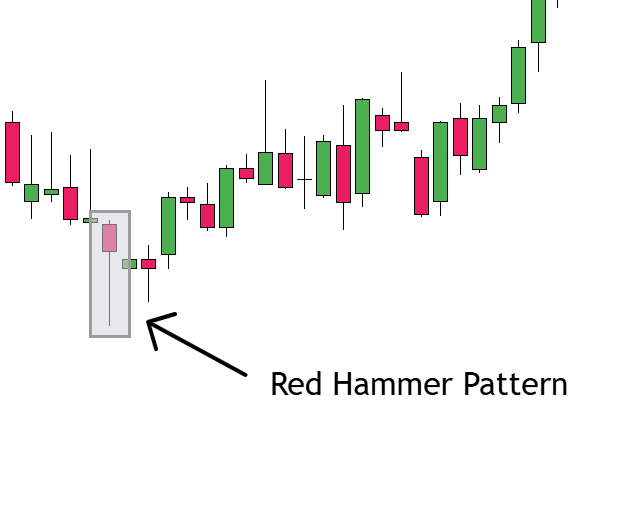
Red hammers can still lead to bullish reversals if they appear after strong downtrends or during key market reversals, but they tend to need stronger confirmation. Traders often wait for a bullish candle to follow before entering a position, to confirm that momentum has shifted. Volume and nearby support zones also help determine if a red hammer is worth trading or best avoided.
What Does A Hammer Candlestick Pattern Indicate?
The hammer pattern indicates a potential shift in momentum from bearish to bullish. The long lower wick tells us that sellers were dominant during the session but failed to hold those lower prices. Buyers stepped in with enough strength to drive the price back up toward the open, and in some cases above it. This sharp rejection of lower prices shows that demand may be returning and the downtrend could be slowing or ending.
Moreover, from a psychological standpoint, the hammer reflects uncertainty turning into confidence. Early in the candle, sellers appear in control and may even trigger fear or panic among market participants. However, the strong buying into the close signals that sentiment is starting to turn.
This makes the hammer a valuable clue in spotting potential reversals, but it’s not a standalone signal. Pair it with volume analysis, support zones, or momentum indicators to confirm that the market is truly ready to move higher.
Where Can The Hammer Candlestick Pattern Appear?
The hammer pattern can show up in different market conditions, but its meaning and reliability change depending on where it forms. Here’s how to understand each scenario and what the pattern typically signals in that context:
- Downtrend (Most Reliable Context): When a hammer appears after a clear downward move, it’s considered a potential reversal signal. The long lower wick reflects an initial push by sellers followed by a strong recovery, showing buyers may be stepping in. If confirmed by a bullish candle next, this setup often marks the end of the downtrend or the start of a bounce.
- Pullback Within an Uptrend (Trend Continuation Signal): Hammers can also pop up during small dips in a larger uptrend. These usually happen when price pulls back to a support level, like a moving average or trendline, before the next leg up. In this case, the hammer can act more like a continuation signal rather than a full reversal. It’s the market catching its breath before pushing higher.
- Consolidation Zones (Less Reliable); Hammers that appear in consolidation zones are trickier. Without a strong trend before them, they don’t carry much weight. Price might bounce a little, but the odds of a meaningful move are lower. If you see a hammer form in a flat range with no real momentum behind it, it’s usually better to skip the trade or wait for a breakout first.
How to Trade the Hammer Candlestick Pattern
Trading the hammer pattern is about recognizing the right conditions, confirming the signal, and then planning your entry, stop-loss, and target with a clear setup. The goal is not to rely on the hammer alone but to use it as a starting point for a structured trade plan.
- Identify the Preceding Downtrend
- Spot the Hammer Candlestick Pattern
- Check for Support or Confluence
- Wait for Confirmation
- Set Entry and Stop-Loss
- Choose Your Trading Take Profit (Goal of the Setup)
- Combine Everything and Open Your Trade – Entry Point (Setup up Stop Loss / Positions Size) (Target)
- Monitor the Trade and Manage Risk
Step 1: Identify the Preceding Downtrend
Before the hammer pattern has any meaning, there must be a visible downtrend. This could be a series of lower highs and lower lows over several candles. A hammer found in sideways or uptrending price action carries less value and often leads to false signals.
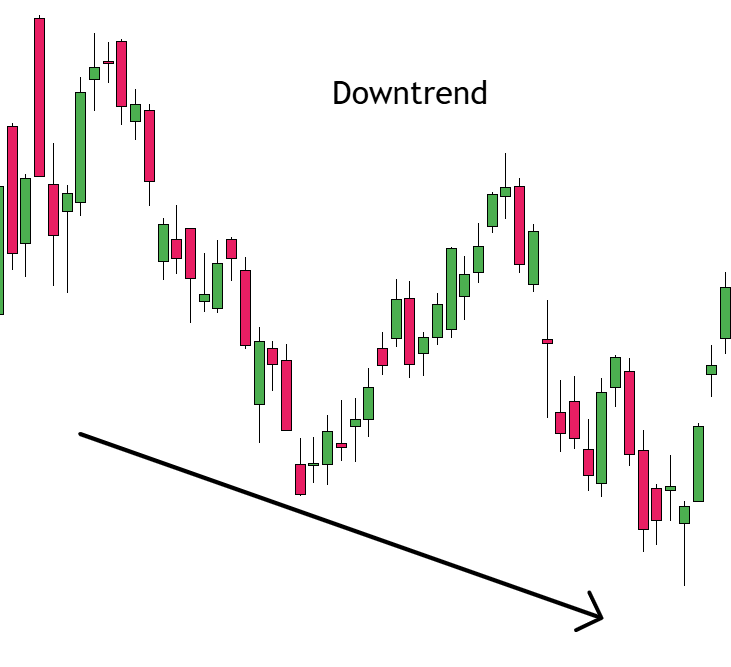
Focus on charts where the price has clearly been declining. Look for signs of exhaustion in the move like long red candles, strong volume spikes, or a move into a known support zone. The hammer should be the first sign that the downward momentum is slowing or reversing.
Step 2: Spot the Hammer Candlestick
Now look for the candle itself. A valid hammer has a small real body near the top of the candle range, a long lower wick that’s at least twice the size of the body, and little to no upper wick. The color of the candle doesn’t matter as much, but a green body tends to be slightly more bullish.
You can scan for this visually or use candlestick pattern scanners on platforms like TradingView or MetaTrader. Always double-check the proportions. If the wick isn’t clearly longer than the body, or the body is centered instead of near the top, it might be another pattern, not a hammer.
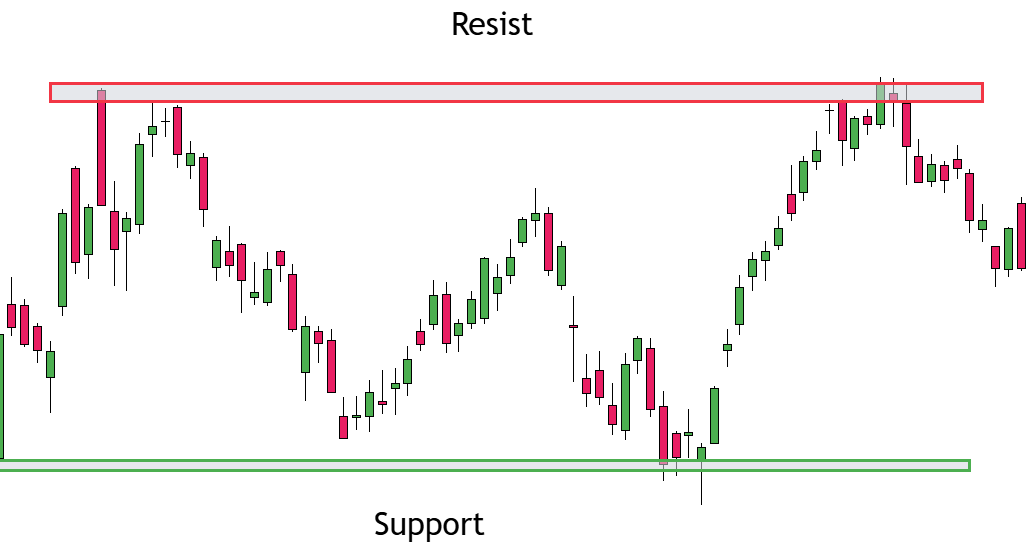
Step 3: Check for Support or Confluence
A hammer on its own is not enough. Check if the candle forms at a logical place on the chart, such as a horizontal support zone, a Fibonacci level, a round-number price level, or near a trendline. This adds credibility to the setup and increases the chance that the reversal will hold.
You can also use technical indicators to support your analysis. For example, if the hammer forms while RSI is below 30 (indicating oversold conditions), that’s added confirmation. The more factors aligning at the hammer’s location, the stronger the potential setup.
Step 4: Wait for Confirmation
Do not enter a trade as soon as you see the hammer form. Wait for the next candle to close above the hammer’s high, which will be your confirmation. A strong bullish candle following the hammer suggests that buyers are stepping in and momentum is shifting.
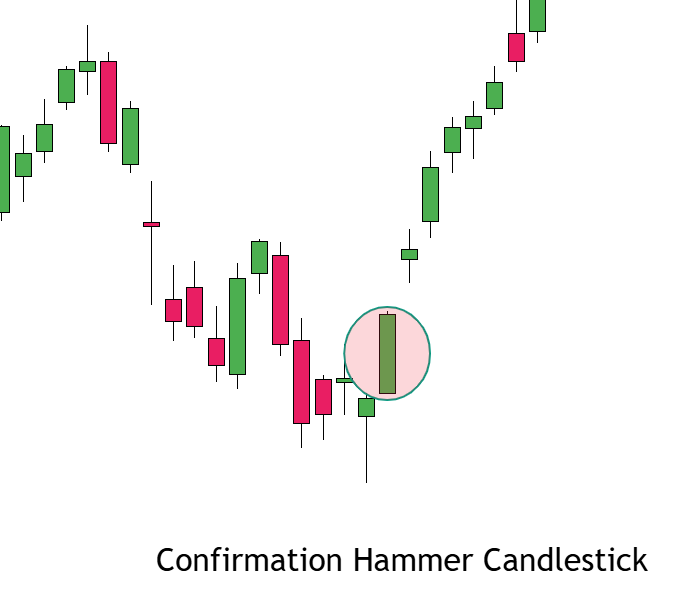
However, if the next candle closes weakly or fails to break the hammer’s high, skip the trade. Many failed hammer signals occur when traders act too early. Being patient and waiting for confirmation reduces the chances of getting caught in a continuation of the downtrend.
Step 5: Set Entry and Stop-Loss
Once the confirmation candle closes, your entry is just above its high or the high of the hammer, whichever is more conservative. This protects you from premature entries while still giving a strong signal that momentum is moving up.
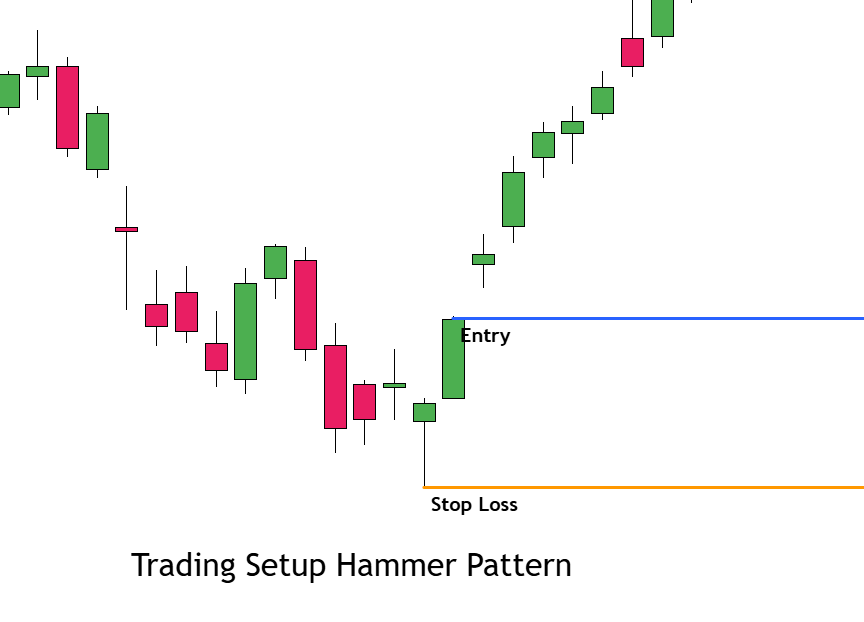
The stop-loss goes just below the low of the hammer, serving as your invalidation point. If the price breaks below that low, the pattern has failed, and you want to be out of the trade. Keep this stop precise and don’t widen it unnecessarily, as it weakens your risk control.
Step 6: Choose Your Trading Take Profit (Goal of the Setup)
A take-profit target should match the structure of the chart and the type of move you’re aiming for. When trading the hammer pattern, the most common targets are recent swing highs, previous resistance zones, or price levels where the market previously paused or reversed. These points act as natural friction zones where upward momentum can slow down, so they make sense as exit areas.
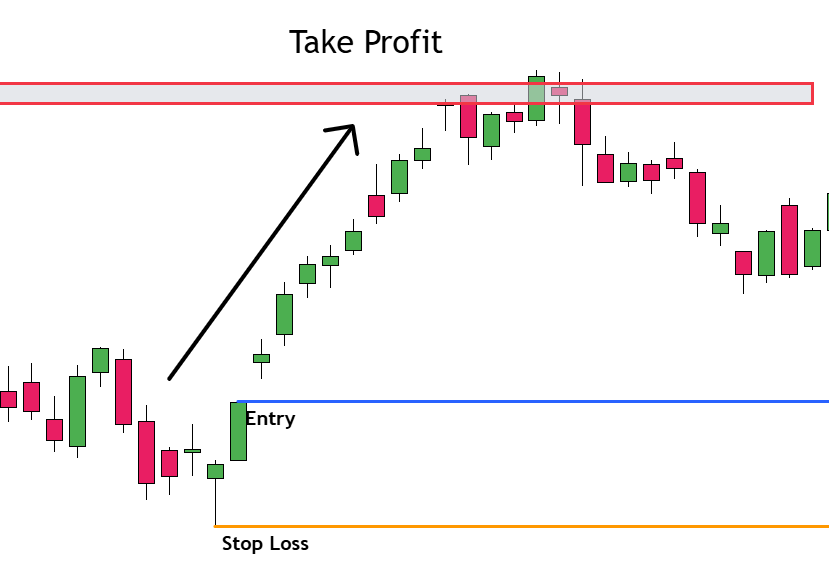
Also, for traders using a risk-reward approach, a target set at twice the stop-loss distance (2:1) is a common standard. If the stop is 1.5%, the target should be 3%. This not only keeps trades consistent but also filters out setups with poor potential.
Step 7: Combine Everything and Open Your Trade – Entry Point (Setup up Stop Loss / Positions Size) (Target)
Enter the trade once a candle closes above the hammer’s high. This confirms momentum is shifting and avoids jumping in too early. The entry should be just above that level to give the move room to develop.
Place the stop-loss just below the hammer’s low – if the price breaks it, the setup has failed. Calculate your position size based on that risk range, keeping your total exposure within your chosen limit. Set the target in advance, using either a nearby resistance level or a fixed reward-to-risk ratio.
For example, if your stop-loss is 2% away from your entry and you only want to risk $20, you should trade a position size where 2% equals $20, which would be a $1,000 position. Tools like position size calculators make this easy and help you stay consistent.
Step 8: Monitor the Trade and Manage Risk
Once the trade is open, monitor the price action around resistance zones or during major news events. If the price moves in your favor, consider moving your stop-loss to break-even to lock in a risk-free trade.
You can also scale out of the trade partially at key levels and leave a portion to run, depending on your strategy. But the key is not to interfere with the trade without a reason. Follow your rules and let the setup play out based on your plan.
(Learn To Trade And Read Candlestick Patterns Like A Pro)
How to Find the Right Hammer Pattern Setup
Not every hammer is worth trading, and some of them show up in random spots with no real structure around them, which tend to fail more often than not. The best setups usually have more going for them than just the candle shape. A proper hammer setup has clear conditions behind it – where it forms, how it looks, and what else is happening on the chart.
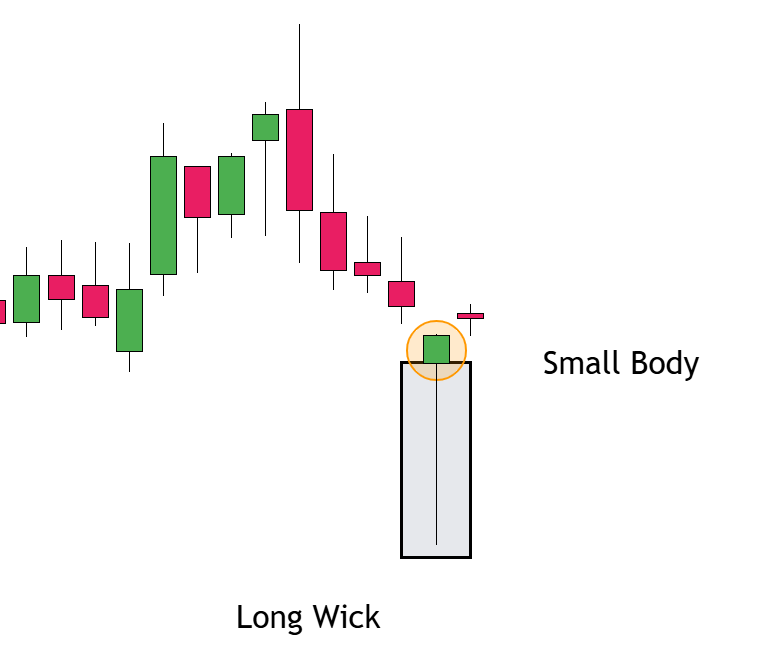
A good hammer has a small body near the top, a long lower wick (at least two times the body), and little to no upper shadow. But just as important is where it forms – look for it at support zones, major trendlines, or areas with previous buying interest. If you’ve got a clean downtrend leading into a hammer that forms right at a known support area, and maybe even a volume spike at the low – that’s the kind of setup you want to focus on.
Hammer vs Inverted Hammer Candlestick Patterns
The hammer and inverted hammer are similar in structure, but their meaning and reliability differ. Both have small real bodies and long wicks, but the direction of the wick changes the message behind the candle. Understanding the difference is important for reading market sentiment accurately.
The Hammer
The hammer has a long lower wick and forms after a decline. It shows that sellers pushed the price lower during the session, but buyers stepped in with enough strength to bring it back near the open. This shift in control often marks the beginning of a bullish reversal or, at minimum, a temporary bounce. The lower wick reflects rejection of lower prices, and confirmation from the next candle adds to the setup’s strength.
The Inverted Hammer
The inverted hammer, on the other hand, has a long upper wick and also forms after a downtrend. This time, the price was pushed higher during the session, but it couldn’t hold those gains and closed back near the open.
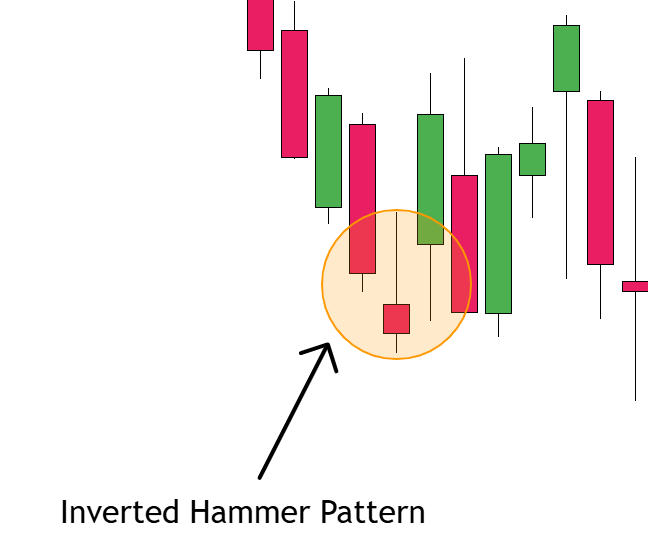
While the Inverted Hammer can signal potential reversal, it’s weaker than a standard hammer. Buyers showed up, but couldn’t fully take control, they were tested and pushed back by sellers into the close. For this reason, traders tend to require stronger confirmation before acting on an inverted hammer. If the next candle doesn’t show clear bullish strength, the setup often fails.
What Are the Pros and Cons of Trading the Hammer?
A Hammer Candlestick Pattern has various advantages as well as disadvantages that need to be highlighted:
Pros
- Easy to identify visually
- Works on all timeframes
- Signals trend reversal
- Good for spotting bottoms
- Simple entry and stop-loss setup
- Can signal momentum shift before indicators do
- Often forms at key support zones
- Can be used with other strategies
- Helps catch early reversal points
- Pairs well with volume analysis
Cons
- Can fail without confirmation
- Appears often, not always valid
- Risk of false signals in choppy markets
- Misleading without proper context
- Not reliable in low-volume areas
- Strong downtrends can break through it easily
- Needs confirmation to be tradeable
- Easy to mislabel similar candles
- Weak when formed in consolidation
- Entry timing can be tricky in fast markets
What Is the Hit Rate of the Hammer Candlestick Pattern?
The hammer candlestick has a historical hit rate of around 55% to 72%, depending on the context and confirmation used. According to Thomas Bulkowski’s Encyclopedia of Candlestick Charts, the hammer pattern shows a 60.3% success rate in bullish reversals when confirmed by a breakout above the high.
That figure drops if the pattern is traded without confirmation or forms in weak setups. Other independent backtests on crypto and forex charts suggest similar results, especially on the daily timeframe, where the pattern tends to perform better than on lower time frames.
Can the Hammer Pattern Have Failure Signals?
Yes, the hammer pattern can have failure signals if it forms in the wrong context or without confirmation. This happens when key factors like support levels, volume, or follow-up price action are missing. Spotting early signs of a weak hammer setup can help avoid false entries or allow for faster exits if momentum doesn’t hold.
Here are some common failure signals to watch for:
- No confirmation on the next candle: If the next candle doesn’t close above the hammer’s high, it shows buyers aren’t following through. Without confirmation, the pattern loses strength and is more likely to break down than reverse the trend.
- Break below the hammer’s low: This is a clear invalidation. If the price drops below the low of the hammer, the entire setup is considered failed. It often signals that sellers are still in control, and the market is pushing lower.
- Hammer forms in the middle of a range: Patterns that form inside sideways price action don’t carry much weight. In these cases, the hammer might just be a temporary bounce, not a true shift in direction.
- Weak volume during the hammer: Low volume on the hammer candle can signal a lack of real buying interest. Strong hammers usually come with a volume spike that shows buyers are stepping in with conviction.
- No nearby support level: A hammer that forms in “empty space” with no prior support, structure, or context is weaker. The pattern needs a reason to bounce. Without that, it’s often just a pause before another drop.
What are Possible Strategies for the Hammer Pattern?
The hammer pattern works best when it’s part of a structured plan – not something traded blindly as soon as it appears. Here are some common strategies traders use when working with hammers, each built around confirmation, context, and basic risk management.
- Hammer Reversal at Support: One of the most reliable ways to trade a hammer is when it forms after a downtrend and lines up with a strong support level. Look for prior price reactions at the same level – horizontal support, demand zones, or round numbers. Wait for a bullish candle to close above the hammer’s high before entering. Stop goes below the hammer’s low, and targets are set at the next resistance zone or swing high.
- Trend Continuation Entry on Pullback: In a strong uptrend, hammers often appear during pullbacks to moving averages or trendlines. If price drops into an area like the 50 EMA or an ascending trendline and prints a hammer, it can signal the end of the correction. Entry is taken after confirmation, with a tight stop below the hammer and a target back at the trend’s recent high.
- Hammer with RSI Divergence: When the hammer forms while RSI is showing bullish divergence – meaning the price makes a lower low but RSI makes a higher low – the pattern has stronger potential. This strategy works well on the 1H or 4H chart when the hammer lines up with structure. Combine this with volume to strengthen the setup.
- Multiple Timeframe Confirmation: A hammer forming on the lower timeframe (like 15m or 1H) becomes much more reliable if the same zone is showing support on a higher timeframe (like 4H or daily). Use the higher timeframe for structure and the lower one for precision entries. This helps avoid setups that look good on one chart but don’t line up with the bigger picture.
What Are The Alternatives To The Hammer Pattern?
| Pattern | Type | Avg Success Rate | Key Characteristic / Condition |
|---|---|---|---|
| Inverted Hammer | Reversal (Bullish) | 54 – 70% | Forms after a downtrend; long upper wick shows buying attempt. |
| Bullish Engulfing | Reversal (Bullish) | 63 – 67% | Large bullish candle fully covers the previous red candle. |
| Morning Star | Reversal (Bullish) | 52 – 75% | Three-candle pattern; signals a shift from sellers to buyers. |
| Dragonfly Doji | Reversal (Bullish) | 50 – 60% | Similar to hammer but opens and closes at the same price. |
| Shooting Star | Reversal (Bearish) | 54 – 71% | Bearish version of the inverted hammer; appears after uptrend. |
To see all our tested candlestick formations, download our free candle stick chart pattern pdf.
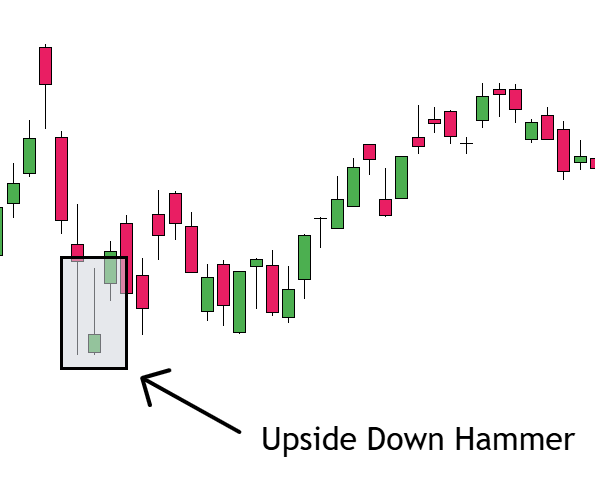
What Is a Upside-Down Hammer Candlestick Pattern?
The upside down hammer is more commonly known as the inverted hammer, which shows up after a move down and signals possible buying interest, but with less commitment than a standard hammer. What makes this pattern worth paying attention to is the shift in momentum. It shows that buyers were active during the session and tested higher prices, even if they didn’t close strong.
Traders don’t treat this as a high-conviction reversal on its own. It’s more of an early heads-up 0 something that suggests sellers might be losing steam, but confirmation is still needed. In most cases, it only becomes part of a trade setup if the next candle follows through cleanly or if it lines up with a solid support level or other signs of strength. On lower timeframes, it often gets ignored unless it’s backed by a clear structure.
Learn Pattern Trading With the WR Trading Mentoring
WR Trading runs a mentoring program designed to help traders build real skill using clean price action. The focus is on practical setups, structure, and execution – without the fluff or overcomplication you find in most trading education. It’s built for people who want to improve what they’re already doing or get serious about developing a proper system.
The mentoring covers how to use candlestick patterns like the hammer as part of a complete approach, not just as isolated signals. You’ll learn how to read the market in context, manage trades with a clear plan, and stop second-guessing entries. It’s direct, structured, and built around what actually works in live conditions.
(Learn To Trade And Read Candlestick Patterns Like A Pro)
Conclusion: The Hammer Candlestick Pattern Is Suitable for Trading Bullish Reversals
The hammer candlestick pattern is one of the few single-bar formations that traders continue to use because it works when applied with structure and confirmation. On its own, it won’t deliver consistent results. However, when it forms at the right level, after a clear move down, and is followed by solid price action, it becomes a high-probability signal in a larger setup.
The edge comes from knowing when to trust the hammer candlestick pattern, how to trade around it, and how to manage risk properly. As part of a full trading plan, the hammer offers reliable opportunities and fits well into strategies built on price action and support/resistance. Consider joining WR Trading to learn how to utilize the hammer to its fullest extent.
Frequently Asked Questions on Hammer Candlestick Pattern:
What Is the Hammer Candlestick Pattern Used For?
The hammer is used to spot potential reversals after a market has been moving down. It signals that buyers may be stepping in after sellers failed to push the price lower. Traders use it to look for early entries into a bounce or a trend shift.
Can the Hammer Pattern Appear in Any Market?
Yes, the hammer pattern can form in any market that follows price action, including crypto, forex, stocks, and futures. Its behavior and meaning remain the same regardless of the asset. What matters more is the trend and context around it.
How Do I Confirm a Hammer Before Trading It?
Confirmation usually comes from a bullish candle closing above the hammer’s high. This shows that buyers followed through and are gaining control. Without confirmation, the pattern is often ignored by experienced traders.
Does the Color of the Hammer Candle Matter?
The color isn’t the most important part. A green hammer is slightly more bullish, but a red hammer can still work if the structure and confirmation are strong. What matters is the price rejection shown by the long lower wick.
Is the Hammer Pattern Reliable on Its Own?
No, the hammer alone isn’t reliable enough to trade without confirmation or other supporting factors. It needs to be part of a larger setup that includes trend context and a clean price structure. Most failed trades happen when traders act on the candle alone.

